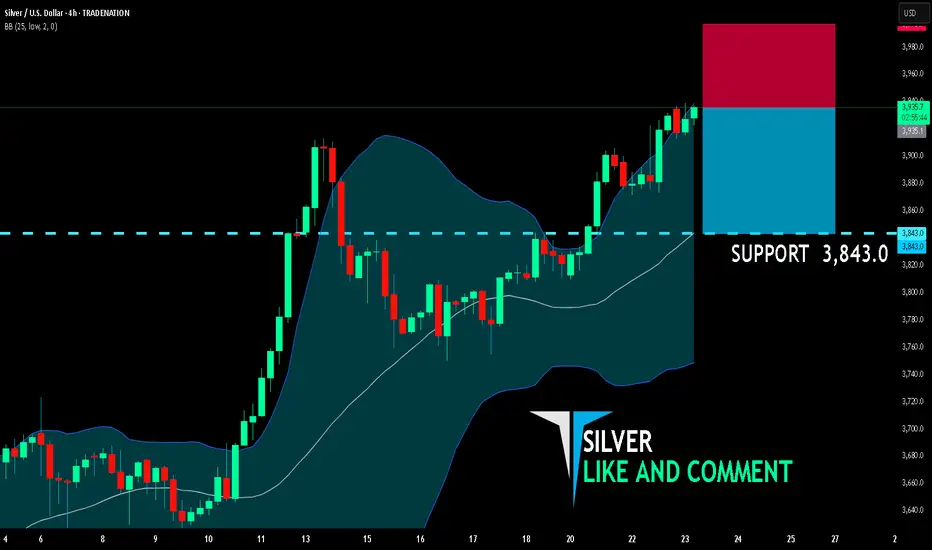
SILVER BEARS ARE GAINING STRENGTH|SHORT
SILVER SIGNAL
Trade Direction: short
Entry Level: 3,935.1
Target Level: 3,843.0
Stop Loss: 3,996.7
RISK PROFILE
Risk level: medium
Suggested risk: 1%
Timeframe: 4h
Disclosure: I am part of Trade Nation's Influencer program and receive a monthly fee for using their TradingView charts in my analysis.
✅LIKE AND COMMENT MY IDEAS✅
Short
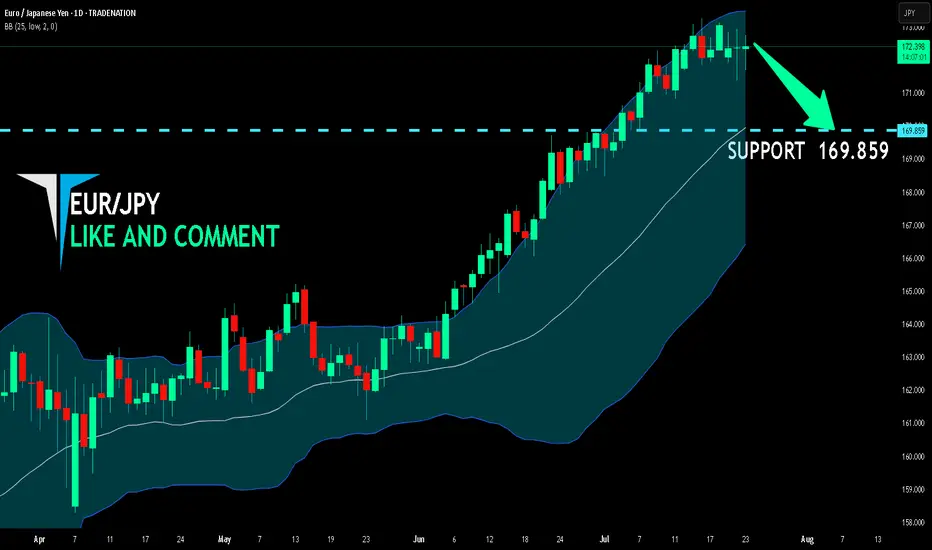
EUR/JPY BEST PLACE TO SELL FROM|SHORT
Hello, Friends!
EUR-JPY uptrend evident from the last 1W green candle makes short trades more risky, but the current set-up targeting 169.859 area still presents a good opportunity for us to sell the pair because the resistance line is nearby and the BB upper band is close which indicates the overbought state of the EUR/JPY pair.
Disclosure: I am part of Trade Nation's Influencer program and receive a monthly fee for using their TradingView charts in my analysis.
✅LIKE AND COMMENT MY IDEAS✅
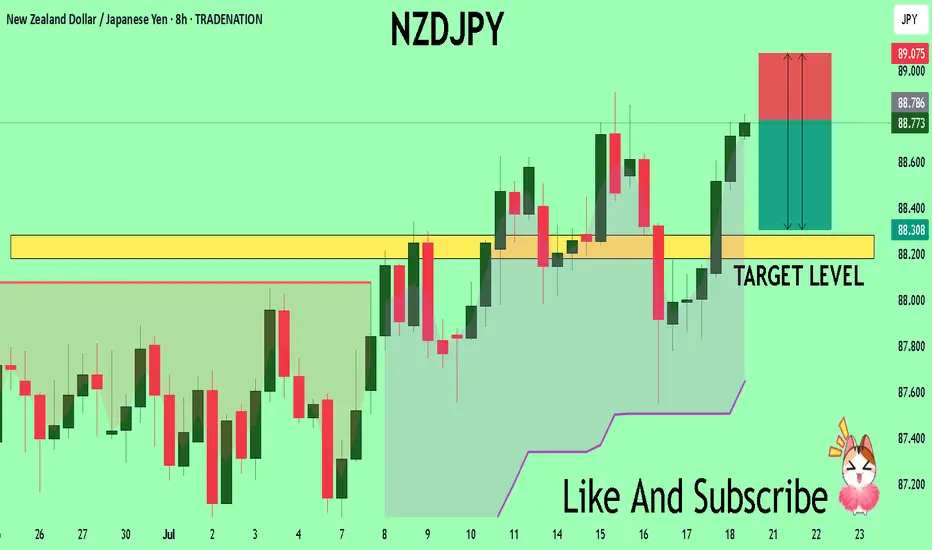
NZDJPY Set To Fall! SELL!
My dear subscribers,
My technical analysis for NZDJPY is below:
The price is coiling around a solid key level - 88.786
Bias - Bearish
Technical Indicators: Pivot Points Low anticipates a potential price reversal.
Super trend shows a clear sell, giving a perfect indicators' convergence.
Goal - 88.284
My Stop Loss - 89.075
About Used Indicators:
By the very nature of the supertrend indicator, it offers firm support and resistance levels for traders to enter and exit trades. Additionally, it also provides signals for setting stop losses
Disclosure: I am part of Trade Nation's Influencer program and receive a monthly fee for using their TradingView charts in my analysis.
———————————
WISH YOU ALL LUCK
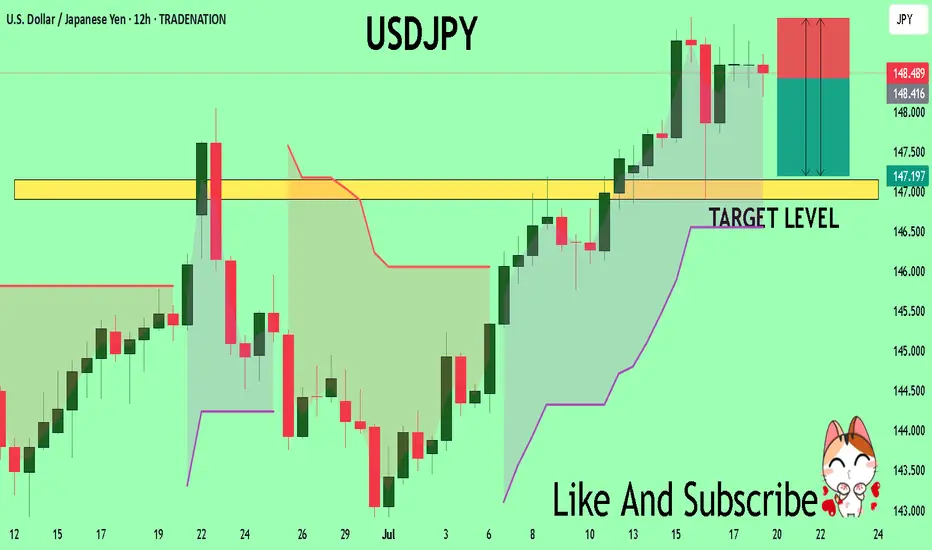
USDJPY Under Pressure! SELL!
My dear friends,
Please, find my technical outlook for USDJPY below:
The instrument tests an important psychological level 148.46
Bias - Bearish
Technical Indicators: Supper Trend gives a precise Bearish signal, while Pivot Point HL predicts price changes and potential reversals in the market.
Target - 147.15
Recommended Stop Loss - 149.17
About Used Indicators:
Super-trend indicator is more useful in trending markets where there are clear uptrends and downtrends in price.
Disclosure: I am part of Trade Nation's Influencer program and receive a monthly fee for using their TradingView charts in my analysis.
———————————
WISH YOU ALL LUCK
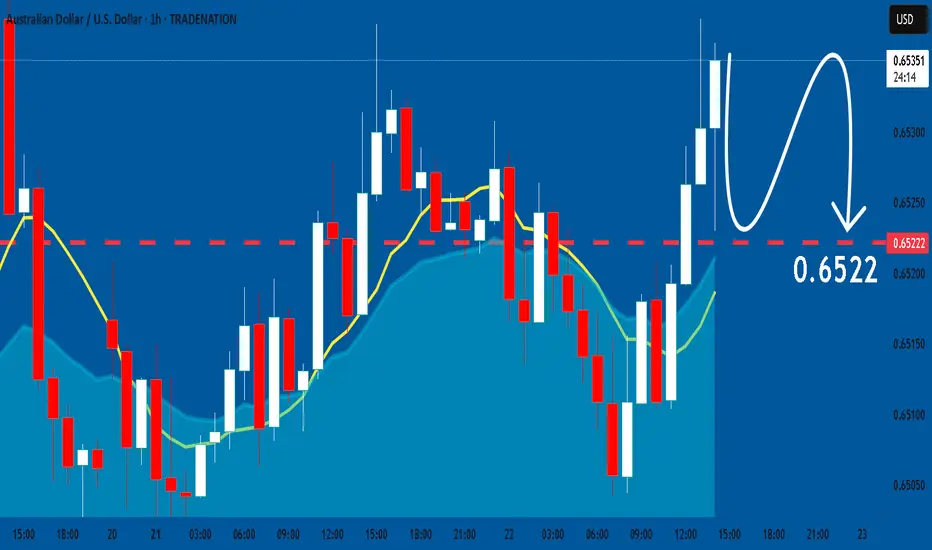
AUDUSD: Bearish Continuation is Highly Probable! Here is Why:
The charts are full of distraction, disturbance and are a graveyard of fear and greed which shall not cloud our judgement on the current state of affairs in the AUDUSD pair price action which suggests a high likelihood of a coming move down.
Disclosure: I am part of Trade Nation's Influencer program and receive a monthly fee for using their TradingView charts in my analysis.
❤️ Please, support our work with like & comment! ❤️
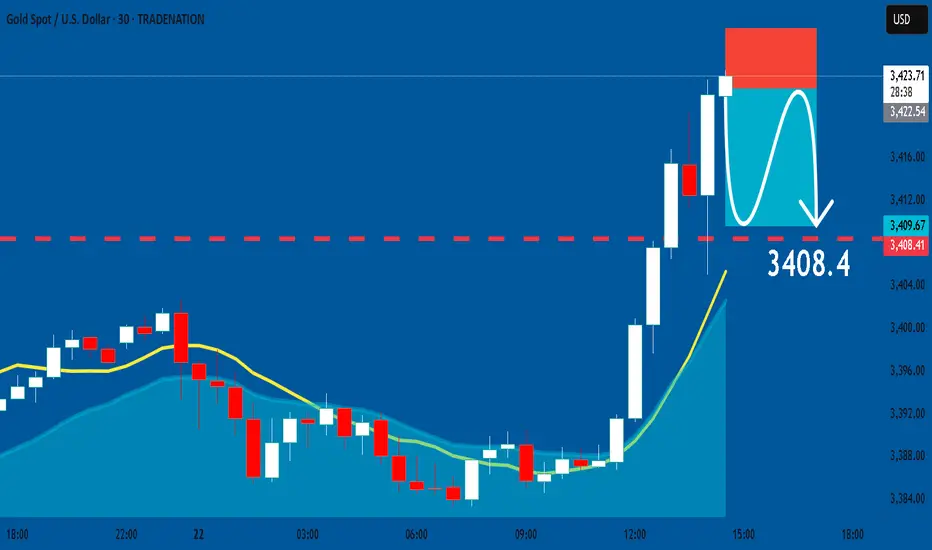
GOLD: Bearish Continuation & Short Trade
GOLD
- Classic bearish formation
- Our team expects fall
SUGGESTED TRADE:
Swing Trade
Sell GOLD
Entry Level -3422.5
Sl - 3428.1
Tp - 3408.4
Our Risk - 1%
Start protection of your profits from lower levels
Disclosure: I am part of Trade Nation's Influencer program and receive a monthly fee for using their TradingView charts in my analysis.
❤️ Please, support our work with like & comment! ❤️
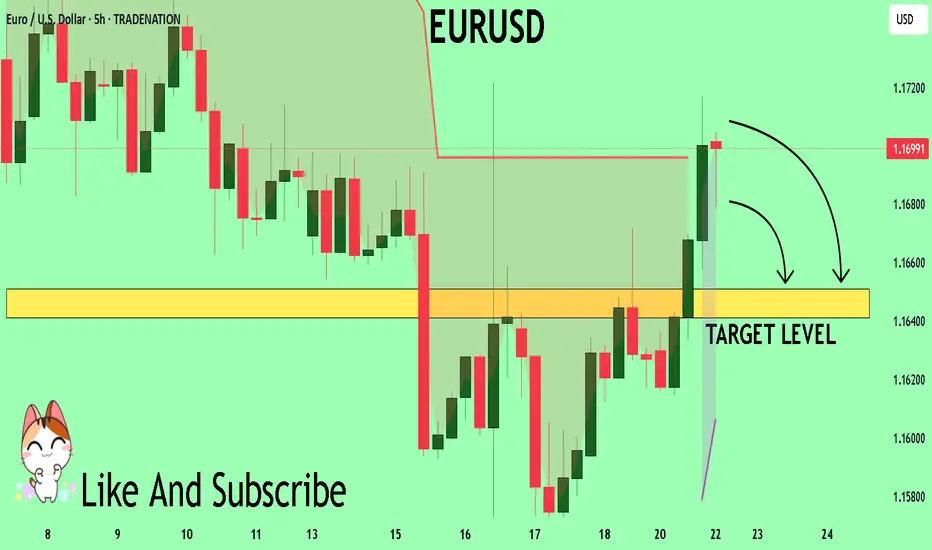
EURUSD Will Collapse! SELL!
My dear subscribers,
This is my opinion on the EURUSD next move:
The instrument tests an important psychological level 1.1696
Bias - Bearish
Technical Indicators: Supper Trend gives a precise Bearish signal, while Pivot Point HL predicts price changes and potential reversals in the market.
Target - 1.1651
About Used Indicators:
On the subsequent day, trading above the pivot point is thought to indicate ongoing bullish sentiment, while trading below the pivot point indicates bearish sentiment.
Disclosure: I am part of Trade Nation's Influencer program and receive a monthly fee for using their TradingView charts in my analysis.
———————————
WISH YOU ALL LUCK
EURGBP The Target Is DOWN! SELL!
My dear friends,
Please, find my technical outlook for EURGBP below:
The price is coiling around a solid key level - 0.8676
Bias - Bearish
Technical Indicators: Pivot Points High anticipates a potential price reversal.
Super trend shows a clear sell, giving a perfect indicators' convergence.
Goal - 0.8670
About Used Indicators:
The pivot point itself is simply the average of the high, low and closing prices from the previous trading day.
Disclosure: I am part of Trade Nation's Influencer program and receive a monthly fee for using their TradingView charts in my analysis.
———————————
WISH YOU ALL LUCK

DOGEUSD Has reached it's (first?) targetAfter reaching the Centerline, price eitheradvances to the Upper Extreme (U-MLH), or it reverses and it's target is the L-MLH, the lower Extreme of the Fork.
An Open & Close below the Centerline would indicate further progress to the downside.
A stop above the last high with a target around 2 would be the trade I would take.
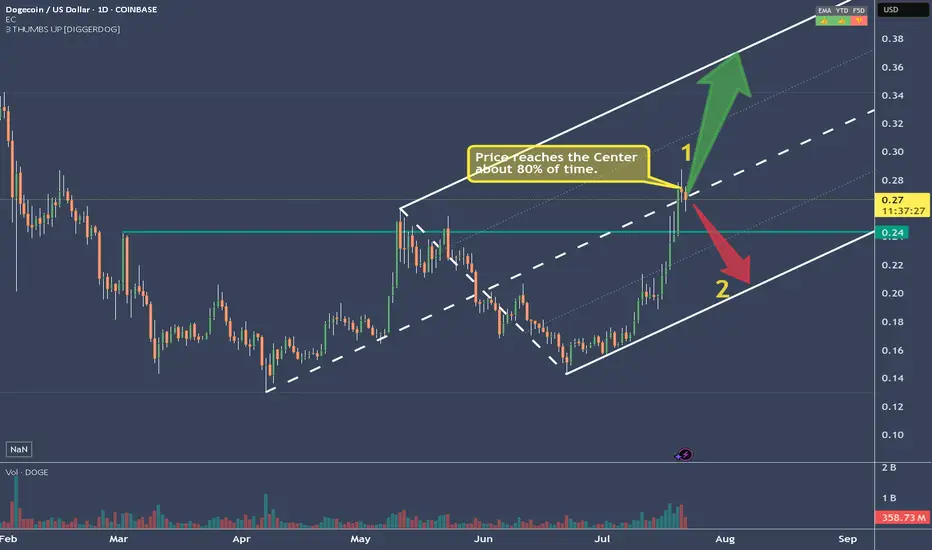
80% Of Time - A Trading Edge You Don't Want To MissDo you want to know why trading with median lines, also known as pitchforks, can be so successful? It’s simple:
Prices swing from one extreme back to the middle.
From the middle, they often swing to the other extreme.
What do we see on the chart?
- The upper extreme
- The center
- The lower extreme
So far, so good.
Now let’s follow the price and learn a few important rules that belong to the rulebook of median lines/pitchforks, and with which you can make great trades.
Point 1
The price starts and is sold off down to…
Point 2
...and from there starts to rise again, up to…
Point 3
...which is the center. And here we have a rule that is very important and one that you need to be aware of in trading to be successful:
THE PRICE RETURNS TO THE CENTER IN ABOUT 80% OF ALL CASES
If we know this, then we can stay in a trade with confidence.
Point 4
The price climbed even higher but missed the upper extreme.
This is the “Hagopian Rule” (named after the man who discovered it).
And the rule goes: If the price does not reach the next line (upper extreme, lower extreme, or center), then the price will continue moving in the opposite direction from where it originally came.
Phew...that’s a mouthful ;-)
But yes, we actually see that the price does exactly this.
From point 4, where the price missed the upper extreme, the price not only goes back to the center but continues and almost reaches the lower extreme!
Now if that isn’t cool, I don’t know what is!
And what do we have at point 5?
A "HAGOPIAN"!
What did we just learn?
The price should go higher than the center line.
Does it do that?
Oh yes!
But wait!
Not only does the Hagopian Rule apply. Remember?
"The price returns to the center line in about 80% of the cases."
HA!
Interesting or interesting?
So, that’s it.
That’s enough for now.
Now follow the price yourself and always consider which rule applies and whether it’s being followed.
How exactly do you trade all this, and what are the setups?
...one step at a time.
Don’t miss the next lesson and follow me here on TradingView.
Wishing you lots of success and fun!

ETHUSD - Decision TimeWhat do make of the current situation?
What if you are long?
Here's what to expect:
a) support at the U-MLH, further advancing up to the WL
b) open & close within the Fork. If so, there's a 95% Chance of price dumping down to the Centerline.
Taking 50% off the table is never bad.
50% money in the pocket if price falls down to the Centerline.
Or if it advances up to the WL, you still have 50% that generates profits.
Either way, you have a winner on your hands.
Don't let it dig into a Looser!

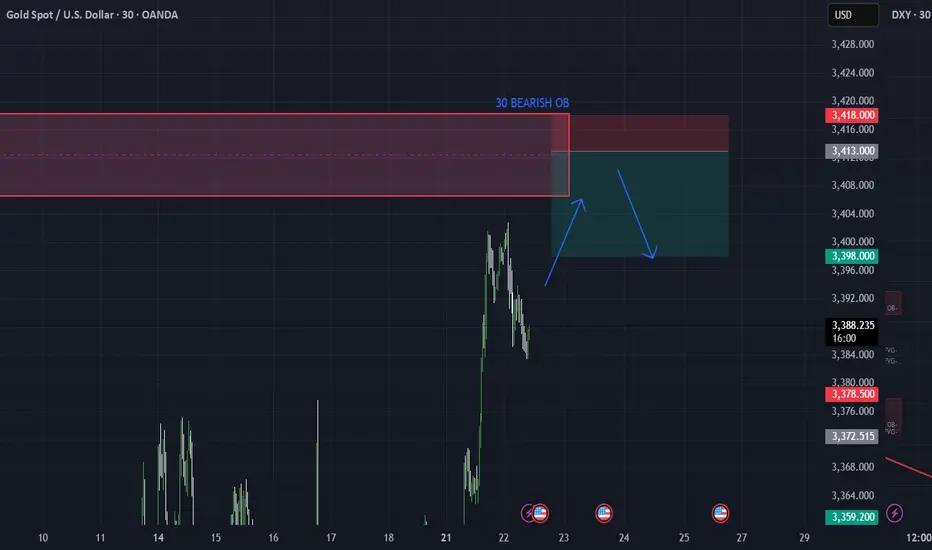
XAUUSD 30M – OB Sell Limit Setup for 3R Opportunity by PhoenixFXGold 30M Chart – Smart Money Sell Limit
We’re watching a clean Order Block (OB) on the 30-minute timeframe as price retraces into a key supply zone. This setup offers a high-probability reversal opportunity with a 3R risk-to-reward ratio. ✅
📍 ENTRY: 3413
🛑 SL: 3418 (above structure)
🎯 TP1: 3408 (1R)
🎯 TP2: 3403 (2R)
🎯 TP3: 3398 (3R)
The price action shows signs of exhaustion and premium pricing as it returns into a previous OB. We’re positioning with precision and tight risk.
📌 Strategy:
– 30M OB zone
– Clear BOS + retracement
– Set & forget execution
#XAUUSD #Gold #OrderBlock #SupplyZone #SmartMoney #PhoenixFX #RiskReward
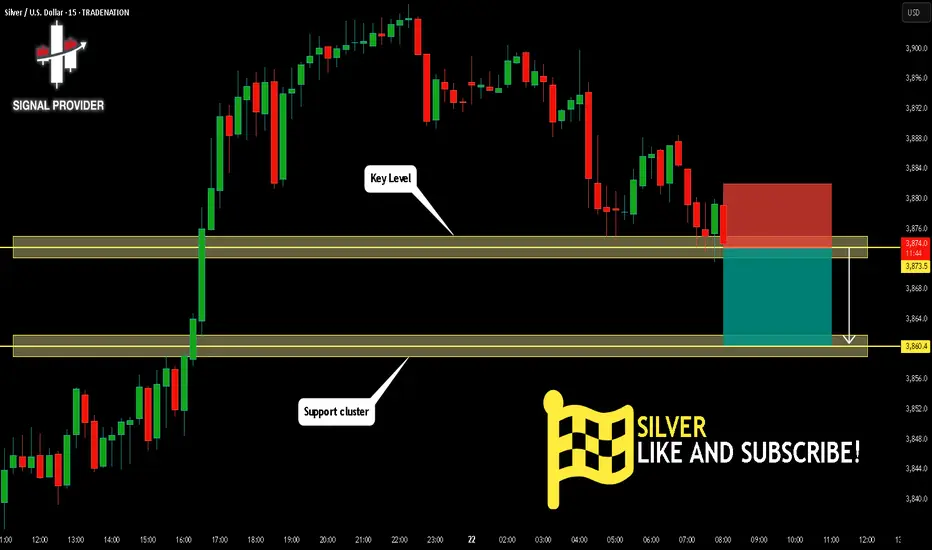
SILVER Is Going Down! Short!
Here is our detailed technical review for SILVER.
Time Frame: 15m
Current Trend: Bearish
Sentiment: Overbought (based on 7-period RSI)
Forecast: Bearish
The market is on a crucial zone of supply 3,873.5.
The above-mentioned technicals clearly indicate the dominance of sellers on the market. I recommend shorting the instrument, aiming at 3,860.4 level.
P.S
We determine oversold/overbought condition with RSI indicator.
When it drops below 30 - the market is considered to be oversold.
When it bounces above 70 - the market is considered to be overbought.
Disclosure: I am part of Trade Nation's Influencer program and receive a monthly fee for using their TradingView charts in my analysis.
Like and subscribe and comment my ideas if you enjoy them!
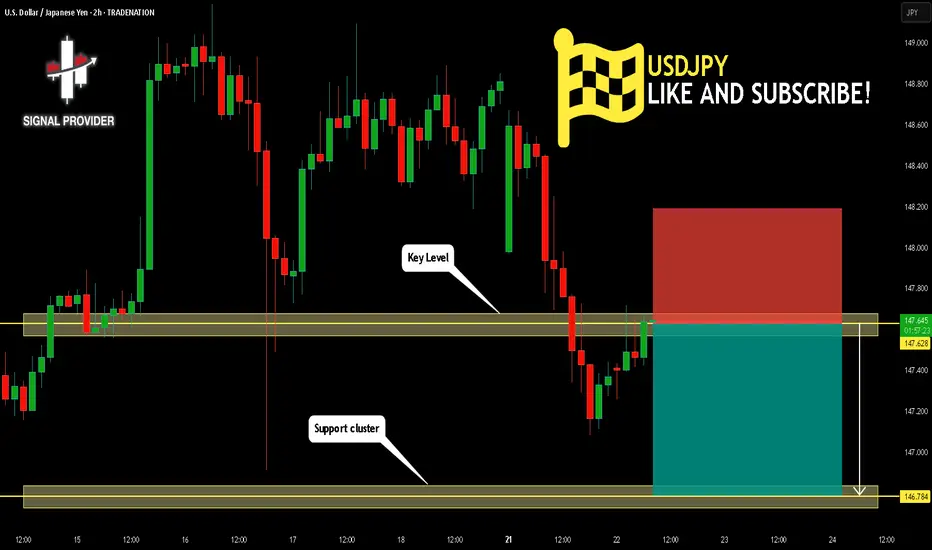
USDJPY Will Fall! Sell!
Take a look at our analysis for USDJPY.
Time Frame: 2h
Current Trend: Bearish
Sentiment: Overbought (based on 7-period RSI)
Forecast: Bearish
The price is testing a key resistance 147.628.
Taking into consideration the current market trend & overbought RSI, chances will be high to see a bearish movement to the downside at least to 146.784 level.
P.S
Overbought describes a period of time where there has been a significant and consistent upward move in price over a period of time without much pullback.
Disclosure: I am part of Trade Nation's Influencer program and receive a monthly fee for using their TradingView charts in my analysis.
Like and subscribe and comment my ideas if you enjoy them!
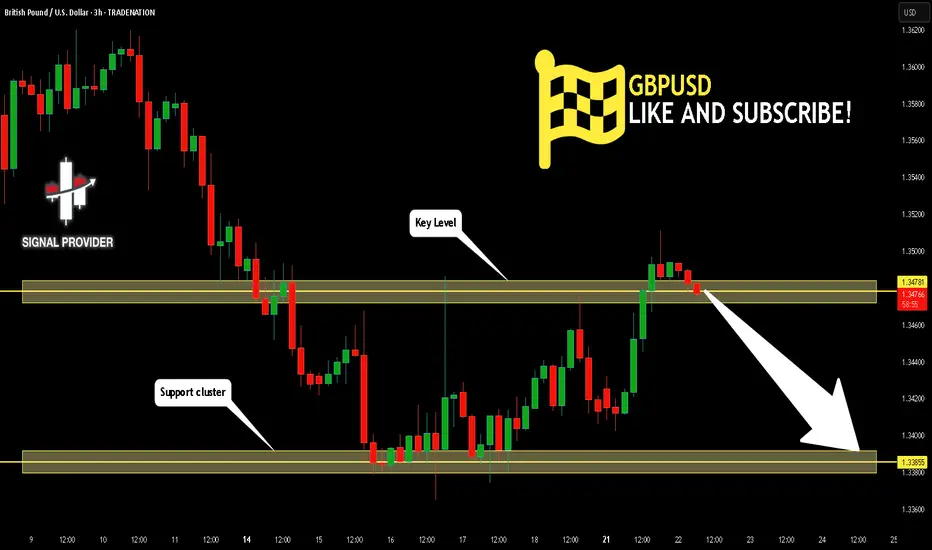
GBPUSD Will Go Down From Resistance! Short!
Here is our detailed technical review for GBPUSD.
Time Frame: 3h
Current Trend: Bearish
Sentiment: Overbought (based on 7-period RSI)
Forecast: Bearish
The market is testing a major horizontal structure 1.347.
Taking into consideration the structure & trend analysis, I believe that the market will reach 1.338 level soon.
P.S
The term oversold refers to a condition where an asset has traded lower in price and has the potential for a price bounce.
Overbought refers to market scenarios where the instrument is traded considerably higher than its fair value. Overvaluation is caused by market sentiments when there is positive news.
Disclosure: I am part of Trade Nation's Influencer program and receive a monthly fee for using their TradingView charts in my analysis.
Like and subscribe and comment my ideas if you enjoy them!
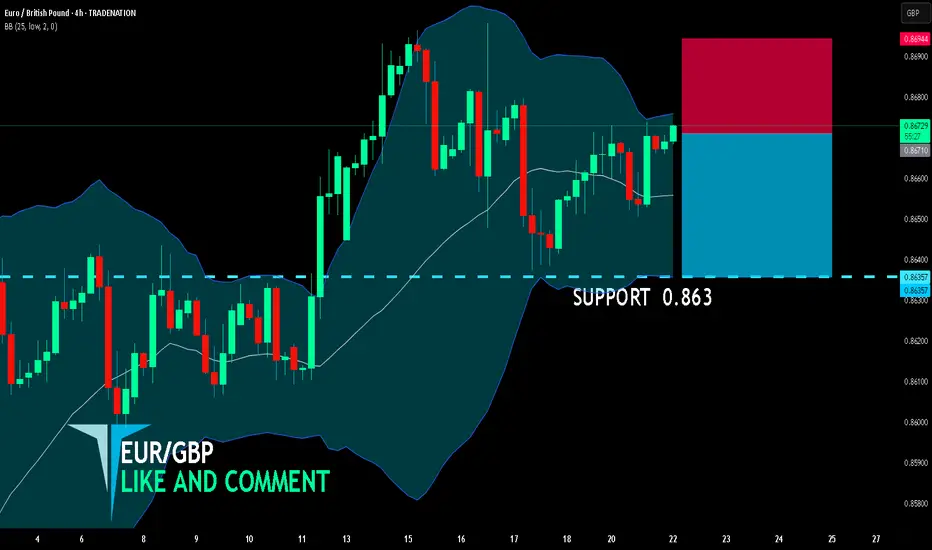
EUR/GBP SHORT FROM RESISTANCE
EUR/GBP SIGNAL
Trade Direction: short
Entry Level: 0.867
Target Level: 0.863
Stop Loss: 0.869
RISK PROFILE
Risk level: medium
Suggested risk: 1%
Timeframe: 4h
Disclosure: I am part of Trade Nation's Influencer program and receive a monthly fee for using their TradingView charts in my analysis.
✅LIKE AND COMMENT MY IDEAS✅
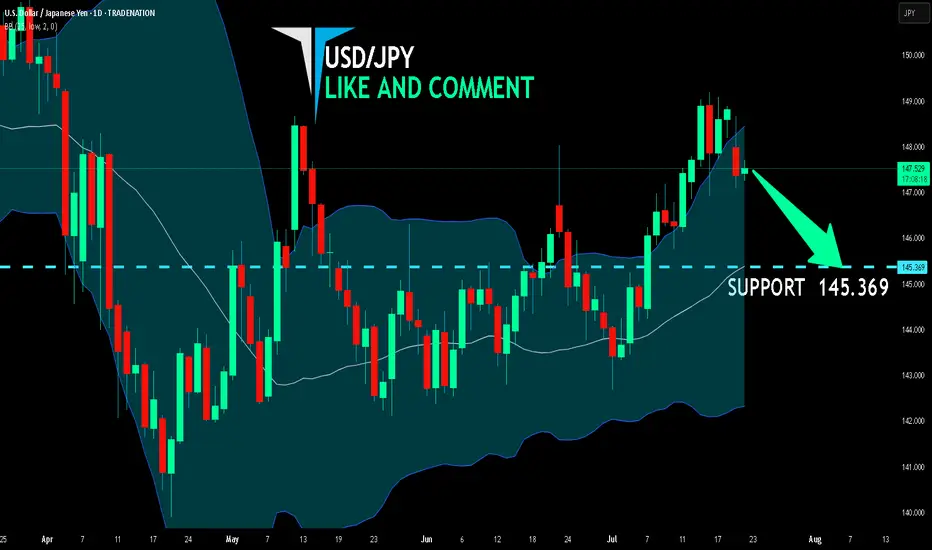
USD/JPY SENDS CLEAR BEARISH SIGNALS|SHORT
Hello, Friends!
USD/JPY pair is trading in a local uptrend which we know by looking at the previous 1W candle which is green. On the 1D timeframe the pair is going up too. The pair is overbought because the price is close to the upper band of the BB indicator. So we are looking to sell the pair with the upper BB line acting as resistance. The next target is 145.369 area.
Disclosure: I am part of Trade Nation's Influencer program and receive a monthly fee for using their TradingView charts in my analysis.
✅LIKE AND COMMENT MY IDEAS✅
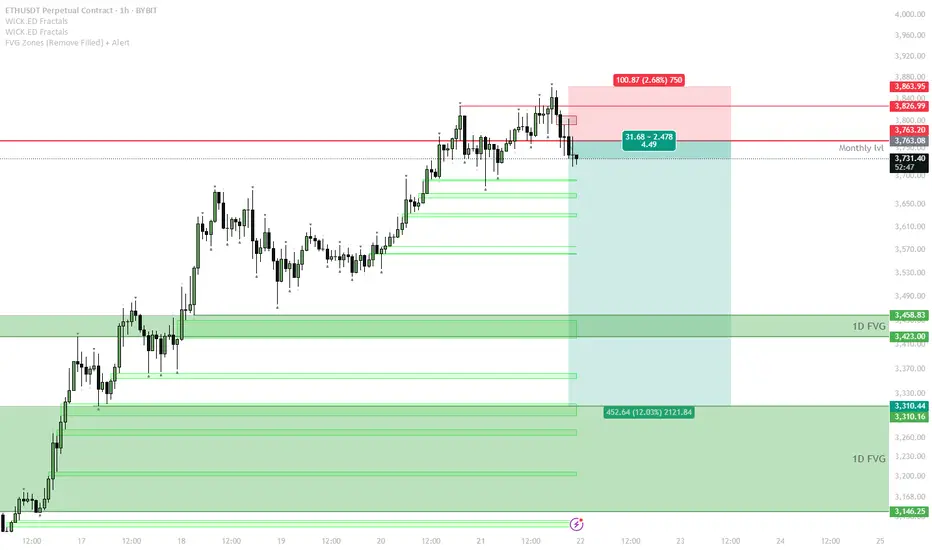
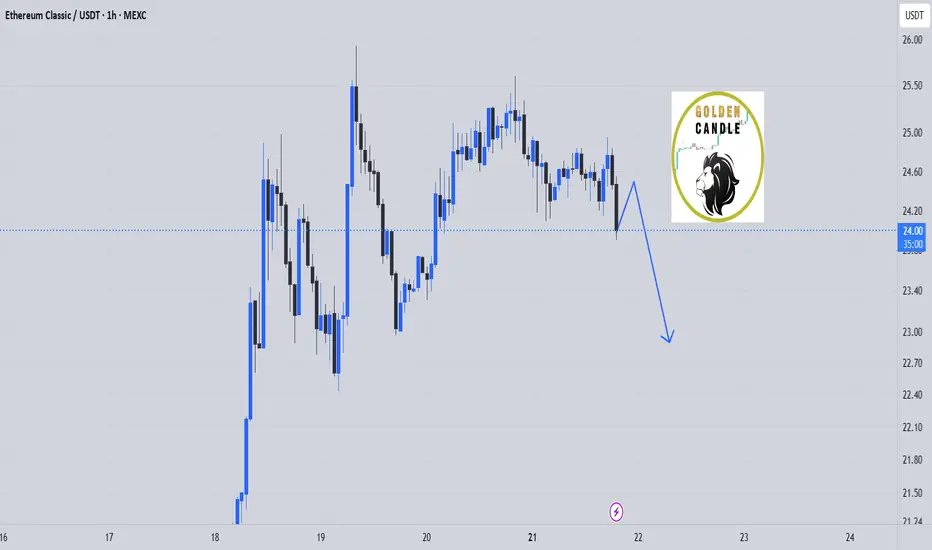
ETH Short Setup — Waiting for Range Formation After Parabolic Mo
The parabolic uptrend has broken, and ETH is testing the previous monthly resistance at $3,763.
If price fails to reclaim the monthly level and continues to range below it, expect a sideways range to form between $3,760–$3,850 (red box) and local support zones.
The short trigger is a sweep of the range high (top of the red box) followed by rejection or failure to hold above $3,850.
If price confirms a failed sweep, a short position can target the 1D FVG zone around $3,460, with the next possible target at $3,310.
Invalidation: A strong reclaim and acceptance above $3,850 invalidates the short idea — switch to neutral or bullish bias in that case.
The setup follows a classic pattern after a parabolic run: momentum stalls, a range forms, and liquidity is swept at the range top before a correction. Sellers are likely to step in if price fails to establish new highs above the red zone. Downside targets align with major FVGs and previous breakout areas, providing logical levels for profit-taking.
etc sell shortterm"🌟 Welcome to Golden Candle! 🌟
We're a team of 📈 passionate traders 📉 who love sharing our 🔍 technical analysis insights 🔎 with the TradingView community. 🌎
Our goal is to provide 💡 valuable perspectives 💡 on market trends and patterns, but 🚫 please note that our analyses are not intended as buy or sell recommendations. 🚫
Instead, they reflect our own 💭 personal attitudes and thoughts. 💭
Follow along and 📚 learn 📚 from our analyses! 📊💡"
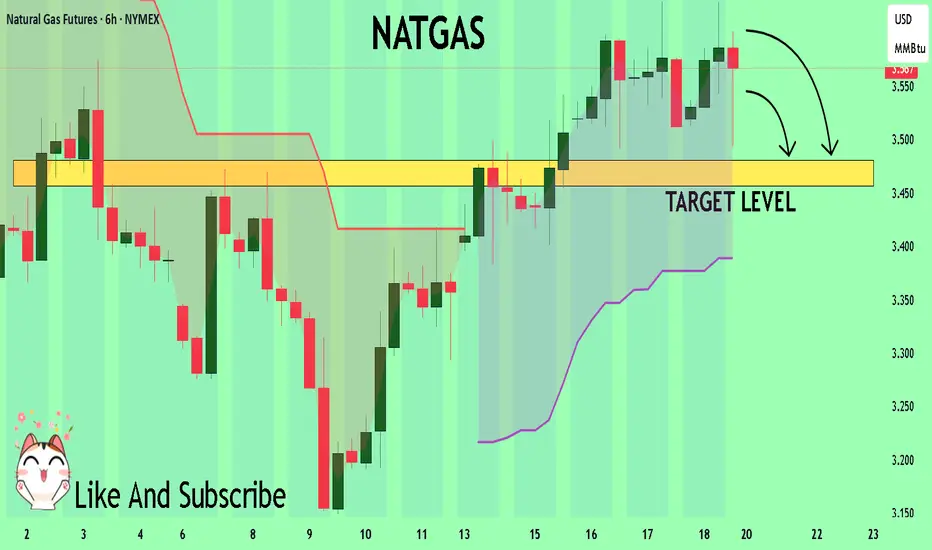
NATGAS Trading Opportunity! SELL!
My dear followers,
This is my opinion on the NATGAS next move:
The asset is approaching an important pivot point 3.567
Bias - Bearish
Technical Indicators: Supper Trend generates a clear short signal while Pivot Point HL is currently determining the overall Bearish trend of the market.
Goal - 3.480
About Used Indicators:
For more efficient signals, super-trend is used in combination with other indicators like Pivot Points.
Disclosure: I am part of Trade Nation's Influencer program and receive a monthly fee for using their TradingView charts in my analysis.
———————————
WISH YOU ALL LUCK
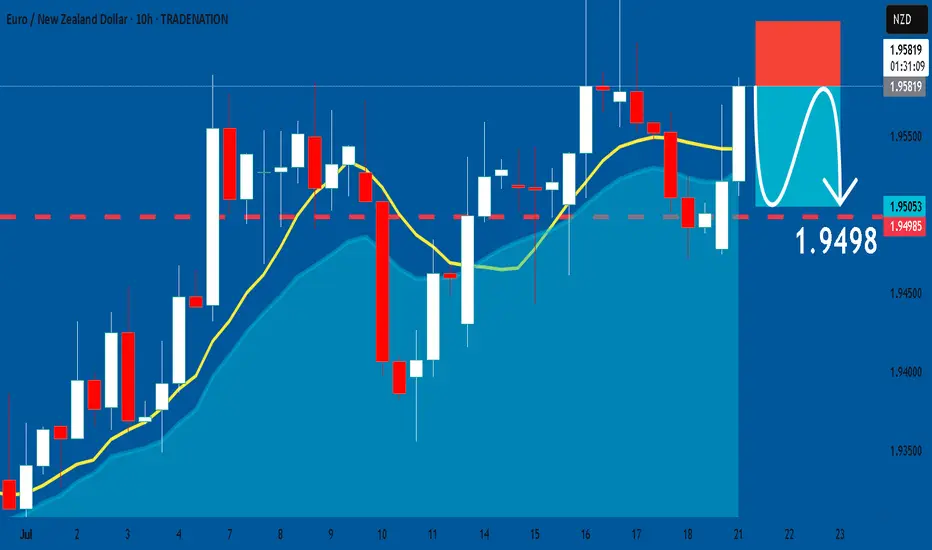
EURNZD: Short Signal with Entry/SL/TP
EURNZD
- Classic bearish formation
- Our team expects pullback
SUGGESTED TRADE:
Swing Trade
Short EURNZD
Entry - 1.9581
Sl - 1.9622
Tp - 1.9498
Our Risk - 1%
Start protection of your profits from lower levels
Disclosure: I am part of Trade Nation's Influencer program and receive a monthly fee for using their TradingView charts in my analysis.
❤️ Please, support our work with like & comment! ❤️
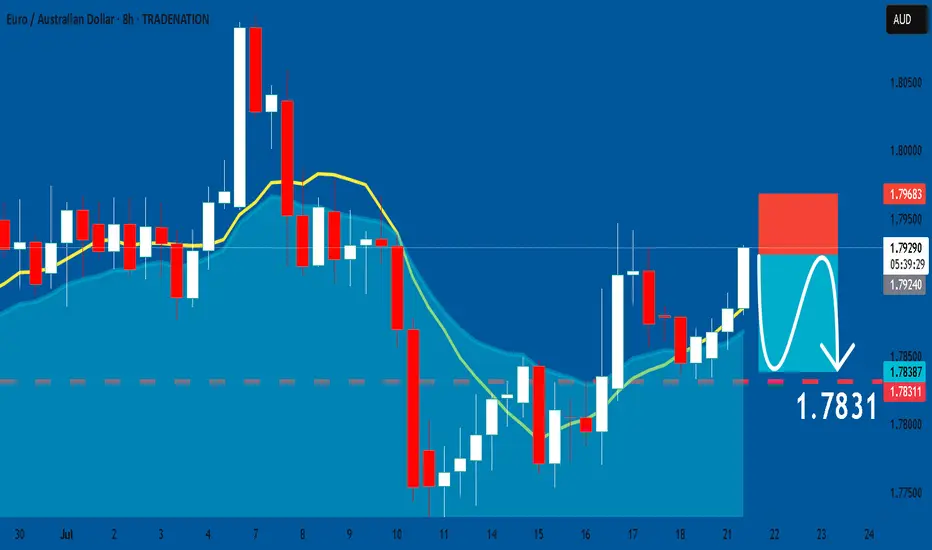
EURAUD: Short Signal Explained
EURAUD
- Classic bearish pattern
- Our team expects retracement
SUGGESTED TRADE:
Swing Trade
Sell EURAUD
Entry - 1.7924
Stop - 1.7968
Take - 1.7831
Our Risk - 1%
Start protection of your profits from lower levels
Disclosure: I am part of Trade Nation's Influencer program and receive a monthly fee for using their TradingView charts in my analysis.
❤️ Please, support our work with like & comment! ❤️
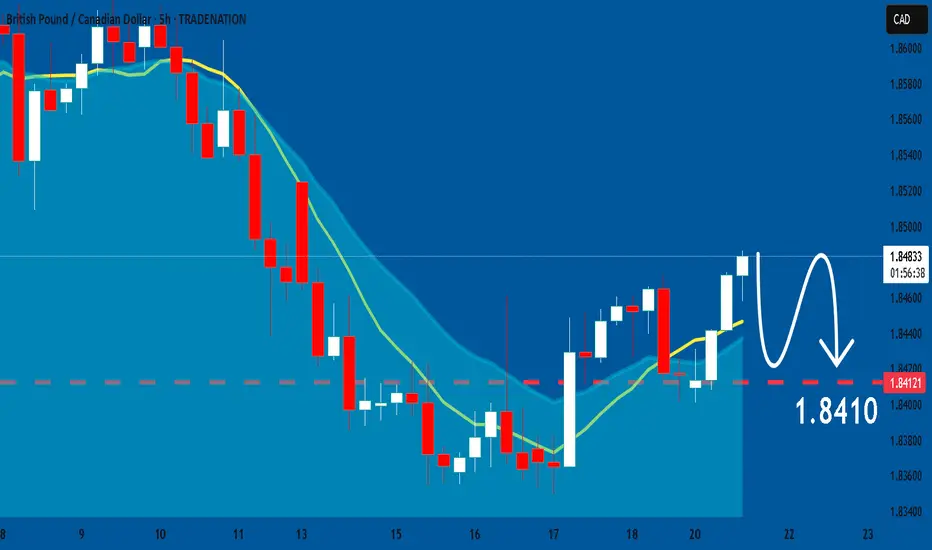
GBPCAD: Will Start Falling! Here is Why:
Remember that we can not, and should not impose our will on the market but rather listen to its whims and make profit by following it. And thus shall be done today on the GBPCAD pair which is likely to be pushed down by the bears so we will sell!
Disclosure: I am part of Trade Nation's Influencer program and receive a monthly fee for using their TradingView charts in my analysis.
❤️ Please, support our work with like & comment! ❤️