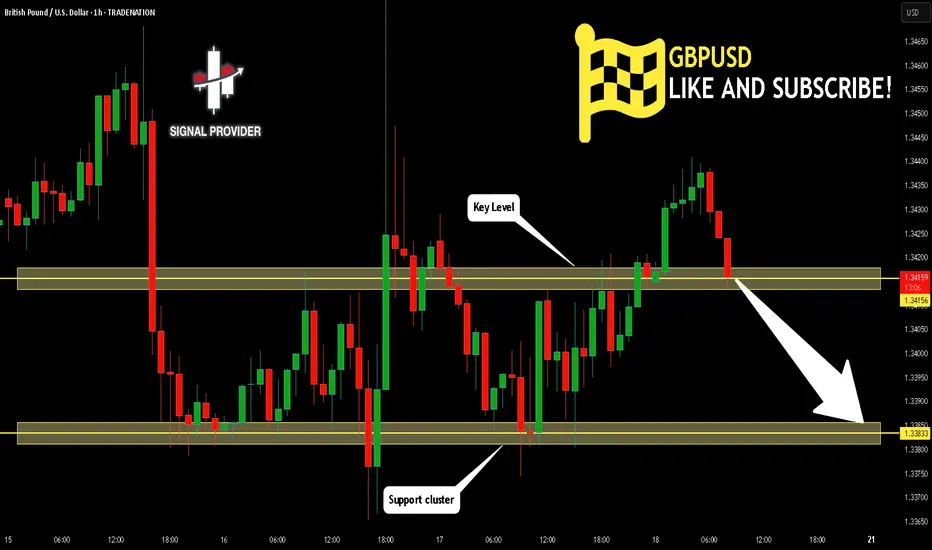
GBPUSD Is Bearish! Short!
Take a look at our analysis for GBPUSD.
Time Frame: 1h
Current Trend: Bearish
Sentiment: Overbought (based on 7-period RSI)
Forecast: Bearish
The market is testing a major horizontal structure 1.341.
Taking into consideration the structure & trend analysis, I believe that the market will reach 1.338 level soon.
P.S
We determine oversold/overbought condition with RSI indicator.
When it drops below 30 - the market is considered to be oversold.
When it bounces above 70 - the market is considered to be overbought.
Disclosure: I am part of Trade Nation's Influencer program and receive a monthly fee for using their TradingView charts in my analysis.
Like and subscribe and comment my ideas if you enjoy them!
Short
EURUSD Will Go Lower! Sell!
Here is our detailed technical review for EURUSD.
Time Frame: 4h
Current Trend: Bearish
Sentiment: Overbought (based on 7-period RSI)
Forecast: Bearish
The market is approaching a significant resistance area 1.168.
Due to the fact that we see a positive bearish reaction from the underlined area, I strongly believe that sellers will manage to push the price all the way down to 1.159 level.
P.S
Please, note that an oversold/overbought condition can last for a long time, and therefore being oversold/overbought doesn't mean a price rally will come soon, or at all.
Disclosure: I am part of Trade Nation's Influencer program and receive a monthly fee for using their TradingView charts in my analysis.
Like and subscribe and comment my ideas if you enjoy them!

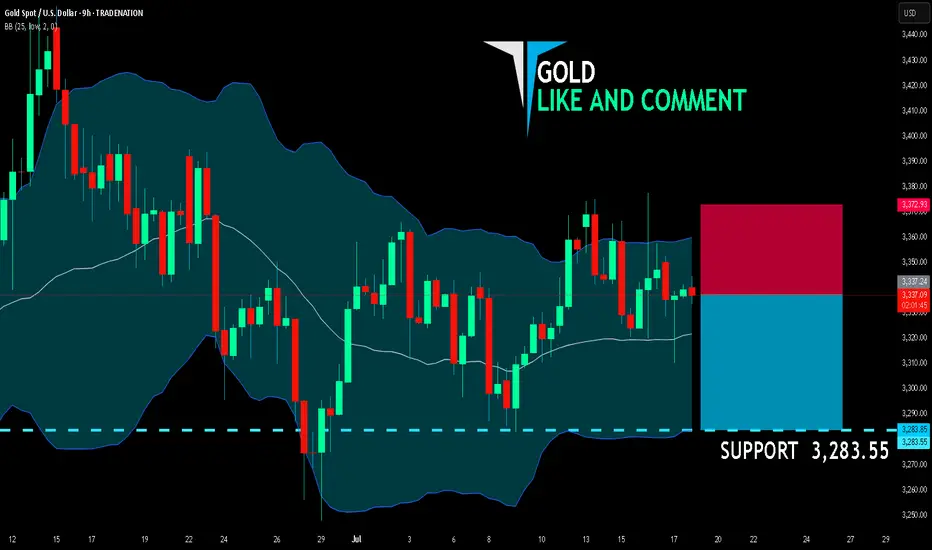
GOLD SELLERS WILL DOMINATE THE MARKET|SHORT
GOLD SIGNAL
Trade Direction: short
Entry Level: 3,337.24
Target Level: 3,283.55
Stop Loss: 3,372.93
RISK PROFILE
Risk level: medium
Suggested risk: 1%
Timeframe: 9h
Disclosure: I am part of Trade Nation's Influencer program and receive a monthly fee for using their TradingView charts in my analysis.
✅LIKE AND COMMENT MY IDEAS✅
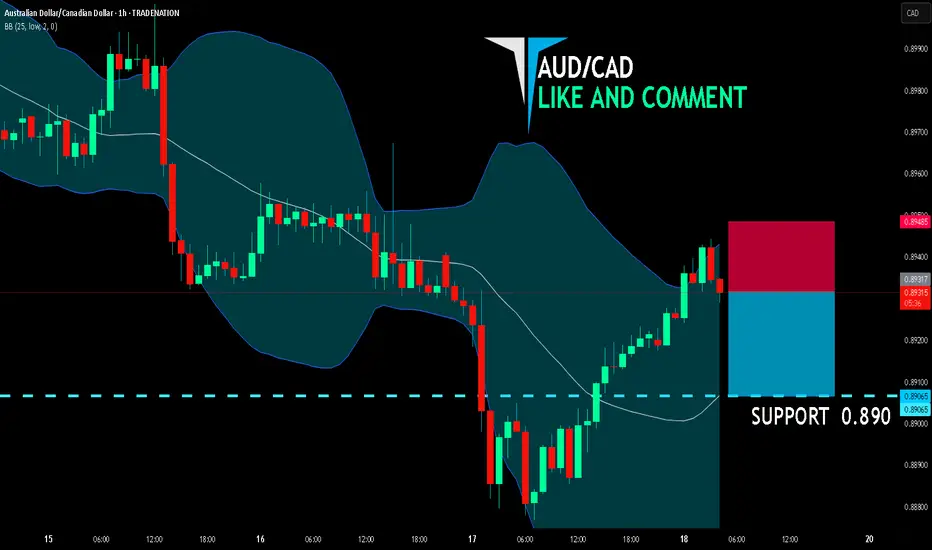
AUD/CAD BEARISH BIAS RIGHT NOW| SHORT
AUD/CAD SIGNAL
Trade Direction: short
Entry Level: 0.893
Target Level: 0.890
Stop Loss: 0.894
RISK PROFILE
Risk level: medium
Suggested risk: 1%
Timeframe: 1h
Disclosure: I am part of Trade Nation's Influencer program and receive a monthly fee for using their TradingView charts in my analysis.
✅LIKE AND COMMENT MY IDEAS✅
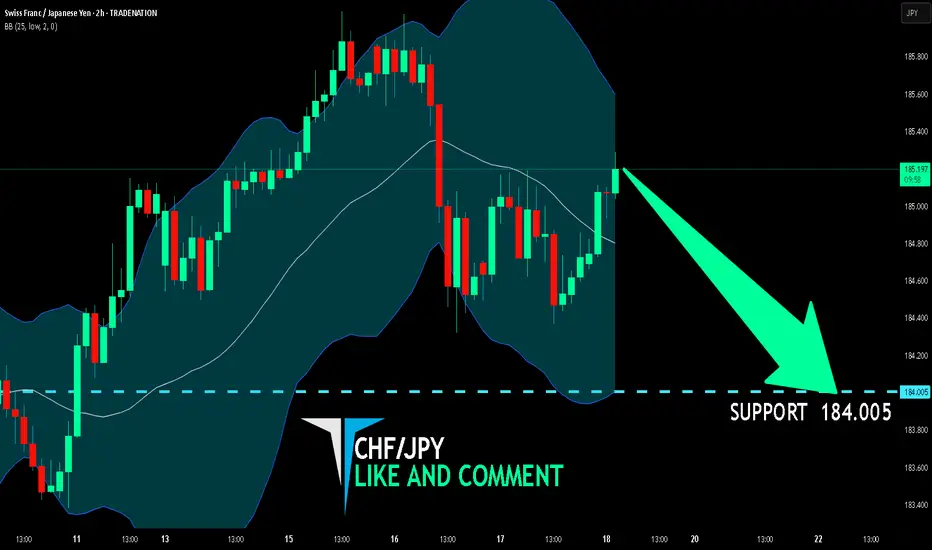
CHF/JPY BEST PLACE TO SELL FROM|SHORT
Hello, Friends!
CHF/JPY pair is in the uptrend because previous week’s candle is green, while the price is evidently rising on the 2H timeframe. And after the retest of the resistance line above I believe we will see a move down towards the target below at 184.005 because the pair overbought due to its proximity to the upper BB band and a bearish correction is likely.
Disclosure: I am part of Trade Nation's Influencer program and receive a monthly fee for using their TradingView charts in my analysis.
✅LIKE AND COMMENT MY IDEAS✅
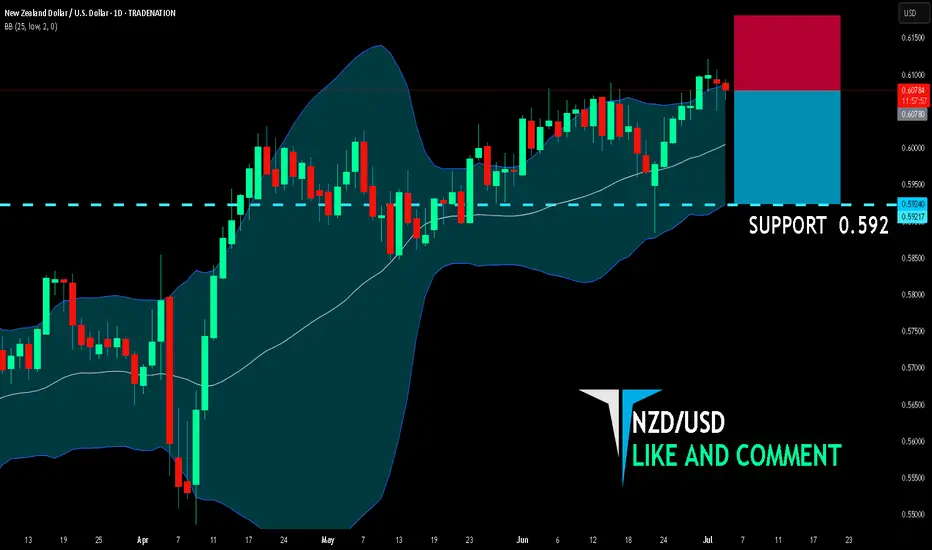
NZD/USD SELLERS WILL DOMINATE THE MARKET|SHORT
NZD/USD SIGNAL
Trade Direction: short
Entry Level: 0.607
Target Level: 0.592
Stop Loss: 0.617
RISK PROFILE
Risk level: medium
Suggested risk: 1%
Timeframe: 1D
Disclosure: I am part of Trade Nation's Influencer program and receive a monthly fee for using their TradingView charts in my analysis.
✅LIKE AND COMMENT MY IDEAS✅
AUD/CHF BEST PLACE TO SELL FROM|SHORT
AUD/CHF SIGNAL
Trade Direction: short
Entry Level: 0.524
Target Level: 0.520
Stop Loss: 0.526
RISK PROFILE
Risk level: medium
Suggested risk: 1%
Timeframe: 3h
Disclosure: I am part of Trade Nation's Influencer program and receive a monthly fee for using their TradingView charts in my analysis.
✅LIKE AND COMMENT MY IDEAS✅

ETHUSD - Stretched price. Pullback to CL likelyPrice tagged the U-MLH, the stretch level.
Think of it like the 2nd STDV.
Now think Mean Reversion.
With such a stretch, price has a high chance to revert to the mean - down to the Centerline (CL).
What is this information good for?
a) take profit (...or 50% partial)
b) short on intrady signs
But if it is open and close above the U-MLH, then there's a good chance that price is advancing to the Warning Line, the extension of the Center to U-MLH.
Let's observe what happens.

BTCUSD - Exhausted? Second time rejected, now down.BTCUSD got rejected at the Centerline the second time. This is super bearish. If it's closing below yesterdays low, that's a clear short signal to me.
Taking 50% gains off the table is never bad. Because then you still have 50% if it's going up further. Otherwise, you got 50% booked.
Don't let gree eat your brain §8-)

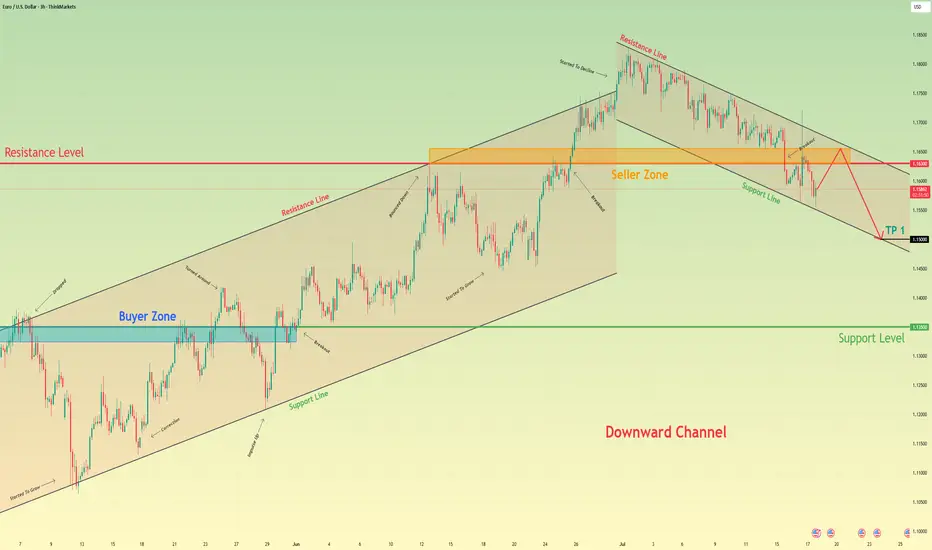
Euro may reach seller zone and then continue to fall in channelHello traders, I want share with you my opinion about Euro. The price pair has recently shifted its market structure, establishing a clear downward channel after breaking its previous uptrend. Before this breakdown, the price was consistently trading within an Upward Channel, repeatedly finding support in the buyer zone (1.1325–1.1350) and reversing upward. The bullish momentum eventually faded when the price failed to break the major horizontal resistance level at 1.1630. This failure triggered a strong bearish impulse, leading to a decisive breakout below the channel's support line and confirming a trend reversal. Currently, the price is making a corrective move up inside the newly formed downward channel, which appears to be a classic retest of the broken structure from below. I expect this upward move to stall as it approaches the heavy confluence of resistance formed by the channel's upper Resistance Line and the horizontal seller zone at 1.1630–1.1655. After testing this area, I anticipate a rejection and the beginning of a new bearish leg down. That's why I've set my TP at the 1.1500 level — it aligns perfectly with the support line of the current downward channel, making it a logical target for sellers. Please share this idea with your friends and click Boost 🚀
Disclaimer: As part of ThinkMarkets’ Influencer Program, I am sponsored to share and publish their charts in my analysis.
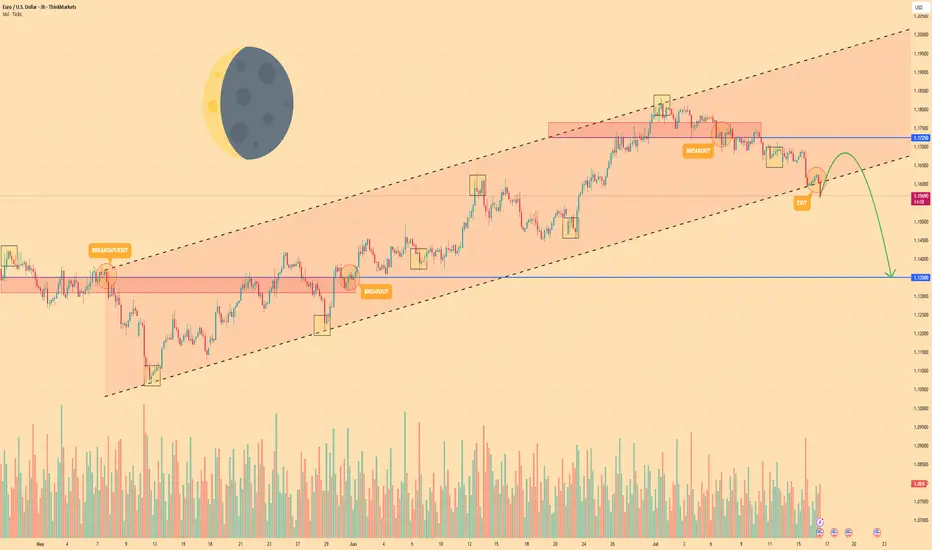
EURO - Price may drop to $1.1350 support level Hi guys, this is my overview for EURUSD, feel free to check it and write your feedback in comments👊
Euro began its journey by breaking into a rising channel off the swing low near $1.1080, establishing a clear uptrend.
Within this channel, price carved out steady support along the lower trendline, touching $1.1350 before buyers stepped.
Mid-channel, two breakout attempts at $1.1550 and $1.1725 highlighted bullish conviction, yet both retreated back below resistance.
Simultaneously, two exit signals appeared near the upper trendline around $1.1765, showing that upward momentum was losing steam at key inflection points.
Currently, EUR is holding just below the channel base after a minor bounce, consolidating as traders weigh the next move.
I foresee a brief climb toward near $1.1670 before a renewed bearish thrust drives price back down to test $1.1350 level.
If this post is useful to you, you can support me with like/boost and advice in comments❤️
Disclaimer: As part of ThinkMarkets’ Influencer Program, I am sponsored to share and publish their charts in my analysis.
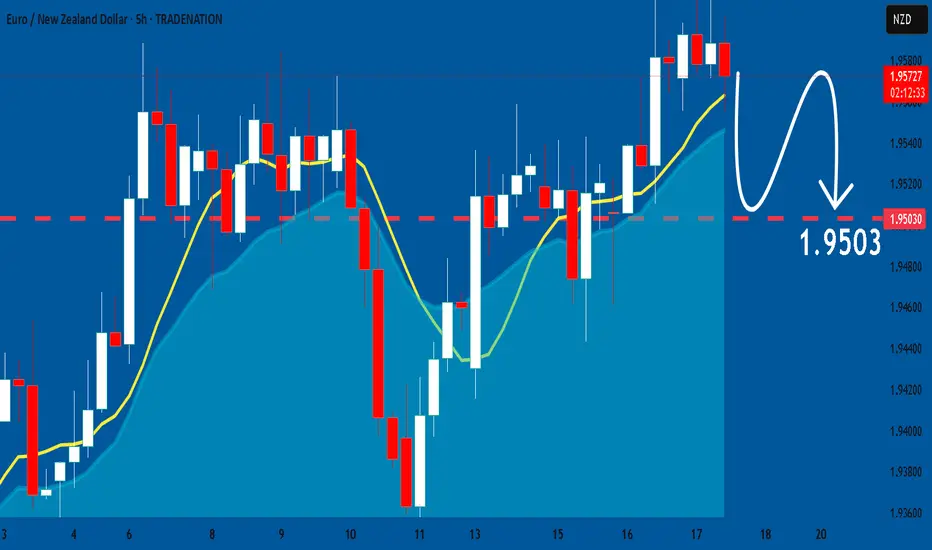
EURNZD: Bearish Forecast & Bearish Scenario
The analysis of the EURNZD chart clearly shows us that the pair is finally about to tank due to the rising pressure from the sellers.
Disclosure: I am part of Trade Nation's Influencer program and receive a monthly fee for using their TradingView charts in my analysis.
❤️ Please, support our work with like & comment! ❤️
Fartcoin - Rangebound repeat? A BTC makes new highs attention has turned towards altcoins to play catch up.
FARTCOIN has been a top performer of the last month and currently on the 1D timeframe finds itself in a rangebound environment capped between $1.1923 - $1.3945. The end of last week price trended down in a bearish channel from top to bottom and it looks to be doing the same currently. As the supply zone above the range high got swept, price printed a SFP getting back inside the range and began trending down, for me there are two actionable long entries here:
- A range low bounce + breakout of trend channel would be an ideal long entry. An area of clear support coupled with a breakout is a historically strong setup with a clear invalidation if price breaks below the range and gets accepted.
- A more aggressive but potentially less ideal setup would be a breakout of the downtrend before hitting range lows. Higher risk as the level of support is not as defined but in the more risk-on environment crypto is currently in, the chance of major support levels being front run does go up as buyers become more impatient when FOMO grows.
The midpoint is key level to look out for too as a reclaim would mean a run at the highs, rejection opens the door to retest the lows.

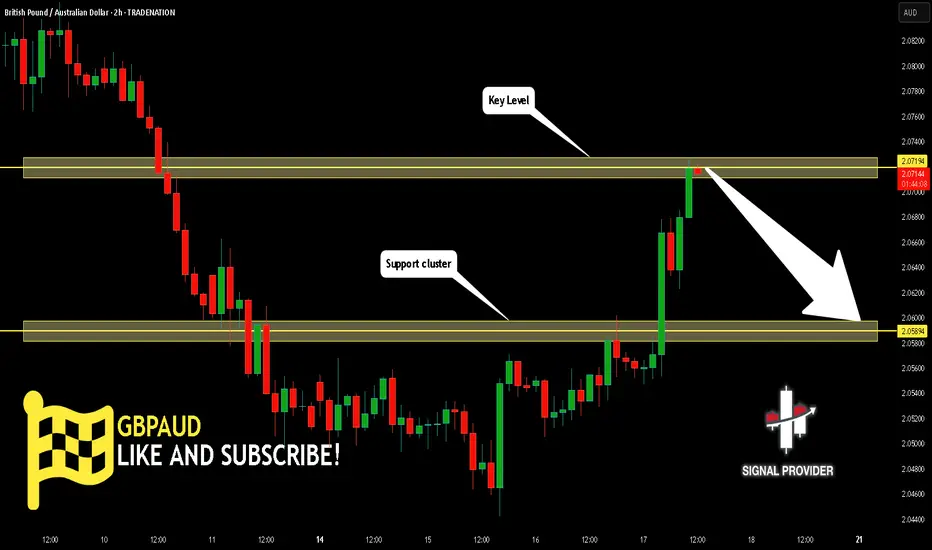
GBPAUD Will Go Lower From Resistance! Sell!
Please, check our technical outlook for GBPAUD.
Time Frame: 2h
Current Trend: Bearish
Sentiment: Overbought (based on 7-period RSI)
Forecast: Bearish
The price is testing a key resistance 2.071.
Taking into consideration the current market trend & overbought RSI, chances will be high to see a bearish movement to the downside at least to 2.058 level.
P.S
We determine oversold/overbought condition with RSI indicator.
When it drops below 30 - the market is considered to be oversold.
When it bounces above 70 - the market is considered to be overbought.
Disclosure: I am part of Trade Nation's Influencer program and receive a monthly fee for using their TradingView charts in my analysis.
Like and subscribe and comment my ideas if you enjoy them!
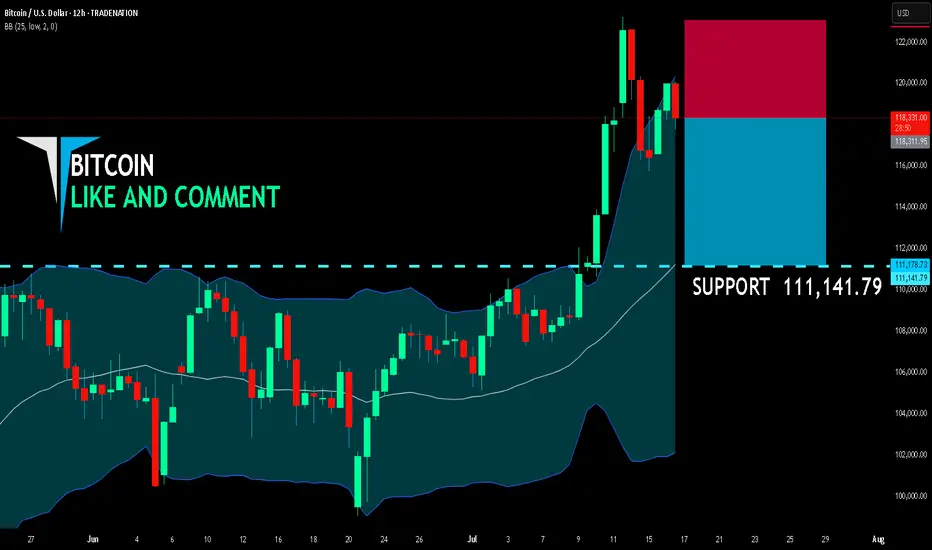
BITCOIN SHORT FROM RESISTANCE
BITCOIN SIGNAL
Trade Direction: short
Entry Level: 118,311.95
Target Level: 111,141.79
Stop Loss: 123,054.98
RISK PROFILE
Risk level: medium
Suggested risk: 1%
Timeframe: 12h
Disclosure: I am part of Trade Nation's Influencer program and receive a monthly fee for using their TradingView charts in my analysis.
✅LIKE AND COMMENT MY IDEAS✅
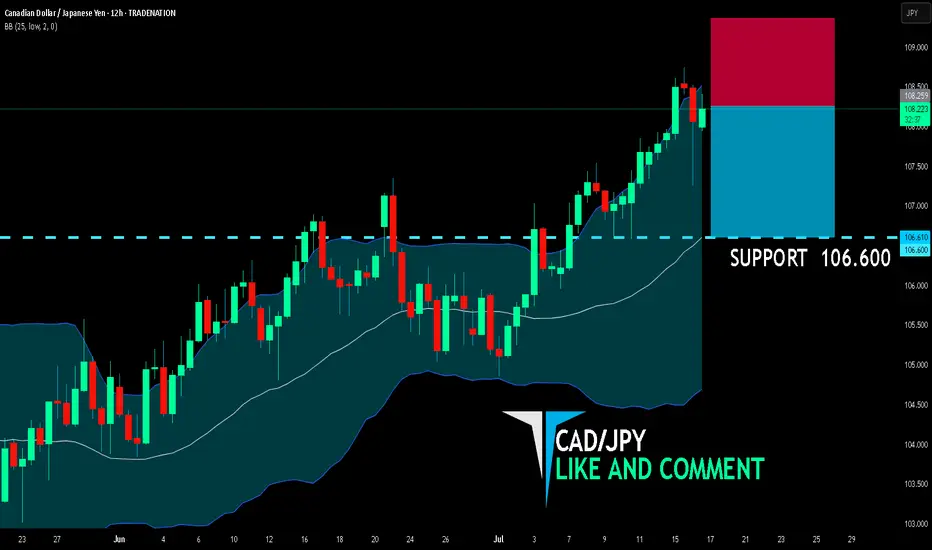
CAD/JPY BEARS WILL DOMINATE THE MARKET|SHORT
CAD/JPY SIGNAL
Trade Direction: short
Entry Level: 108.259
Target Level: 106.600
Stop Loss: 109.355
RISK PROFILE
Risk level: medium
Suggested risk: 1%
Timeframe: 12h
Disclosure: I am part of Trade Nation's Influencer program and receive a monthly fee for using their TradingView charts in my analysis.
✅LIKE AND COMMENT MY IDEAS✅
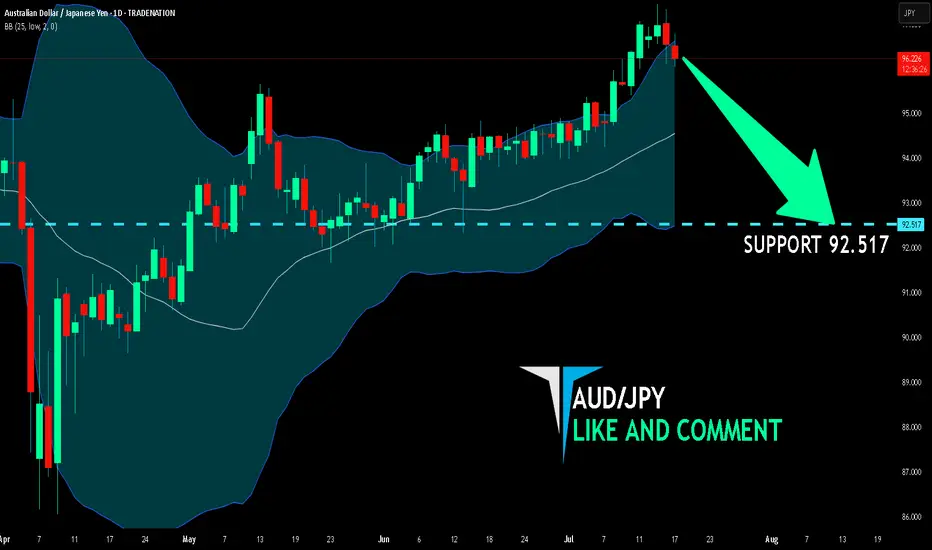
AUD/JPY SENDS CLEAR BEARISH SIGNALS|SHORT
Hello, Friends!
We are going short on the AUD/JPY with the target of 92.517 level, because the pair is overbought and will soon hit the resistance line above. We deduced the overbought condition from the price being near to the upper BB band. However, we should use low risk here because the 1W TF is green and gives us a counter-signal.
Disclosure: I am part of Trade Nation's Influencer program and receive a monthly fee for using their TradingView charts in my analysis.
✅LIKE AND COMMENT MY IDEAS✅
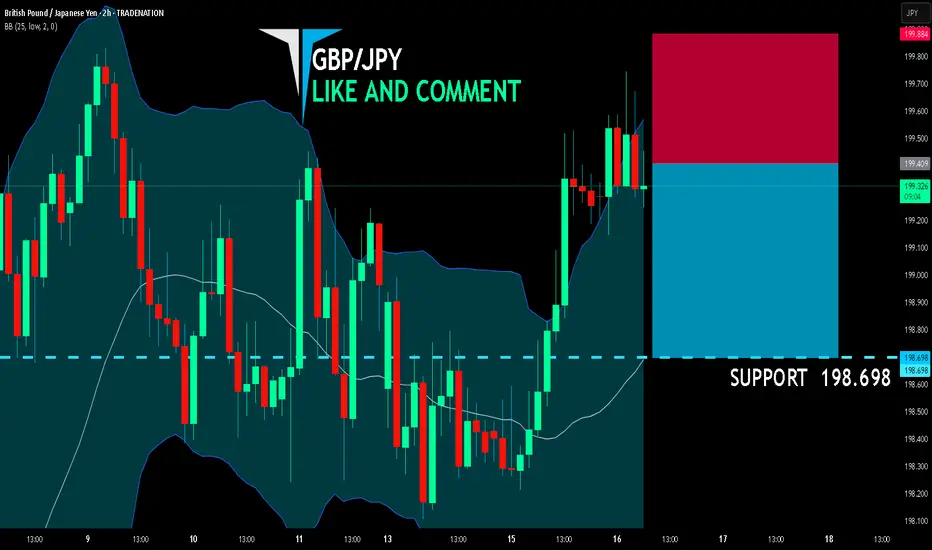
GBP/JPY BEARISH BIAS RIGHT NOW| SHORT
GBP/JPY SIGNAL
Trade Direction: short
Entry Level: 199.409
Target Level: 198.698
Stop Loss: 199.884
RISK PROFILE
Risk level: medium
Suggested risk: 1%
Timeframe: 2h
Disclosure: I am part of Trade Nation's Influencer program and receive a monthly fee for using their TradingView charts in my analysis.
✅LIKE AND COMMENT MY IDEAS✅
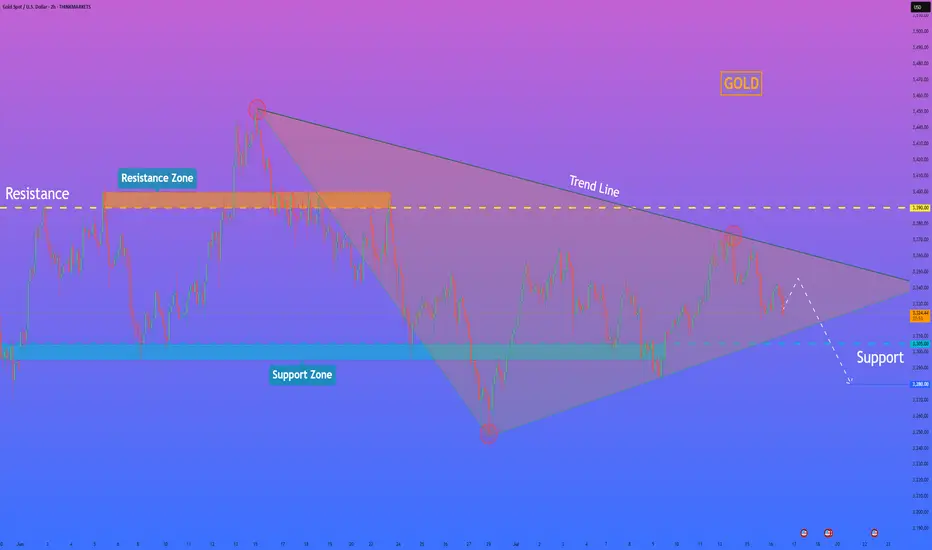
GOLD - Price can start to decline and break support levelHi guys, this is my overview for EURUSD, feel free to check it and write your feedback in comments👊
Gold initially traded inside a steady falling channel, carving lower highs at $3390 and lower lows around $3285 as bears held sway.
A brief fake breakout at $3365 briefly flipped sentiment, but sellers quickly reasserted control and pushed price back toward the channel floor.
Buyers then absorbed selling at the $3285 support area, sparking a rebound into a rising wedge pattern marked by converging trendlines.
Within this wedge, three minor breakouts failed to trigger sustained rallies, underscoring persistent resistance near the upper boundary.
I anticipate Gold to roll over from the wedge’s ceiling and break below $3365, targeting the wedge’s lower support line at $3310
If this post is useful to you, you can support me with like/boost and advice in comments❤️
Disclaimer: As part of ThinkMarkets’ Influencer Program, I am sponsored to share and publish their charts in my analysis.
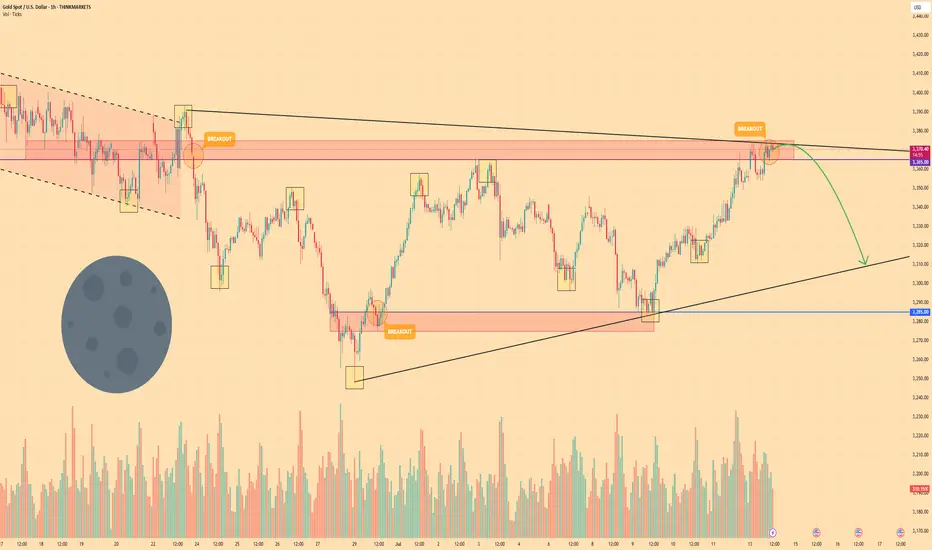
HelenP I. Gold will continue to decline and break support levelHi folks today I'm prepared for you Gold analytics. After a prolonged period of consolidation, we can observe how price has formed a symmetrical pennant pattern. Price respected both the descending and ascending trend lines, bouncing several times from each side. Recently, gold tested the upper boundary of the pennant near the 3390 resistance level but failed to break through, confirming the strength of the resistance zone between 3390 and 3400 points. Following this rejection, the price started to decline and is now approaching the support level around 3305. If this support doesn’t hold, the price may drop further and break out of the pennant downward. In that case, the nearest significant target lies at 3280 points — near the lower trend line and previous reaction zones. Given the current structure, repeated rejection from resistance, and narrowing volatility inside the pattern, I expect XAUUSD to exit from the pennant and move down, breaking the support zone. That’s why I remain short-term bearish and set my goal at 3280 points. If you like my analytics you may support me with your like/comment.❤️
Disclaimer: As part of ThinkMarkets’ Influencer Program, I am sponsored to share and publish their charts in my analysis.
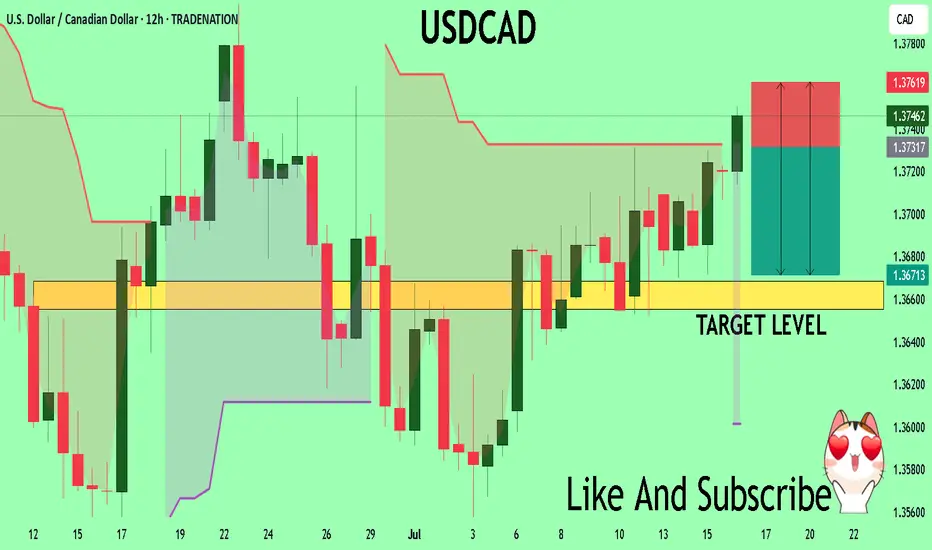
USDCAD Massive Short! SELL!
My dear subscribers,
This is my opinion on the USDCAD next move:
The instrument tests an important psychological level 1.3730
Bias - Bearish
Technical Indicators: Supper Trend gives a precise Bearish signal, while Pivot Point HL predicts price changes and potential reversals in the market.
Target - 1.3668
My Stop Loss - 1.3761
About Used Indicators:
On the subsequent day, trading above the pivot point is thought to indicate ongoing bullish sentiment, while trading below the pivot point indicates bearish sentiment.
Disclosure: I am part of Trade Nation's Influencer program and receive a monthly fee for using their TradingView charts in my analysis.
———————————
WISH YOU ALL LUCK
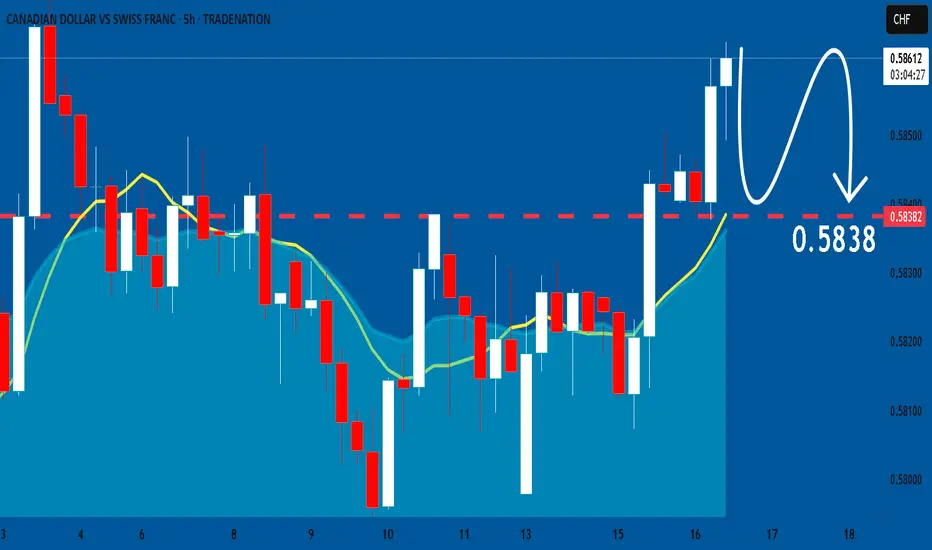
CADCHF: Bearish Continuation
Looking at the chart of CADCHF right now we are seeing some interesting price action on the lower timeframes. Thus a local move down seems to be quite likely.
Disclosure: I am part of Trade Nation's Influencer program and receive a monthly fee for using their TradingView charts in my analysis.
❤️ Please, support our work with like & comment! ❤️
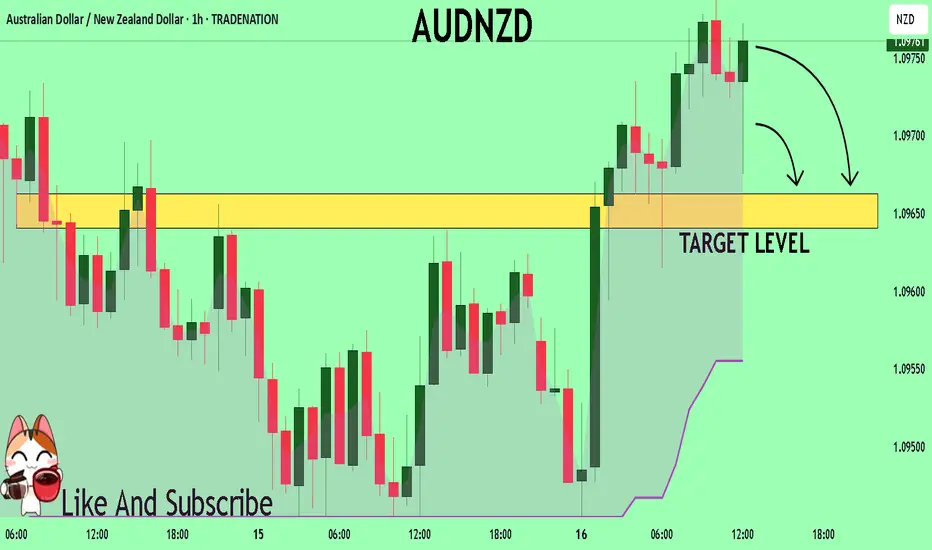
AUDNZD Under Pressure! SELL!
My dear followers,
This is my opinion on the AUDNZD next move:
The asset is approaching an important pivot point 1.0975
Bias - Bearish
Technical Indicators: Supper Trend generates a clear short signal while Pivot Point HL is currently determining the overall Bearish trend of the market.
Goal - 1.0966
About Used Indicators:
For more efficient signals, super-trend is used in combination with other indicators like Pivot Points.
Disclosure: I am part of Trade Nation's Influencer program and receive a monthly fee for using their TradingView charts in my analysis.
———————————
WISH YOU ALL LUCK