woo usdt perpetual Hello fellow traders
Greetings from team Trading The Tides
lets talk about Woo which we been trading for the last 3 days and made around 30% in profits .
today as the FOMC is really close and there many crucial Data down the line .
First of all specifically today I don't see much buying in WOO , secondly Woo is creating more and more resistance to the upside , which make me think not to trade woo until it goes back to support and on atleast 15 min time frame creates a wick which in other sense gives idea about institution getting in to take the prices higher , so I will wait till then .
My second opinion about woo is to break the lows of the symmetrical triangle on 4h , 1h
and then we can plan a short trade again on the basis of breakdown structure with proper risk n reward .
I don't take more than 2% SL so if the trade goes opposite , I will accept the SL and look out for other opportunities .
Note :
I am just a technical , fundamental analyst and day trader .
Any info given is not a financial advice , i am only posting what i think is right , feel free to guide if u think i am wrong plz .
Thanks .
Shortposition

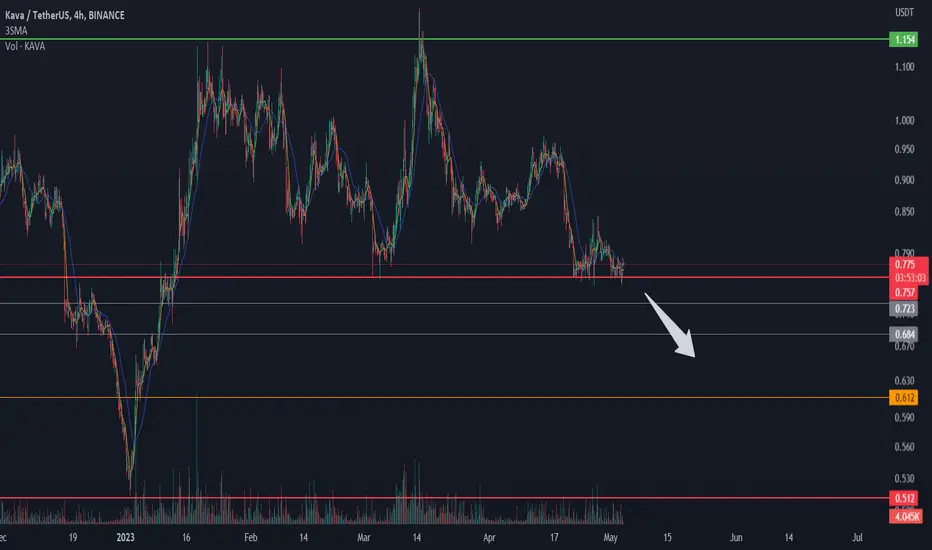
kavakava is in imp support if it is broken we can open a short positon but in the gray line in the chart I will save profit
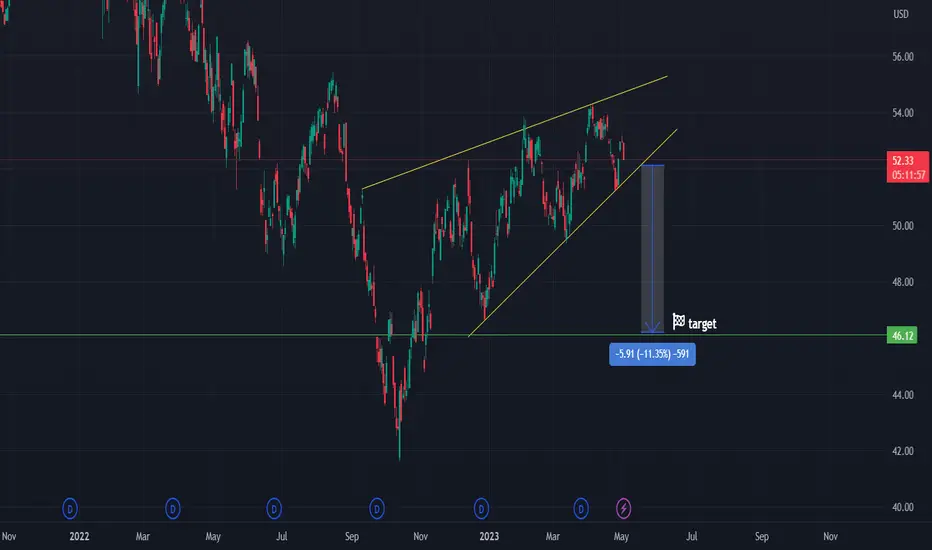
NVDA RISING CHANNEL On the chart we can see the rising channel.
Our strategy is to enter short when the price break down the upsloping support.
You can also enter short position at the bearish retest.
Target is shown on the chart.
Invalidation of this thesis would be if the price comes back inside the channel.

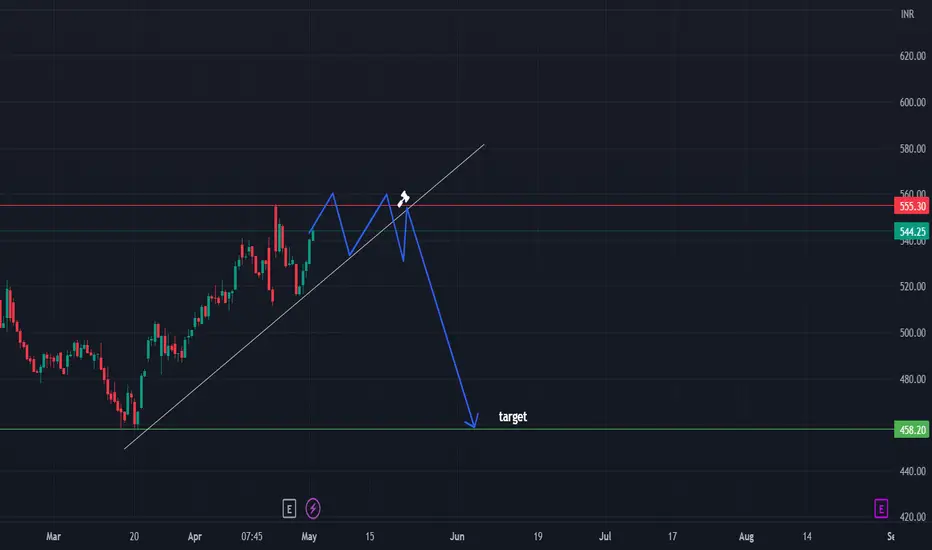
HDFCLIFE short positionThe price is respecting upsloping support. However it is approaching horizontal resistance.
Our strategy is to enter short position once the price breaks the upsloping support and back tests it and confirms it as a resistance.
The target: 458.20$
In validation of this thesis would be if the price comes back above the upsloping support
TATASTEEL short positionThe price has been traded in the range.
Currently the price has been approaching the upper boundary of the range, which should be acting as a resistance.
The price has been respecting an upsloping support and we believe that the price will hit the resistance which would be our entry for the short position.
Target and stop loss are shown on the chart.

TDIV - rising wedgeThe price is still moving inside the pattern.
Enter the short position when the price breaks down out of the wedge.
Invalidation would be if the price comes back up to the inside of the pattern.
Target is shown on the chart.
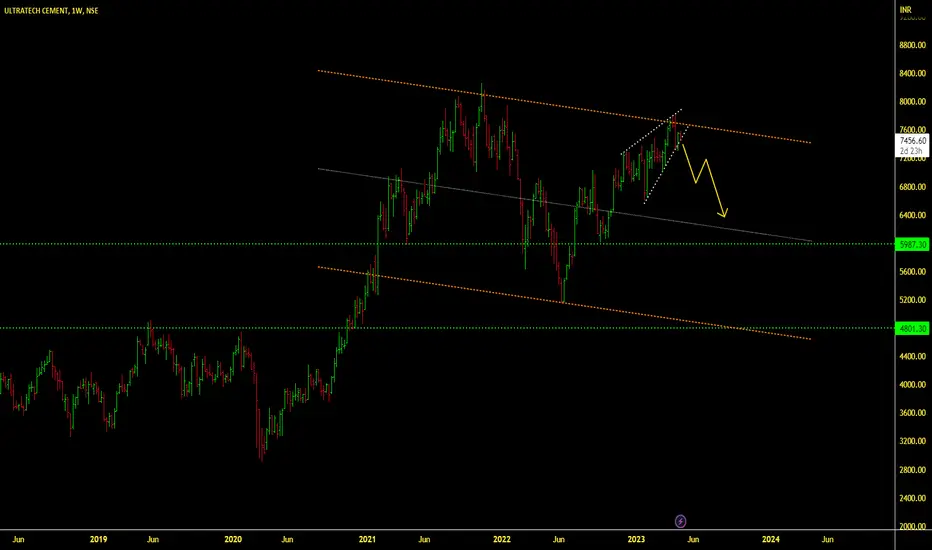
Ultratech Cement (Short):Ultratech Cement (Short):
Buckle up, we are ready for the dive.
Note: Do your own due diligence before taking any action.
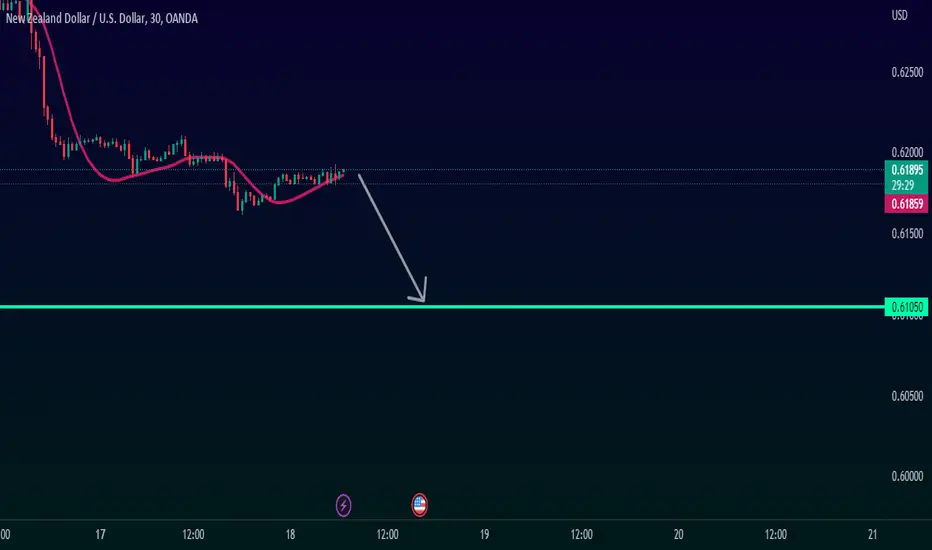
it's time to falling for NZDUSDIT CAN BE ACTIVE AFTER CROSSING DOWN OUR PINKY LINE...
Don't forget Like&Comment for giving energy to Me
CADJPY Trade! Before / After.Hello traders around the world!
My name is Alexandre Karim and today I am going to tell you how I took my double short position on CADJPY.
In my previous analysis on this pair (Shared Apr 18), I was looking for a reversal pattern in this area since we are on the third touch of the upper TL.
The price went up correctively reaching this area & gave us a double top as well for more confirmation.
Therefore, the pattern that I took (First short position) was the break out of the hourly ascending channel and I sat my SL above the previous high (100.664). When the price gave us the first impulse all the way down to (98.930) I moved my SL to Break Even.
The second pattern / second position that I took was the hourly bearish flag signaling a continuation to the downside.
My entry was at the break out of the structure (Bear flag) + my SL at (99.588) above the previous high.
Then moved my SL to BE when the price gave us the impulse to the downside.
Currently both of my positions are at BE now and I will be waiting for 1 hour corrections to lock above them and secure %
Patience is key.
Risk management is crucial.
Aim for quality trades.
#THEPRIMES

CHZUSDT SHORT POSITIONAccording to the chart price has broken the up-trend and now price is testing the resistance area

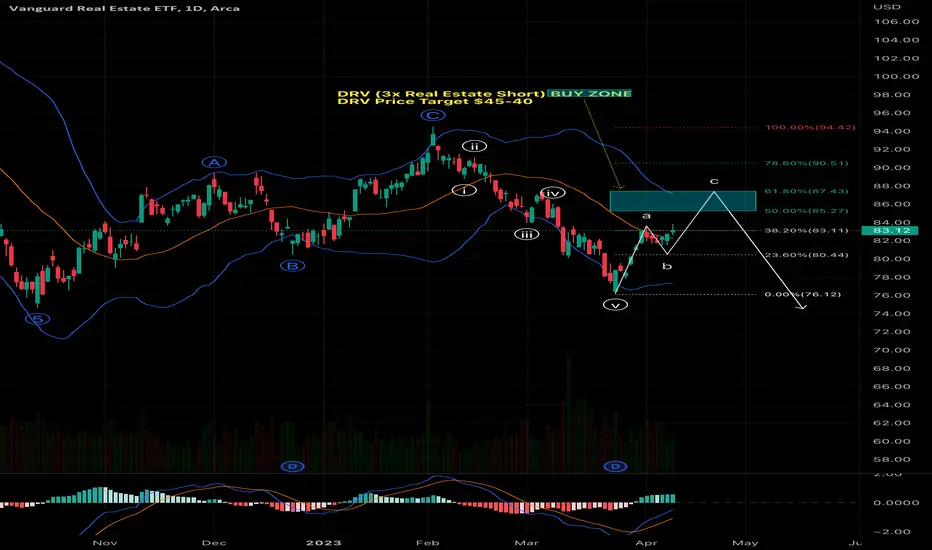
DRV buying opportunity comin up!Referencing VNQ to target a 3x short position as it provides a clearer picture of the sector than its leveraged counterpart (DRV).
As we cycle the 2022 interest rate increases this idea is supported fundamentally as well.
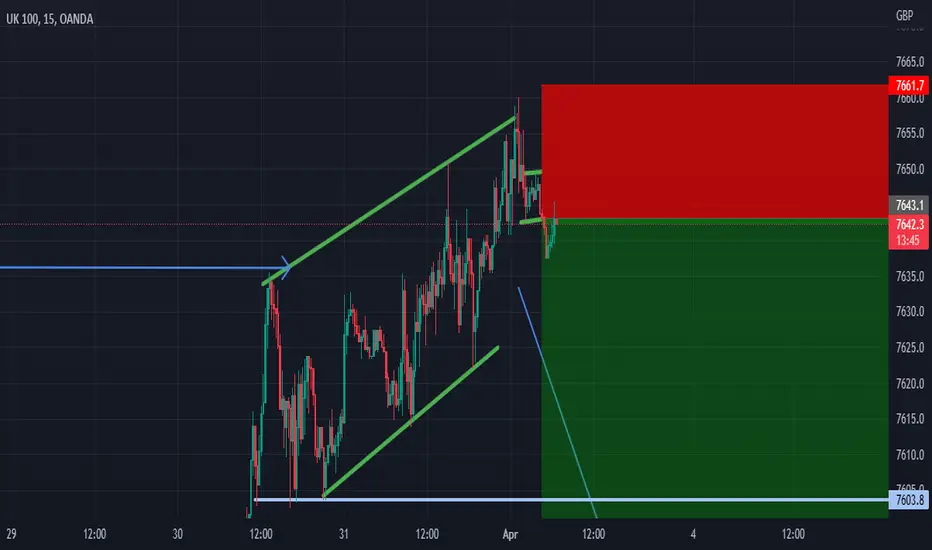
uk100 shortprice has been ranging between bottom resistance @6780.2 and top resistance @7917.9 on a daily timeframe. 0n the 1hour timeframe there is a small resistance at 7636.6 which price retested in an ascending channel. On the 15min there is a flag which I'm using as entry with stoploss at 7661.7 and take profit at 7465.2
USDCAD - BEARISH FLAGAs the graph shows the BEARISH FLAG following by a strong bear trend. As a continuation pattern, the bear flag helps sellers to push the price action further lower.

BTC DiamondConsidering the non-breakage of the 38% Fibonacci level and macroeconomic variables, the completion of the diamond pattern is not out of mind
We must be ready to complete the Bitcoin diamond
BTCUSDT Short position (scalp) 23-3-15This is a short term position on Bitcoin.
Because this position is against the trend, it has high risk, so please manage your risk.
Entry point: 25330
Loss limit: 26160
Targets:
1: 23966 ( Risk Free your position )
2: 23205
3: 22600
This Analysis will be updated ...
Sadegh Ahmadi: @SDQ_Crypto
15. Mar .23
(DYOR)
❤️ If you apperciate my work , Please LIKE and COMMENT , It Keeps me motivated to do better❤️

CG Power -Bearish View CG Power and Industries - Longer term View - Bearish view
Bearish View - Longer Term View
Sell @ 290
Stoploss @ 307
Target @ 213
R:R @4:15

Best zone for short in Eurusdwe had a bullish choch in the daily timeframe, so if i want to take a risk and if i want to open a short position (with a low probability of activation), I will do so from the two specified areas and i avoid getting short on gaps, because the trend is bullish (in the bigger timeframe(daily))
GoodLuck everyone.

Impluse Correction ImpulsionThis is not a financial advice, and also make sure to make calculated risk before taking a trade.
Just be patient.With the weekly and Daily Tf in Sync (Bearish), we might see the formation of the head and shoulders to put the 1H also in sync with the higher time frames.
This is not a trading or financial advice and also, make a good use of risk management and let it run.
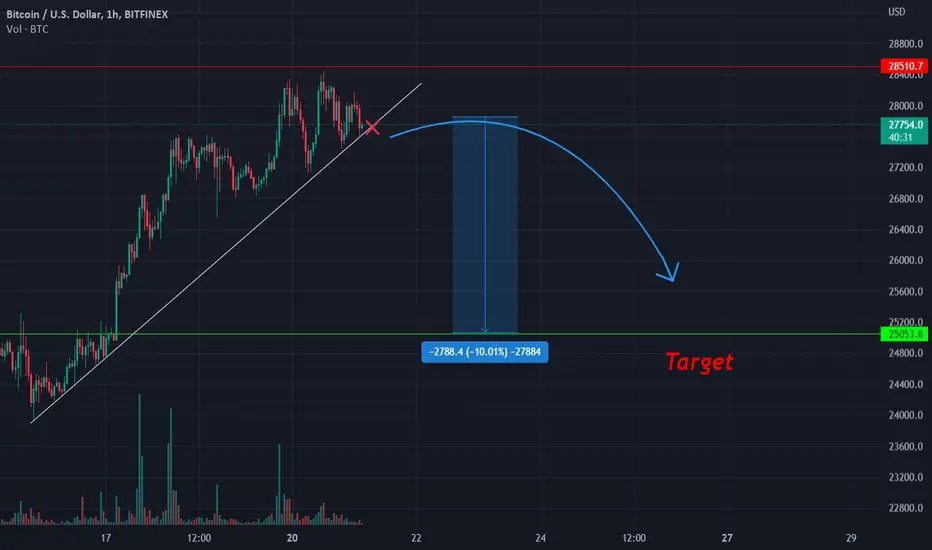
BTC SHORT POSİTİON BINANCE:BTCUSD short position %10 wave. Waiting to break for 25.000 $. I wish you good luck.
A Deep Dive into Bitcoin's Technical Analysis and News ImpactBitcoin's current price is $24700, and it's being analyzed over a 4-hour timeframe. The Relative Strength Index (RSI) is 64, indicating that the cryptocurrency is in slightly overbought territory but still has some room to grow. The Volume oscillator is -8.52%, which indicates lower trading volume than average. The Moving Average Convergence Divergence (MACD) is currently at 1010, which indicates that the bullish momentum is strong, but it could turn into a bearish one if the trend reverses.
On the technical side, the 4-hour timeframe Fibonacci retracement levels suggest that Bitcoin's support levels are at 0.5 Fibonacci level of $22967 and 1 Fibonacci level of $19549, and resistance levels are at 0 Fibonacci level of $26386 and upper Bollinger band of $26813. The lower Bollinger band of $19820 is acting as strong support. The middle Bollinger band of $23317 indicates the average price level.
Bitcoin is facing a sharp correction in its price. The Paxful founder called the recent pump to $26000 as weak, indicating that it could be a bubble. On the other hand, a South Korean trader lost almost $1 million by shorting Bitcoin.
Based on the technical analysis, it seems that the current price of Bitcoin is likely to experience some resistance at the 0 Fibonacci level of $26386 and the upper Bollinger band of $26813. It may also find some support at the 0.5 Fibonacci level of $22967 and the lower Bollinger band of $19820. The sharp correction could have contributed to the lower trading volume indicated by the volume oscillator. The Paxful founder's statement may have added to the bearish sentiment, but the strong bullish momentum indicated by the MACD and Stochastic oscillators suggests that the current price drop may not last for long.
Regarding opening long or short positions, it depends on an individual's trading strategy and risk tolerance. However, here are some possible scenarios:
Long position: If the price bounces off the strong support levels and starts to move upwards, it could be a good spot to open a long position. Additionally, if the price breaks above the strong resistance levels with strong momentum, it could also be an opportunity to open a long position.
Short position: If the price breaks below the strong support levels with strong momentum, it could be a good spot to open a short position. Additionally, if the price reaches strong resistance levels and shows signs of rejection or reversal, it could also be an opportunity to open a short position.
It's essential to keep in mind that any trading decision should be made with proper risk management techniques in place, such as setting stop-loss orders and taking profits at predetermined levels. Additionally, traders should keep an eye on any relevant news or events that could impact the price of Bitcoin.

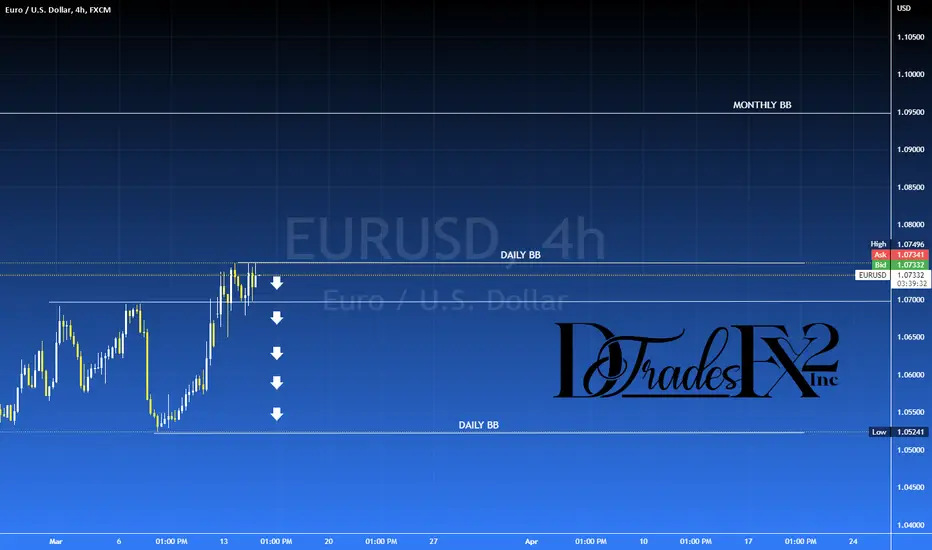
EURUSD$EURUSD
EU made a short push to the upside but couldn't push pass 1.07492 breaker after CPI.
Since that's the case, I'm looking for EU to move to the downside.
Disclaimer: This is not trade advice. Trading foreign currencies, stocks, indices, etc can be a challenging and potentially profitable opportunity for investors. However, before deciding to participate in the financial markets, you should carefully consider your investment objectives, level of experience, and risk appetite. Most importantly, do not invest money you cannot afford to lose!!!
Good luck and Happy trading!