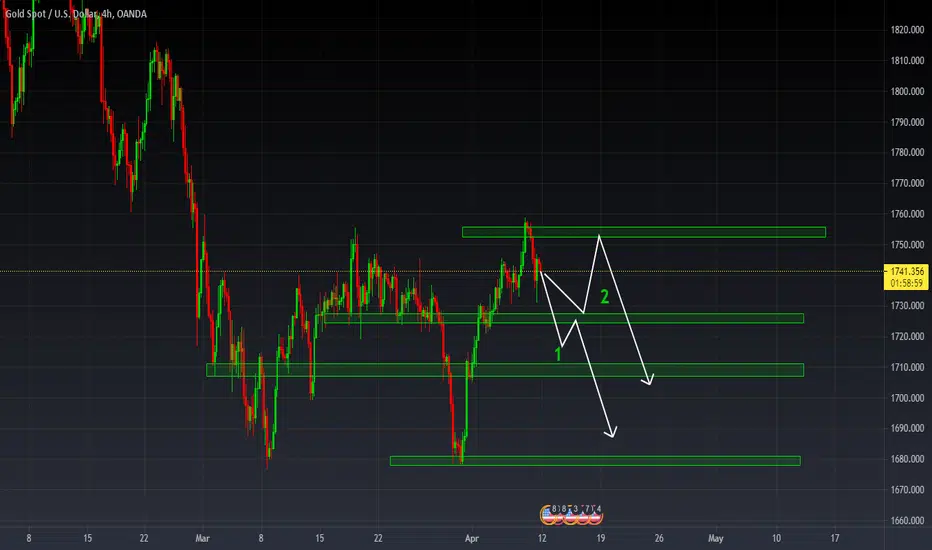
XAUUSD PRE-MARKET ANALYSIS 12 APRIL, 2021OVERALL TREND DIRECTION- BEARISH ON THE DAILY TF. Corrective and ranging on the 4H TF. We can see that price has made a double top pattern and may potenially look to make lower lows to respect the overall move to the downside.
The 2 potential short scenarios this week are as follows.
Scenario 1 will follow a break and retest of that support level to the downside.
Scenario 2 will follow a bounce off that key structure level and a rejection off of the most recent high to the downside, where we can look for short opportunities to continue the bear momentum.
Shortposition
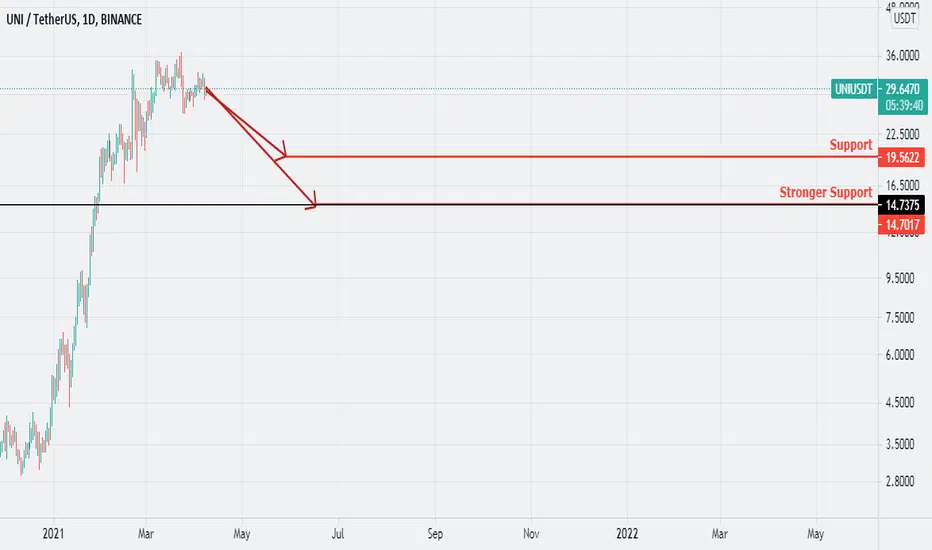
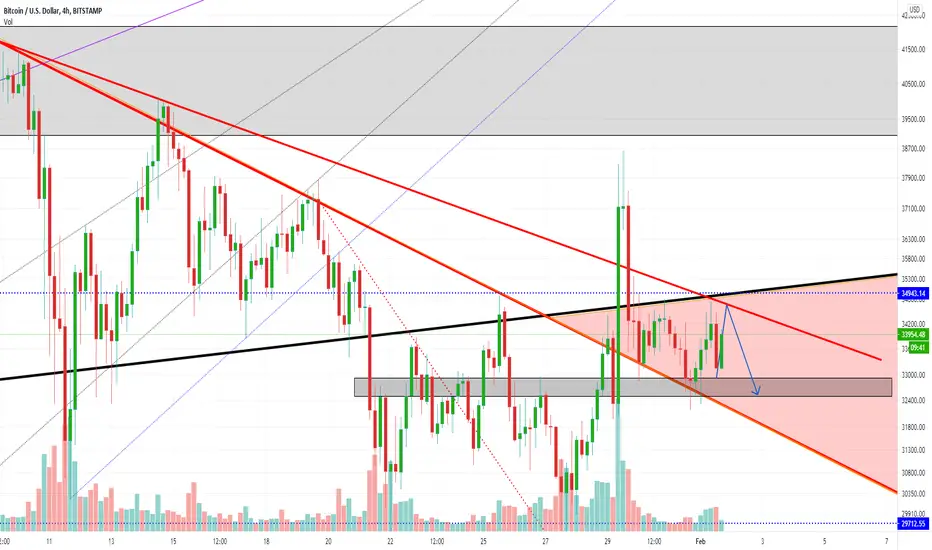
Downtrend The chart appears to be on a downward trend. The chart shows two important supports.
Lower support is drawn in the weekly timeframe, where it breaks its weekly ceiling in the weekly timeframe.
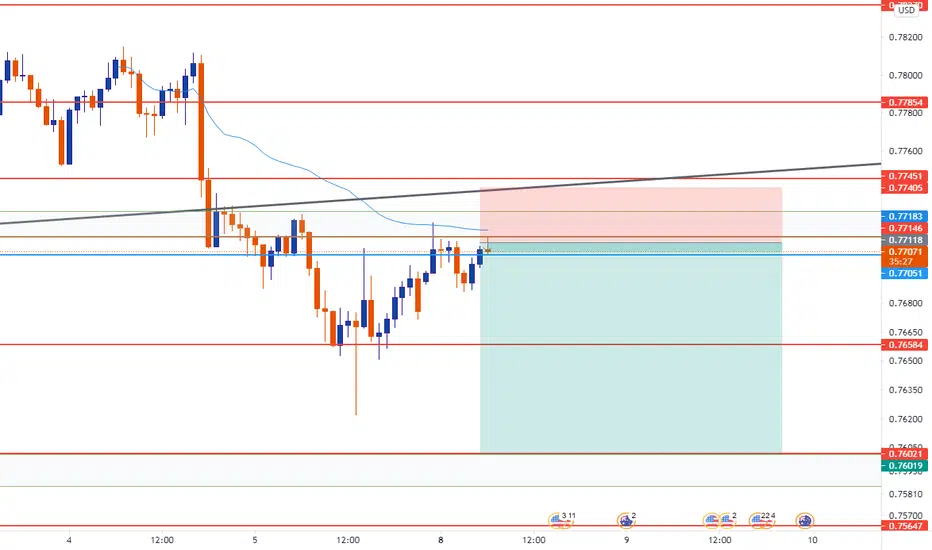
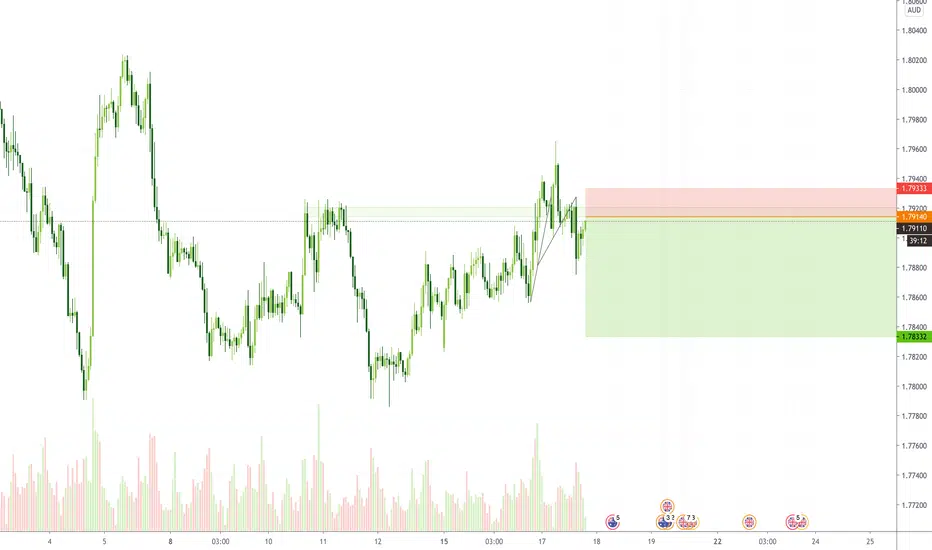
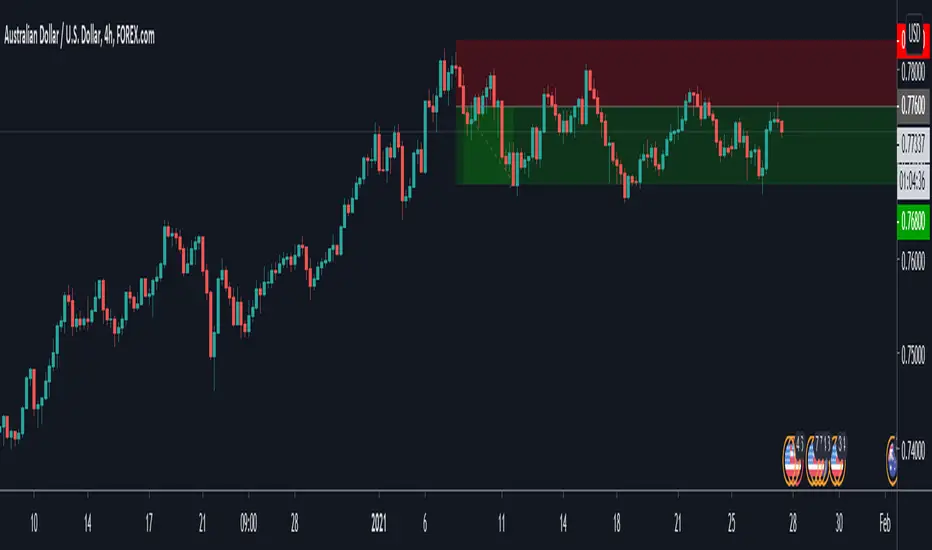
AUDUSDShort setup on Aussie , break of structure price went back to retest i see it respecting the current zone and dropping even further , Risking 22 pips , for a possible Reward of 103 pips , RRR of 1:4 .
Take a short position on IA Financial stockPrice is going up within an ascending channel and based on Elliot waves theory we ca expect to see it on the lower levels soon.
It's not likely to see the price lower than the channel levels though.

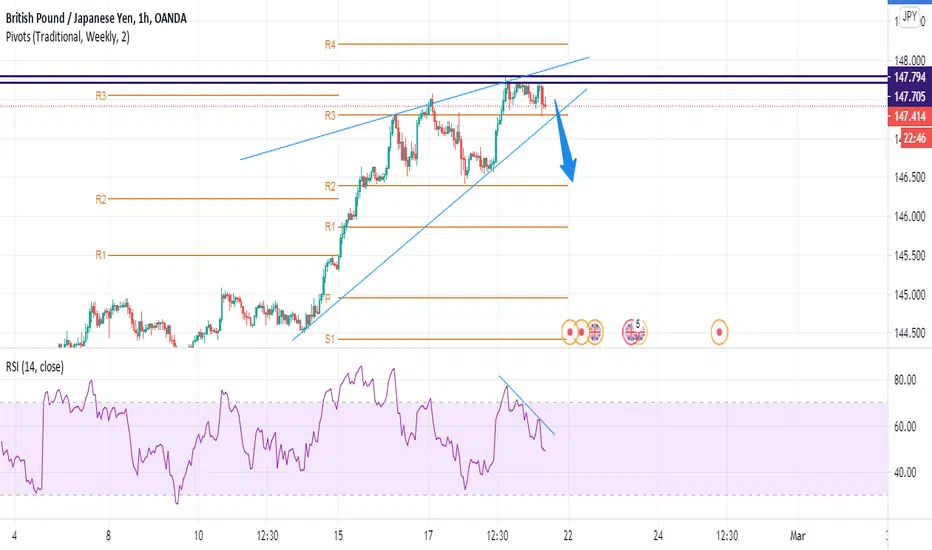
GBPJPY H1 AnalysisOANDA:GBPJPY
1- Strong Resistance at the Top
2- Rising Wedge Pattern
3- RSI Simple Divergence
*Our target can be R2 weekly pivot line.
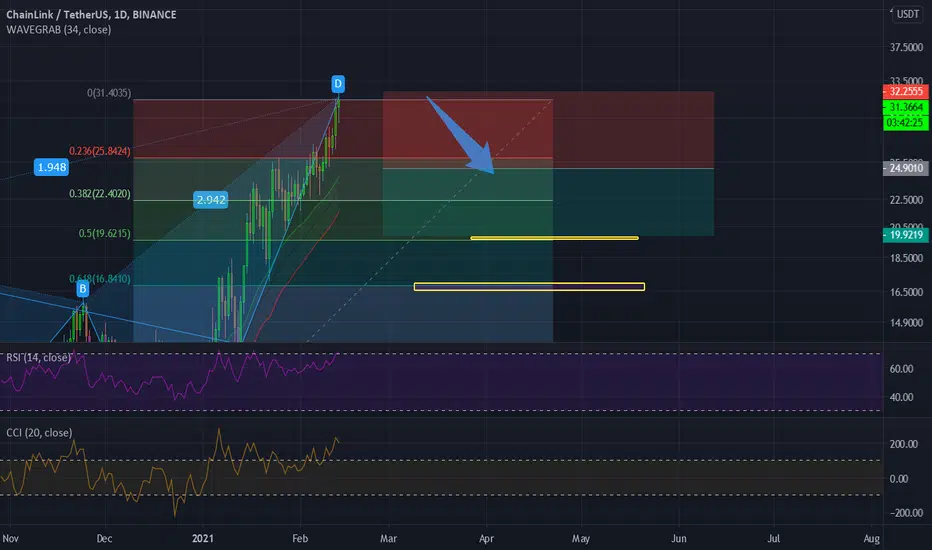
The Graph Triangle Pattern (GRTUSD)The price can break out of the triangle upwards or downwards.
I will only open the long position after breakout, confirmation and an increase in volume.
Not financial advice, cheers ✌️💫🚀 .

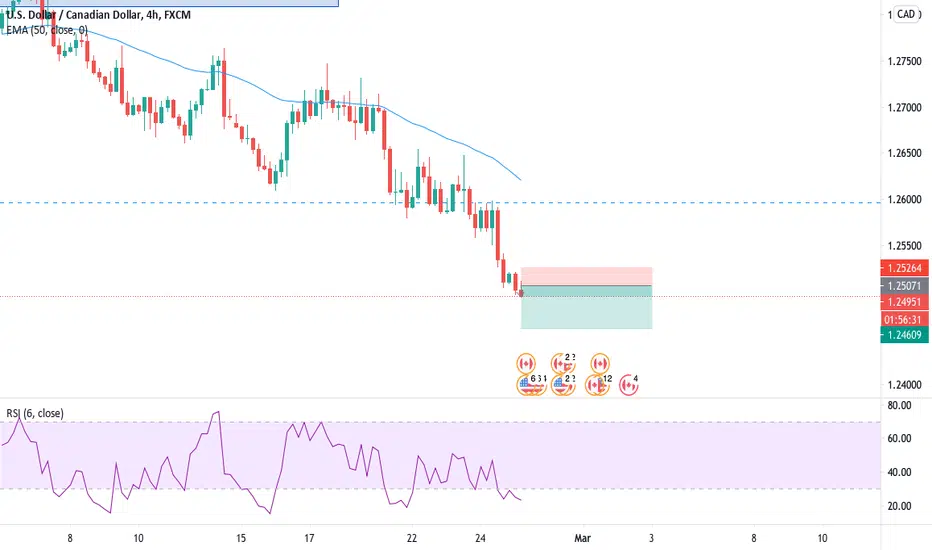
CADCHF - SELL SELL BIAS
Price has approached a triple top zone, need to wait for an LTF correction as drawn-out before entering a sell trade


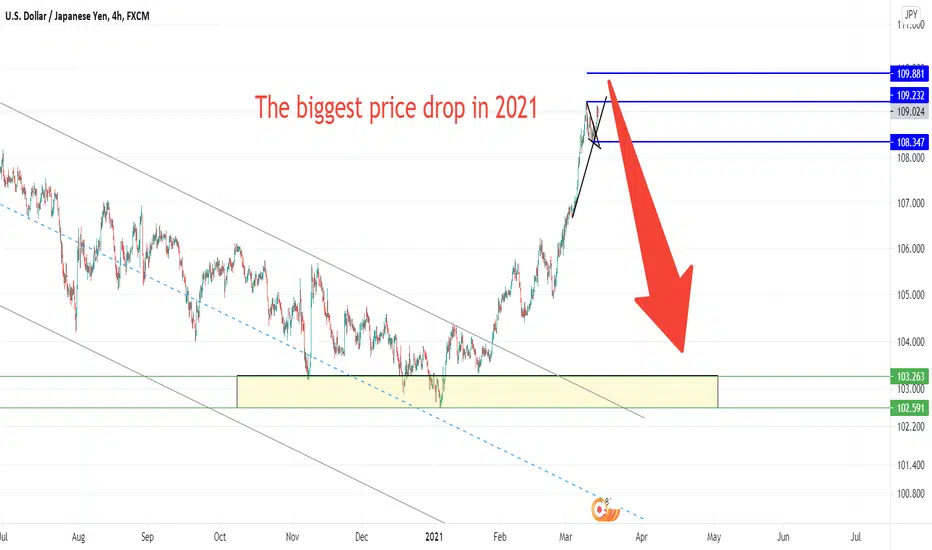
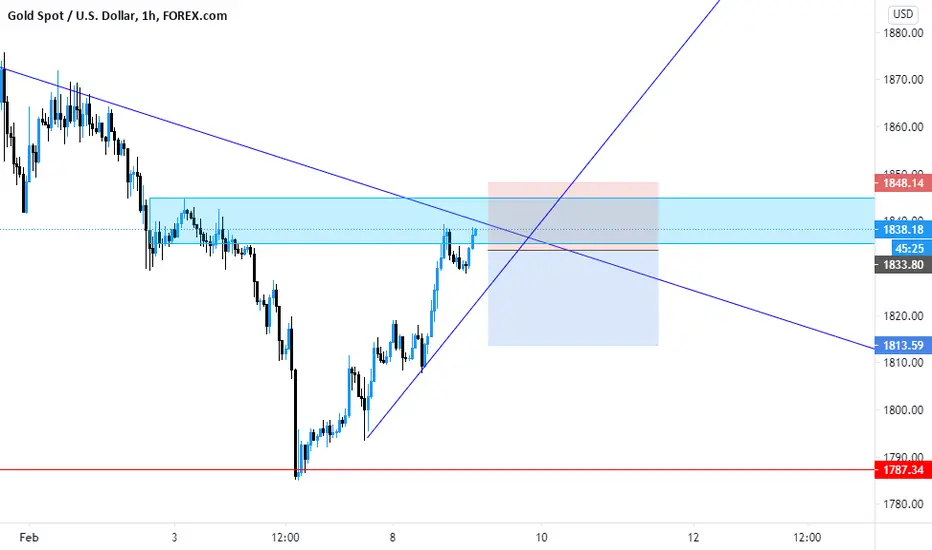
GOLD MAY FOLDGold is heading into the 3 following structures;
1. A trendline resistance
2. A Classic Resistance
3. An H1 supply imbalance nested within an H4 Supply Zone
Also to note the daily trend is Bearish one , so adding one to one , the best direction to plan an entry is to go short with an exit target below the last D1 supply zone.
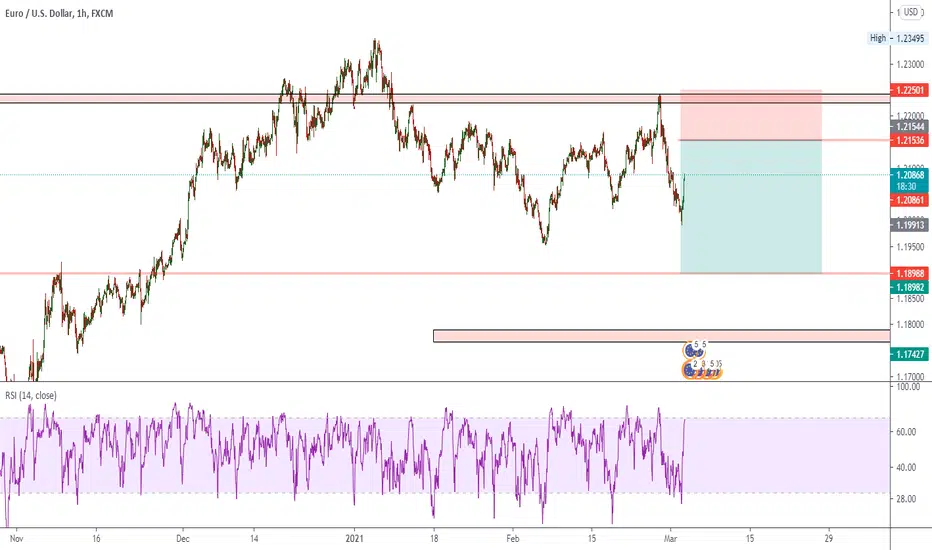
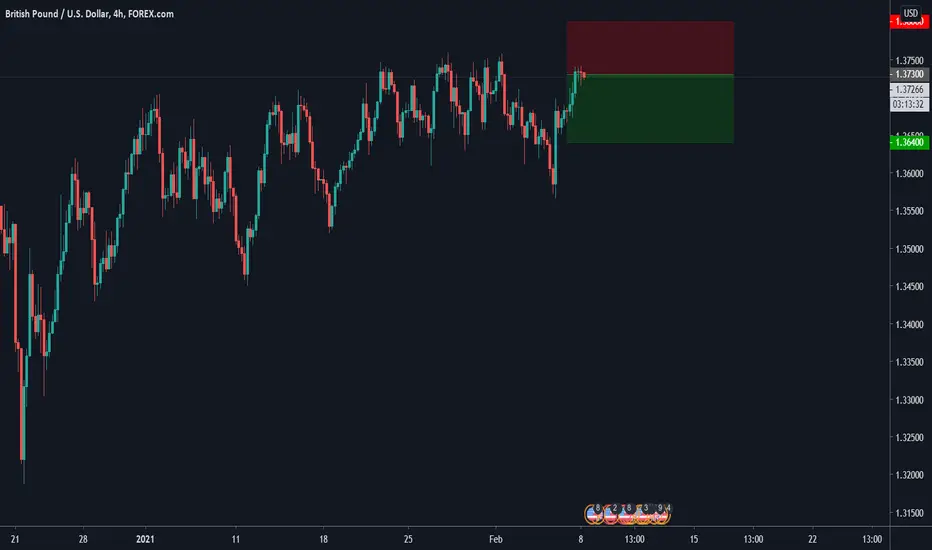
[GBPUSD Short] 8 Feb, 2021 - Roger V Trading IdeasGBPUSD
Entry Resistance level idea:
1.373000 Resistance
TP Support level idea:
Target 1: 1.36400 - 1.3675000 (Potential of short term consolidation here.)
Target 2: 1.356500
Final SL for all Short positions:
1.377000 - 1.380000 Resistance Level
(This was first shared on 5 Feb 2021 in another group, just got time to have it post on trading view as well, hope you all enjoy it.)
--------------------
(Note: The forecast above is an estimation of the resistance/ support level for the entry, TP, and SL. For more precise positions will depend on the shape formed with the candlestick at the time.)
--------------------
Disclaimer: ALuoTradingJournal does not provide any personal advice or general advice. This is only a journal to keep ALuo in noting the trades and what the market is going on as a trading journal. ALuo will not take any responsibility for any profits or losses. Please trade at your own risk.
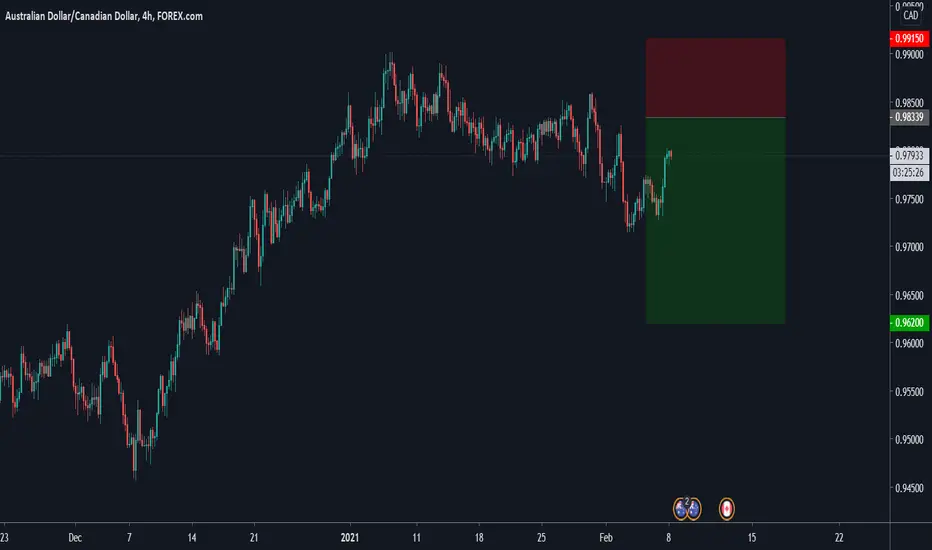
[AUDCAD Short] 5 Feb, 2021 - Roger V Trading IdeasAUDCAD
Entry Resistance level idea:
0.984000 Resistance
TP Support level idea:
Target 1: 0.962000
Final SL for all Short positions:
0.9915000 Resistance Level
(This was first shared on 5 Feb 2021 in another group, just got time to have it post on trading view as well, hope you all enjoy.)
--------------------
(Note: The forecast above is an estimation of the resistance/ support level for the entry, TP, and SL. For more precise positions will depend on the shape formed with the candlestick at the time.)
--------------------
Disclaimer: ALuoTradingJournal does not provide any personal advice or general advice. This is only a journal to keep ALuo in noting the trades and what the market is going on as a trading journal. ALuo will not take any responsibility for any profits or losses. Please trade at your own risk.
[EURJPY Short] 5 Feb, 2021 - Roger V Trading IdeasEURJPY
Entry Resistance level idea:
127.1000 Resistance
TP Support level idea:
Target 1: 125.75000
Target 2: 124.65000
Final SL for all Short positions:
127.9000 Resistance Level
--------------------------------------------
EURJPY Trading Comment
EURJPY currently focusing on the price action double top to see if it can be resisted over at 127.100 resistance level.
If a double top forms, it is expected to see a bearish trend to fall roughly 200 pips down. However, trading must always be aware of the worst scenario. Therefore, 127.900 resistance level, if it fully breaks. All short position trades will be terminated.
Hint:
Always remember to control the lot size, and not over trade in a short-range in pips.
(This was first shared on 5 Feb 2021 in another group, just got time to have it post on trading view as well, hope you all enjoy.)
--------------------
(Note: The forecast above is an estimation of the resistance/ support level for the entry, TP, and SL. For more precise positions will depend on the shape formed with the candlestick at the time.)
--------------------
Disclaimer: ALuoTradingJournal does not provide any personal advice or general advice. This is only a journal to keep ALuo in noting the trades and what the market is going on as a trading journal. ALuo will not take any responsibility for any profits or losses. Please trade at your own risk.


[AUDUSD Short] 27 Jan, 2021 - Roger V Trading IdeasAUDUSD Trading idea comment:
The previous AUDUSD trading idea provided on the 12th of November 2020 was expired after the breakout of the final SL resistance level of 0.736000.
The direction changed from bearish to bullish after the breakout.
Market during the first half of January in 2021 was very quiet and did not fluctuate much for most pairs.
However, I was looking around at the market on the 10th of Jan 2021 and saw some price action signal with the US Dollar index forming an earlier stage of reversal to a bullish direction.
In relation to this matter, AUDUSD is one of the major pairs that correlate with US Dollar Index.
If US dollar goes strong in its value, inversely AUDUSD goes in a bearish direction. Vice versa with US Dollar index going weak against with AUDUSD.
It took me 17 days from 10th January 2021 to 27th January 2021, to make a decision that AUDUSD can be one of the selected pairs in the list to go for its trading opportunity.
AUDUSD has been in a consolidation of its high and low between 0.769000 to 0.782000 (Still currently on-going with the consolidation.)
What is the reason to finally decided to trade AUDUSD?
It was a tough decision this morning to decide AUDUSD to confirm to have it be a part of the selected trading pairs.
Main factors I see that made my decision for AUDUSD:
1. Price Action
a. Upper shadow high for each candle is lowering each week, and no new highs is breaking up the highest one.
AUDUSD Weekly Chart
a. Descending Triangle pattern channeling
i. It is quite similar to the price action. However, the difference between descending triangle is that, it looks at the breakout of the triangle. If it breaks upwards, it means that the trend will go in a bullish. Vice versa, if breaks downwards then it will go in a bearish trend.
AUDUSD Daily Chart
3. US Dollar Index volatility strength
a. An in depth/ update about the US Dollar index is written in the follow articles
i. 12 Jan 2021 - US Dollar Index (Read more)
ii. 21 Jan 2021 - US Dollar Index (Read more)
Extra Notes:
Taking note that AUDUSD previous effective high happened in July 2017 going pass 0.78XXXX. (Please refer to the image below to see the chart.)
The high gone over 0.78XXX in 2021 is considered the only effective high comparing with the past 3 years.
When new highs are created, to be more conservative it is best to wait for more signals on the higher time frame until it gets more stable and then start after that to have a higher possible winning accuracy for the pair.
Right now, this trading idea is announced. Roger V will put this pair in list to try for its trading opportunity for AUDUSD.
Worst Case Scenario:
Two options:
1. Can wait or ask Roger V on Roger V Diamond Club, to see if the trend is actually true breakout or false break.
a. If true breakout - try to find a lower loss to stop loss.
b. If false breakout - hold it, and carefully look at the weakening signal from M15 to H4. (Same method as looking at the weakening signal candlestick combination taught in group.)
2. Can stop loss straight away at the final SL, if the loss amount has gone over your expectation. (This is to be known before you make any orders.)
Best Case Scenario:
Trend does not breakout final SL of 0.867000 support level.
Once reach target 1 0.895000 and gets resisted and goes in a retracement. Re-entries for long position will be available among the new re-entry trading idea.
--------------------
(Note: The forecast above is an estimation of the resistance/ support level for the entry, TP, and SL. For more precise positions will depend on the shape formed with the candlestick at the time.)
--------------------
Disclaimer: ALuoTradingJournal does not provide any personal advice or general advice. This is only a journal to keep ALuo in noting the trades and what the market is going on as a trading journal. ALuo will not take any responsibility for any profits or losses. Please trade at your own risk.
USDCHF shortShort position for USDCHF below 0.8880, targets at 0.8855 - 0.8840, extended target 0.8820
