Canadian Dollar is strenghten agains the US Dollar!!!In this technical analysis, Canadian Dollar is more strenghten than US Dollar
So, I make this analysis in Daily because it's seem a nice opportunity in short of this par for the next days. Because US Dollar is weakness than US Dollar. Also, htis par is one of the opportunity month to find down pips because I proyect a possible drop of 600 pips. Followin the elliot waves analysis, we are in the Elliot Wave #4 to find down the Elliot Wave #5. This is a huge opportunity for longer in short.
That is what I explained in weekly taht the price is go down to find down the trend line of ascedent triangle that we were from 2015.
But rememebr than in long-term we see a USD agains the CAD so bullish into the target at $1.64 CAD, and that mean that Canadian Dollar is continue devaluated from long-term agains the USD and that is a great opportunity if you want to put in long position when the price is leave at $!.29 CAD approximately, that is the 600 pips of bearrun that I hope.
Shortposition

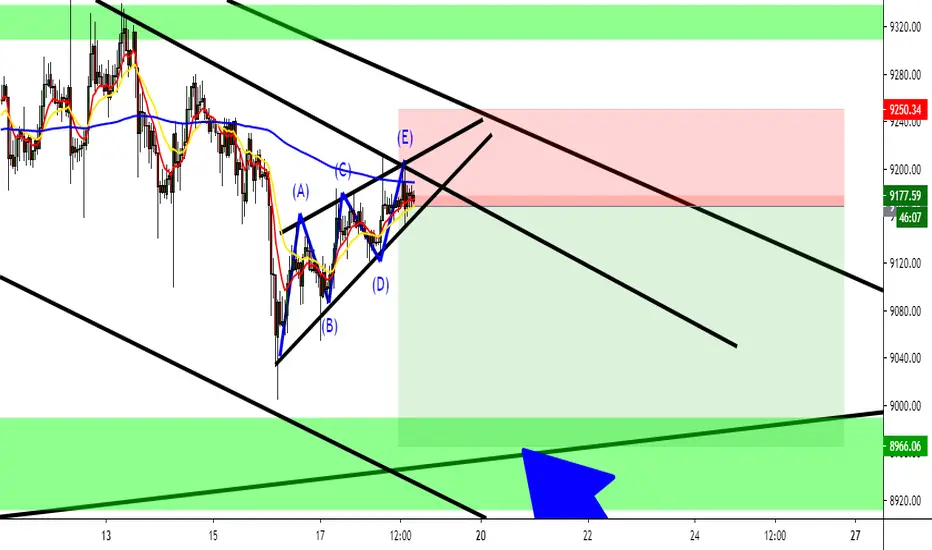
Updates: Another confirmation to put in short positionBitcoin is into the bearish rising wedge, so this is a nice scenario to put another lots of Bitcoin to earn money, and we are to finish the Elliot Wave Correction ABCDE to later in some hours to drop and find down the green support that we can appreciate in Daily.
Also, another confirmation is that we are into this descendent channel that we can to appreciate in H4 timeframe.
And finally, we are in Daily that objective so bullish later the Bitcoin goes to the demand zone of the green zone
I will going to check other altcoins now!!! That is an interesting position to put in short in Bitcoin as another altcoin to see it.
Canada Dollar is strenghten agains the US Dollar: FundamentalsIn this technical analysis, US Dollar agains the Cadandian Dollar!!!
Remember tha expectative for US Dollar is bullish, but we are to find down the Elliot Wave # E, I believe that this par is one of the best technical anlysis to make money in the next week invest a considerale lots to earn money!!!! But, It's so beautiful to see how US it's been one of the country more with Covid-19 cases, That spend time a drop off of more of 4% in US Dollar.
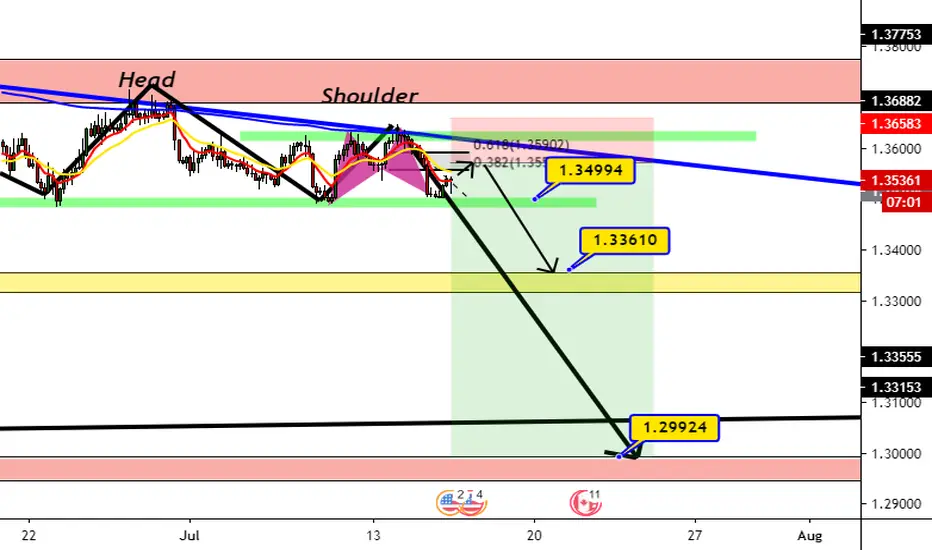
In Daily, rememebr we follow this squenze, because we are to find down the Elliot Wave # 5 in Daily timeframe. Also, if you noticed it, we are in the shoulder head shoulder with a possible drop of the price. So, I prepared to invest in this par for the next week to earn money. As we follow the elliot wave squenze, we are in the good zone to put in short position
Now, in H4 timeframe ther are an interesting entry in short, remember that the key is in H4 and Daily timeframe, are the most effective entry in short. Also, in H4 I identify a formation of Bullish Gartley, for not of all, because the trend is beairhs and we hope a confirmation of the price, this i analysis is so interesting to put in short, so so interesiting that you not imagine.
Well, this is the fundamentals what I found out today:
1. USD/CAD falls to one-week low as Bank of Canada says economy amoided worst case scenarios.
2. Bank of Canada kept it's fench-mark interest rates at the effective lower bound of 0.25% and now to keep rates unchanged until at least 2023.
3. Bank of Canada say a recent data had suggested the economy had bottomed in April, in a boost to hopes of a robust recovery
4. A comment of the Bank of Canda said this morning;
"We now estimate that the economy contracted by afort 15% in hte fist half of the year, but as deep as this it, it sugggest the economy has
avoided the most scenarios .
5. Bank of Canada did an indication that permanent scaning from the covid-19 pandemic will reduce the economy's long-term productive in 2022
6. Following the Canda's trend, the bank also pledged to continue to purchase government's bonds to keep rates low across the yield curve and support lending activity, and the back will continue its large-scale asset purchase program at a pace of at laast $5 billion of Canadian Dollar per week of governments to purhcase Canada govern'ment's bonds.
So, this is so bullish for CAD and bearish for USD, that is simple!!!
Updates for Bitcoin: Bearish Channel Rising Wedge Alert!!!In sca;ing timeframe 30 minutes, we see that Bitcoin has formed a Bearish Channel Rising Wedge, that pattern is continue of the microtrend, in that case is bearish. We continue in bearihs sentiment at this Bitcoin. Logically because there are a buyers hope to buy in this lower level in the exact zone of $9,000 USD. So, what mean this chartist patter?
That mean my frined is a sell off and there are a second opportunity to entry, I alreayd entry in sell at $9,219 USD and I'm in profit, so the moment is the entry in this to sell Bitcoin if you done entry in the higuer zone. So, in the next hours we needed to see a Bitcoin go back to the level of $9,000 USD. So guys, sell Bitcoin, and also, I add another 0.01 lots in Bitcoin to sell because my lots in Bitcoin to sell that I invest was of 0.06 BTC previosuly in sell + 0.01 lots add, So, I have 0.07 lots in sell of Bitcoin
Also, in H4 remember that we are in this bearish BAT with a large longer until the $9,000 USD. And also, as my collegue in my You Tube: The Moon say that as I say you that buyers are hope to buy Bitcoin at this zone as Bears makineg a down the price.
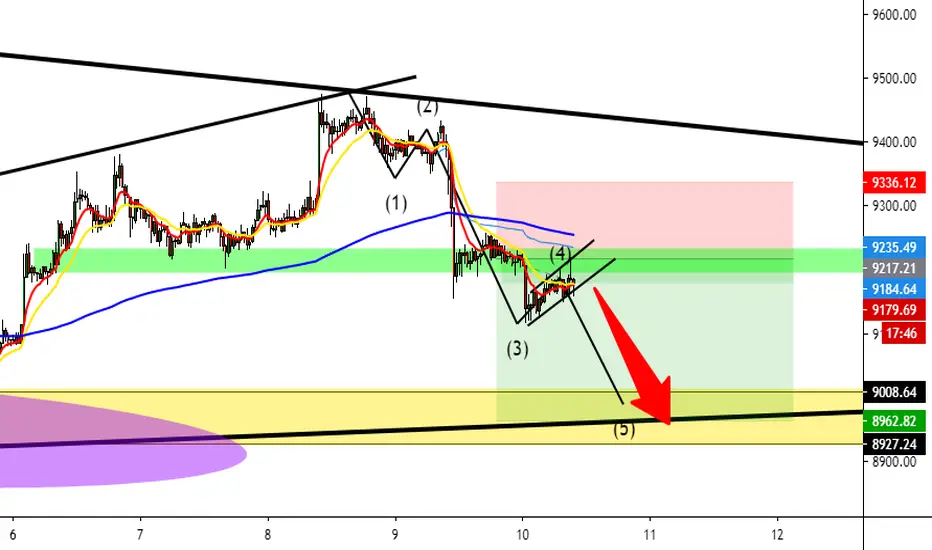
And to see so beautiful, we see in H1 timeframe the elliot wave analysis, we are in the elliot wave # 4 to later in the next hours to find down the elliot wave # 5 at $9,000 USD, if you want to large the target profit you can to do until the $8,950 USD,that is my zone that could reach Bitcoin in that yellow zone on Daily in demand. That strategy are about and absed for supply and demand, that is my strategies what for now I am making success.
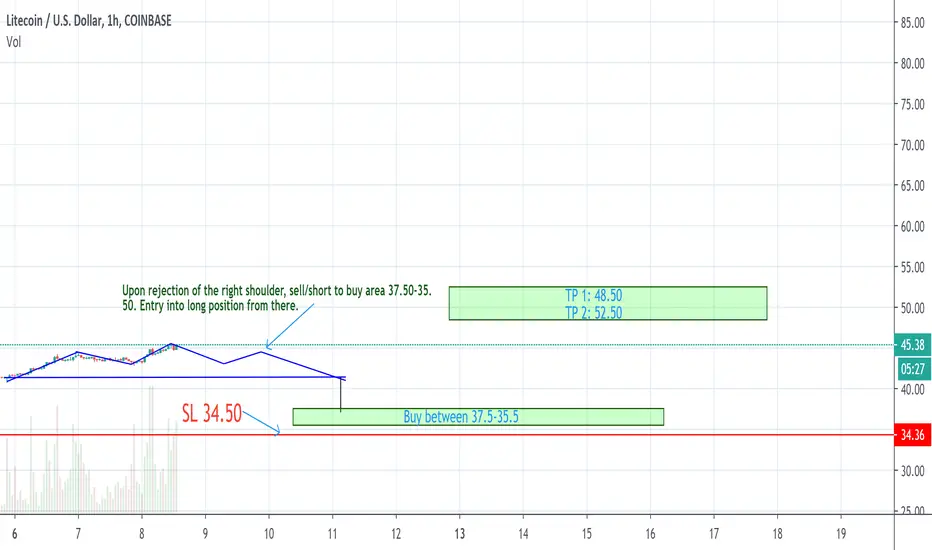
Short LTCDetail provided on the chart.
Looks like a head and shoulders pattern emerging on the 1h time frame. If confirmed as a head and shoulders would be a good time to buy up on dip to 37.50-35.50 area with a tp of 48.50 and 52.50
GBPUSD - Short Position, R:R 1:5GBPUSD - Short Position, R:R 1:5. I am taking a short trade on GBPUSD after price has shown rejection on lower timeframes (15M & 1H) and is respecting the descending trend line. My target is the next key level at 1.21700 which gives me a great R:R of 1:5. When applying the Fibonacci Retracement tool, price is also showing rejection at the 61.8% level which gives me a strong indication that price will soon drop to the downside.

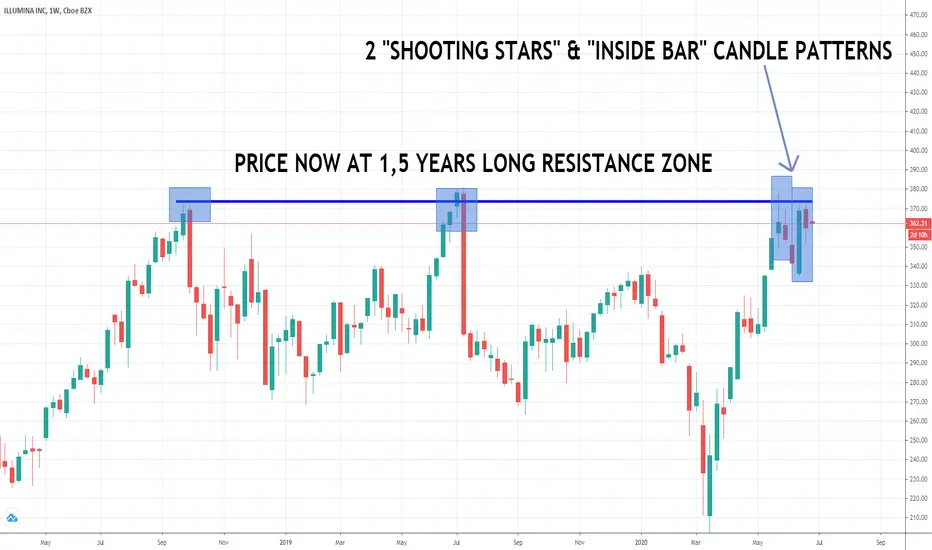
Illumina (ILMN) shares sell signalsIllumina (ILMN): weekly chart: Resistance zone + 2 Shooting Stars + Inside Bar
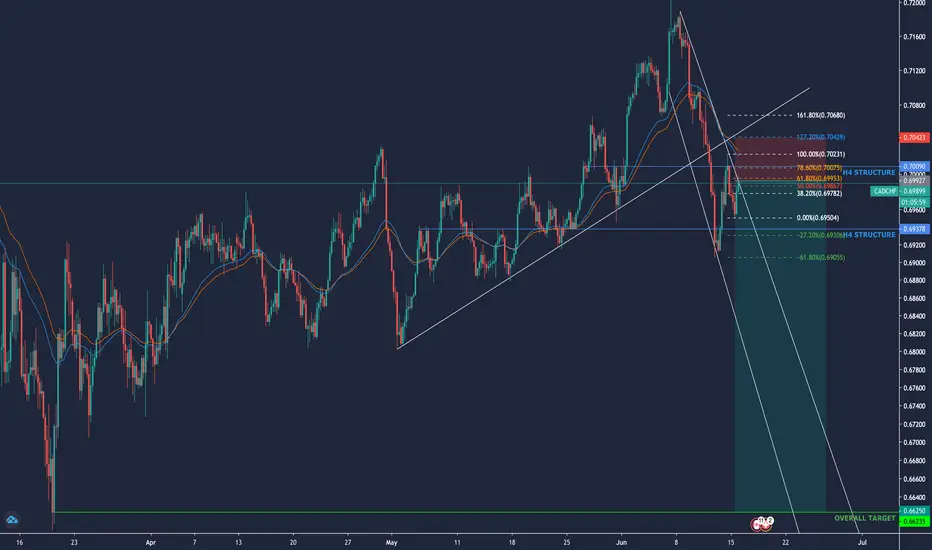
HUGE 371pip short on CADCHFToday I entered a huge huge 371pip short on CADCHF - with the reward risk ratio of 7.41.
I'm looking for a break of the marked 4H structure and for it to retest and continue down to the desired target of 0.66215. I know a lot of people will say this is ambitious, and I agree - but I from an analysis that I'm following and have checked out. I feel that this is a great opportunity for a longterm short.
Something I'll be keeping in mind would be the news coming from Canada on Wednesday - especially the CPI report which will certainly have some High Impact on the Pair.
Please let me know your guys thoughts!
*Please note this is my own personal analysis, and I strongly recommend that you carry out your own analysis before executing a trade. Please do not take this analysis as gospel.*
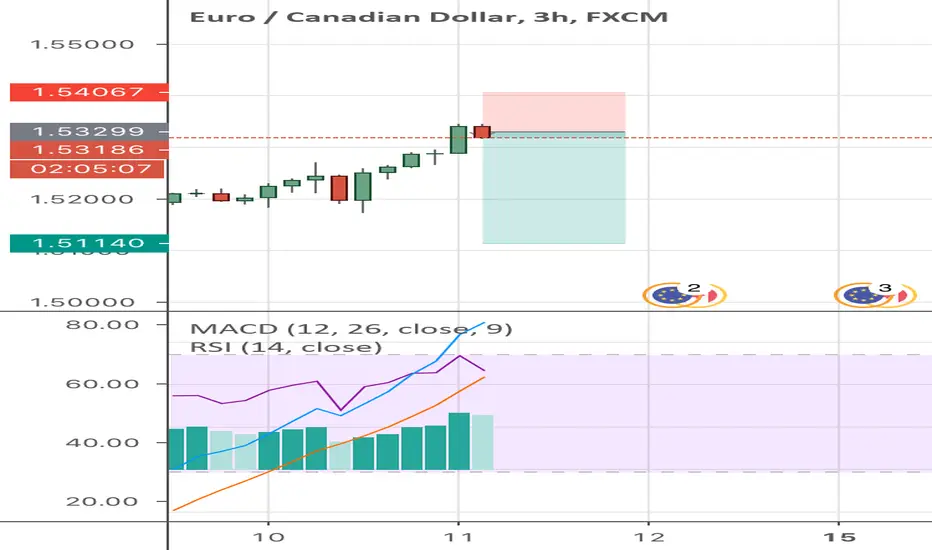
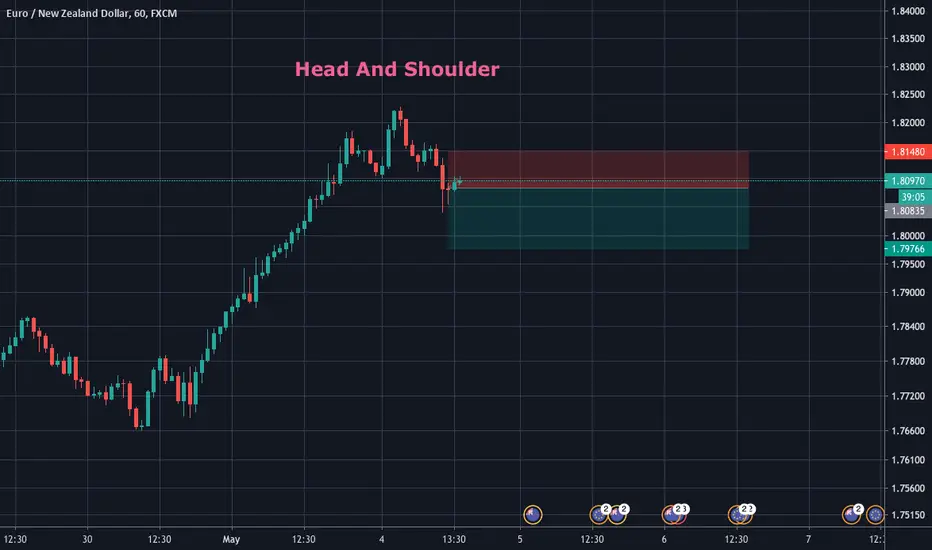
EURCADHello, hope you’re staying safe 😷 wherever in the world you may be 🌎 EURCAD is being overbought, this creating a sell 📉 opportunity for us this morning ☀️ Eastern Time ⏰ (Toronto). TP is 1.51 on this one, tap in ✅
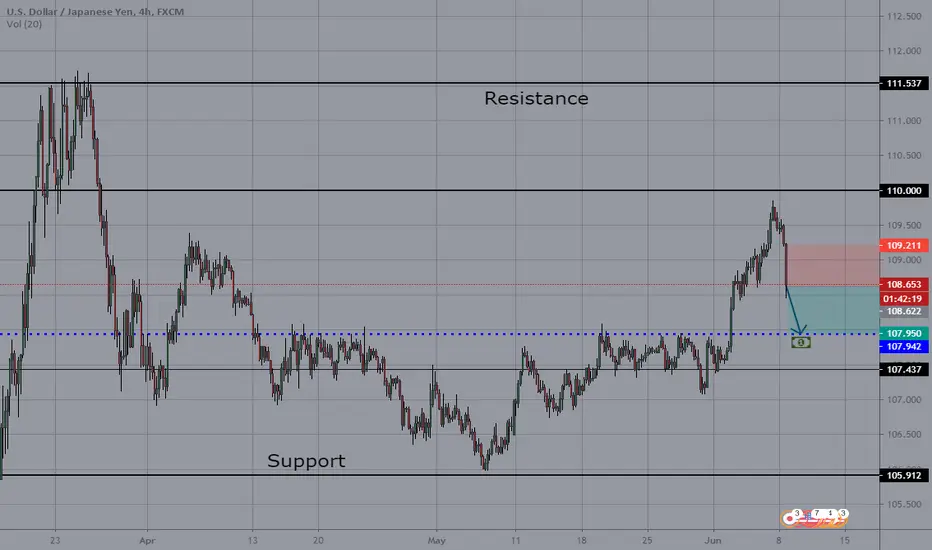
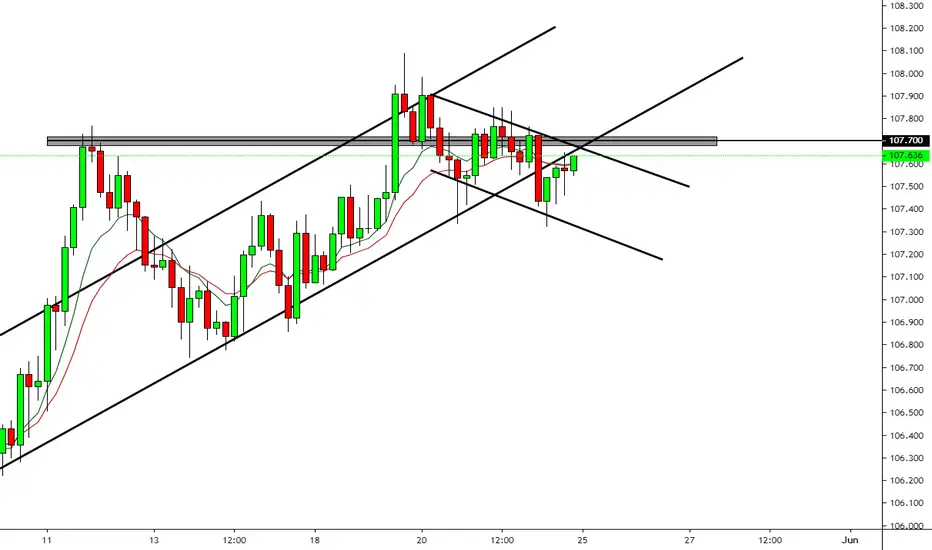
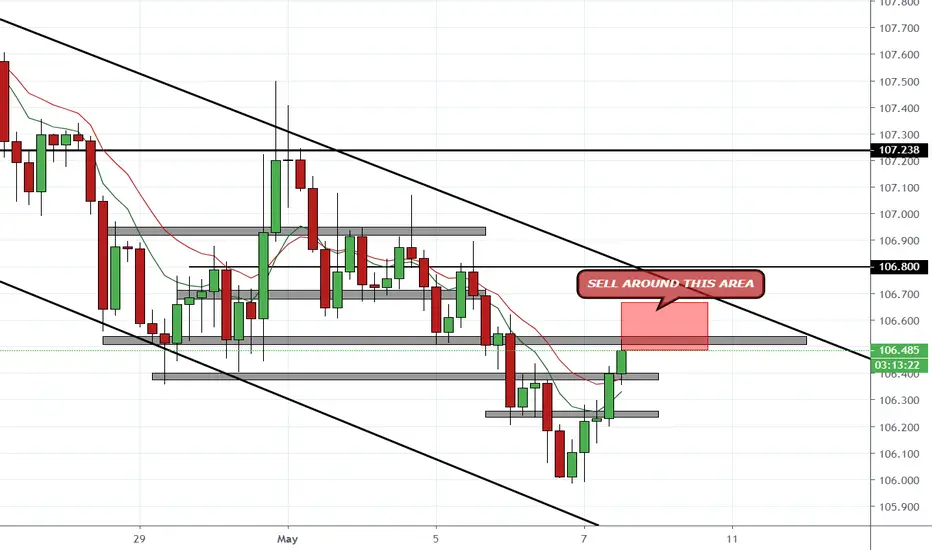
USD|JPYHello, everyone. Thanks for reading.
You can sell, risk reward is good.
Thanks for reading
Dont foreget to leave a like if you liked my idea

USOIL SHORTI'm expecting a decent price action in this area and the pair will likely go for short. Let's see how the price reacts here and then booooom!

NZDUSDHello everyone...
NZDUSD presents a SELL opportunity at the resistance level... I think let's monitor how the daily candle closes...
Anyone with a different idea, guys? Please comment below... Cheers!

OPORTUNIDAD DE VENTA EN USDJPYCONFLUENCIAS:
1. tendencias bajista, tomar una posición corta a favor de la tendencia, es mas recomendable.
2. Trazo diagonal que confirma la tendencia.
3. Claros niveles de resistencia en la bajada.
4. El precio podría encontrar antiguos niveles de soporte.
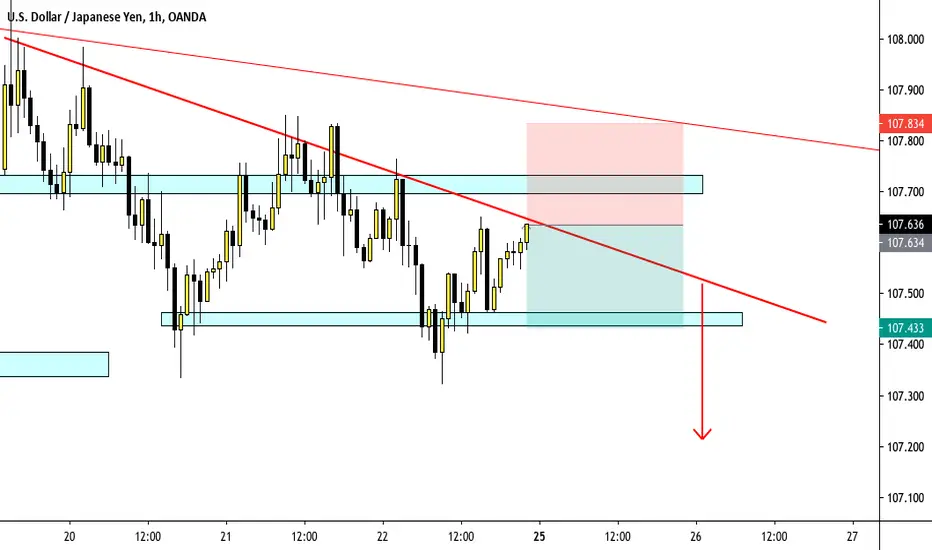
USDJPY SHORT POSITION Potential short position for USDJPY. Don't trade more than you can lose. Nothing is 100% sure in Forex.
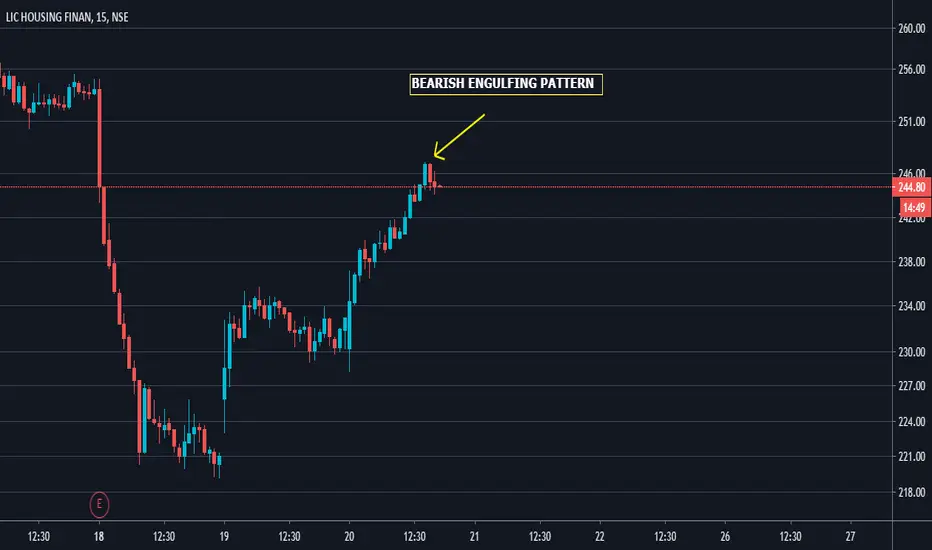
LICHSGFIN BEARISH ENGULFING PATTERN SL 248 TARGET 238LICHSGFIN BEARISH ENGULFING PATTERN SL 248 TARGET 238
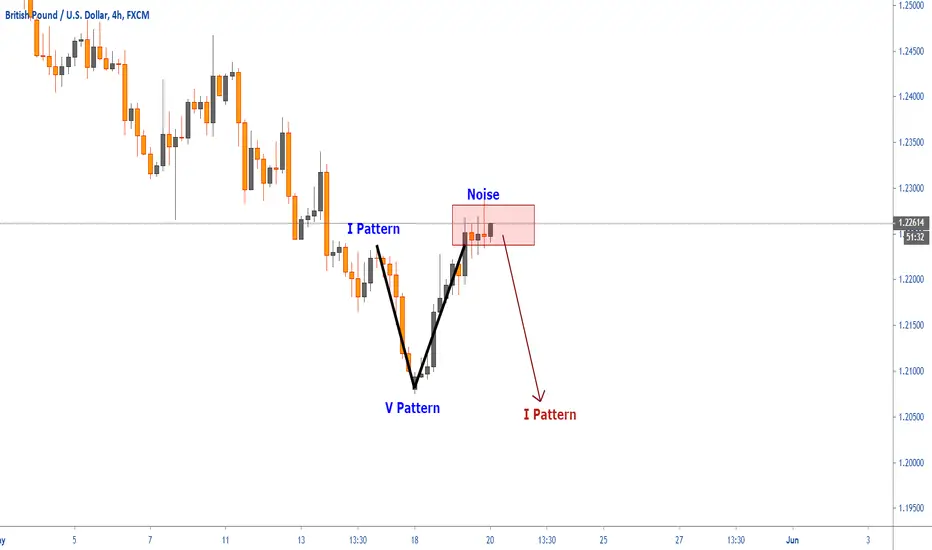
GBPUSDGBPUSD / 4H
------------------------------
As you can see in the chart , we have a I pattern and V pattern
I think that's what might happen , after a while noise we will have a I pattern the size of the input
USDJPY SHORT POSITION Potential short position for USDJPY . Don't trade more than you can lose. Nothing is 100% sure in Forex.
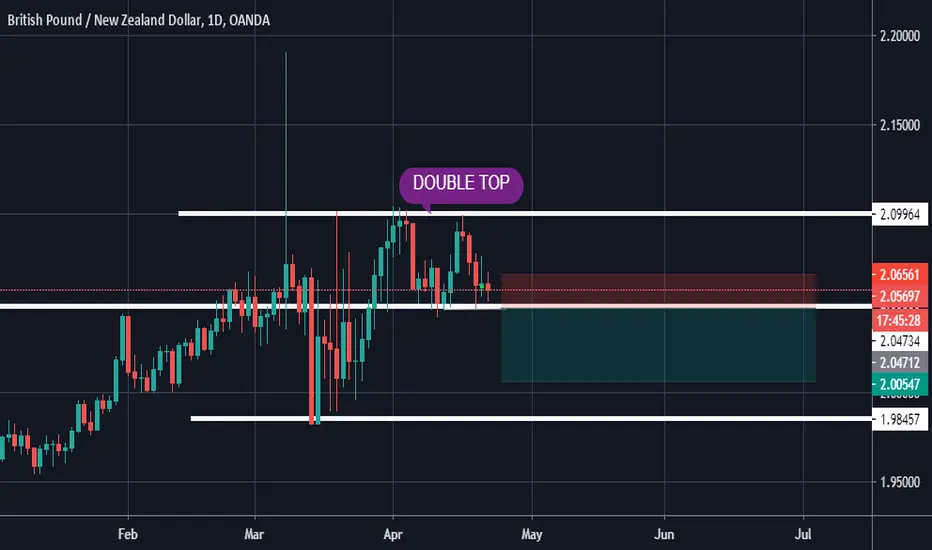
GBPNZD DOUBLETOPWe got a double top pattern, I will wait the break of the neckline for a confirmation then take my short position.