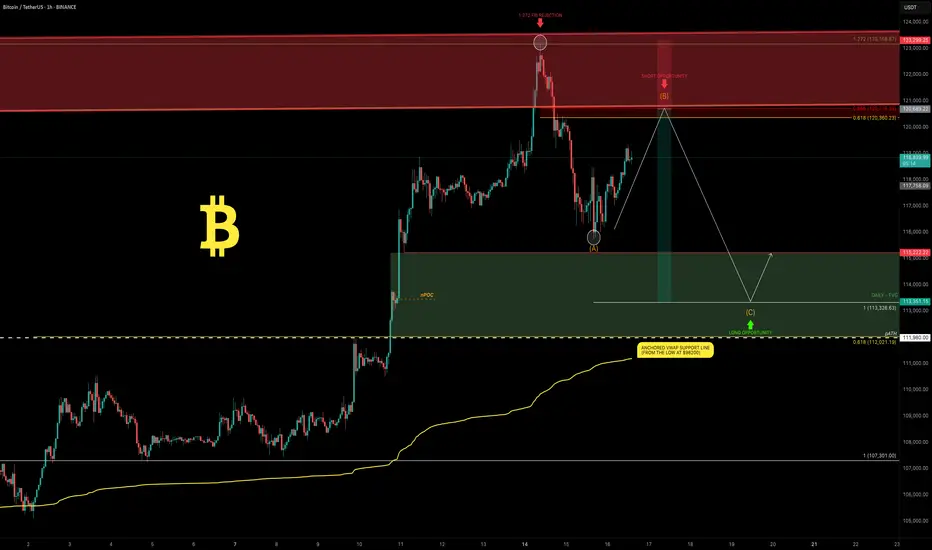
Bitcoin: New All-Time High — What’s Next?Bitcoin had an incredible run, breaking the old all-time high ($111,980) with strong bullish momentum and setting a fresh ATH at $123,218 (Binance). We just witnessed the first major corrective move of ~6% and a decent bounce so far — but the big question is:
What’s next? Will Bitcoin break higher over the summer or form a trading range here?
Let’s dive into the technicals.
🧩 Higher Timeframe Structure
May–June Range:
BTC was stuck between $110K–$100K, forming an ABC corrective pattern. Using trend-based Fib extension (TBFE) from A–B–C:
✅ C wave completed at $98,922 (1.0 TBFE)
✅ Upside target hit at $122,137 (-1 TBFE)
Full Bull Market TBFE:
➡️ 1.0 → $107,301 → previously rejected
➡️ 1.272 → $123,158 → recent rejection zone
Pitchfork (log scale):
➡️ Tapped the upper resistance edge before rejecting.
Previous Bear Market Fib Extension:
➡️ 2.0 extension at $122,524 hit.
2018–2022 Cycle TBFE:
➡️ 1.618 at $122,011 tapped.
Macro Fibonacci Channel:
➡️ Connecting 2018 low ($3,782), 2021 ATH ($69K), 2022 low ($15,476) →
1.618–1.666 resistance band: $121K–$123.5K.
✅ Conclusion: Multiple fib confluences mark the $122K–$123K zone as critical resistance.
Daily Timeframe
➡️ FVG / Imbalance:
Big daily Fair Value Gap between the prior ATH and $115,222 swing low.
BTC broke the prior ATH (pATH) without retest → a pullback to this zone is likely.
Lower Timeframe / Short-Term Outlook
We likely saw a completed 5-wave impulse up → now correcting.
The -6% move was probably wave A, current bounce = wave B, next leg = wave C.
➡ Wave B short zone: $120K–$121K
➡ Wave C target (1.0 TBFE projection): ~$113,326
➡ Confluence at mid-FVG + nPOC
Trade Setups
🔴 Short Setup:
Entry: $120,300–$121,000
Stop: Above current ATH (~$123,300)
Target: $113,500
R:R ≈ 1:2.3
🟢 Long Setup:
Entry: Between Prior ATH and $113,000
Stop: Below anchored VWAP (~$110,500)
Target: Higher, depending on bounce confirmation.
🧠 Educational Insight: Why Fibs Matter at Market Extremes
When markets push into new all-time highs, most classic support/resistance levels disappear — there’s simply no historical price action to lean on. That’s where Fibonacci extensions, channels, and projections become powerful tools.
Here’s why:
➡ Fibonacci extensions (like the 1.272, 1.618, 2.0) help estimate where trend exhaustion or profit-taking zones may appear. They are based on the psychology of crowd behavior, as traders anchor expectations to proportional moves from previous swings.
➡ Trend-Based Fib Extensions (TBFE) project potential reversal or continuation zones using not just price levels, but also the symmetry of prior wave moves.
➡ Fibonacci channels align trend angles across multiple market cycles, giving macro context — like how the 2018 low, 2021 ATH, and 2022 low project the current 1.618–1.666 resistance zone.
In short:
When you don’t have left-hand price history, you lean on right-hand geometry.
That’s why the $122K–123K zone wasn’t just random — it’s a convergence of multiple fib levels, cycle projections, and technical structures across timeframes.
⚡ Final Thoughts
Bitcoin faces major resistance around $122K–$123K backed by multiple fib and structural levels. A retest of the prior ATH zone (~$112K–$113K) looks probable before the next big directional move. Watch lower timeframe structure for signs of completion in this corrective phase.
_________________________________
💬 If you found this helpful, drop a like and comment!
Want breakdowns of other charts? Leave your requests below.
Shortsetup
NF news, can gold selling pressure drop to 3240?⭐️GOLDEN INFORMATION:
Gold (XAU/USD) is trading lower, around $3,285 in early Asian hours on Friday, as a firmer U.S. dollar weighs on the non-yielding metal following new tariff measures announced by President Donald Trump.
The White House said late Thursday that Trump will set a 10% baseline tariff, stepping back from earlier speculation about hikes to 15% or higher, according to Bloomberg. He also signed an executive order raising the tariff on Canada from 25% to 35%, effective August 1, 2025, while extending Mexico’s current tariff rates for another 90 days to allow more time for negotiations.
⭐️Personal comments NOVA:
large frame, gold price is still moving in the downtrend line. will wait for NF result to have strong selling force again 3240
⭐️SET UP GOLD PRICE:
🔥SELL GOLD zone: 3374- 3376 SL 3381
TP1: $3365
TP2: $3350
TP3: $3333
🔥BUY GOLD zone: $3242-$3240 SL $3235
TP1: $3255
TP2: $3268
TP3: $3280
⭐️Technical analysis:
Based on technical indicators EMA 34, EMA89 and support resistance areas to set up a reasonable SELL order.
⭐️NOTE:
Note: Nova wishes traders to manage their capital well
- take the number of lots that match your capital
- Takeprofit equal to 4-6% of capital account
- Stoplose equal to 2-3% of capital account
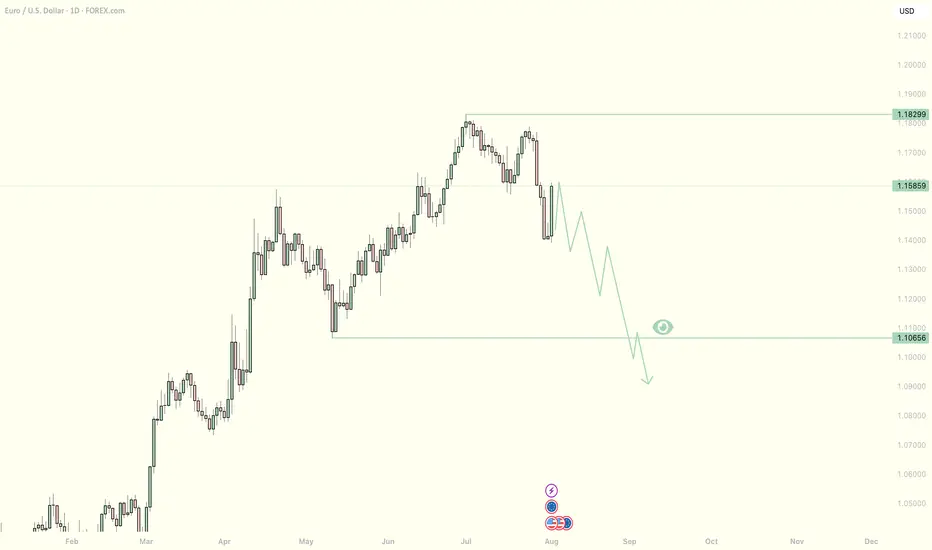
EURUSD Down Trend As dxy is bullish Eurusd will be bearish. I need price to go to my eyeing level in the next couple weeks. we wait and see what price we want to do next week, Wednesday.
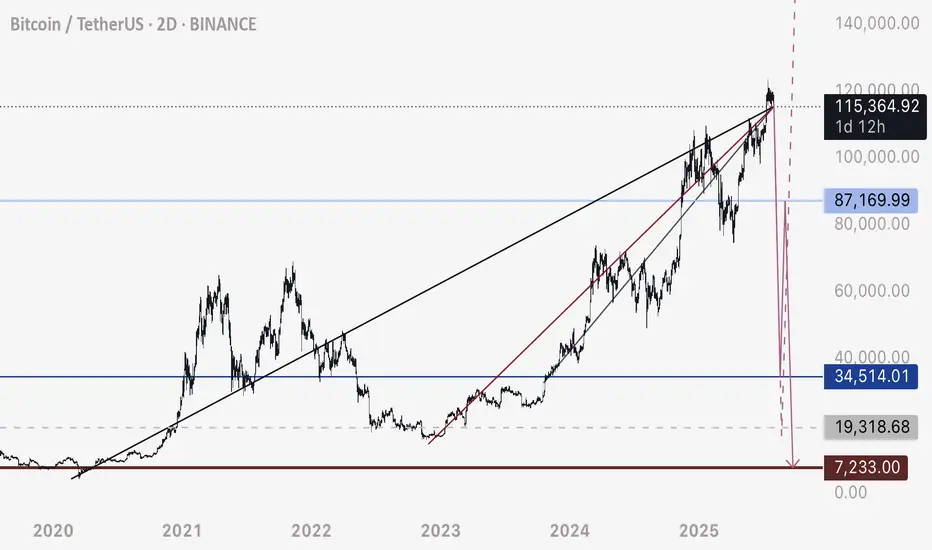
BTC - Not the End of the DropRather the beginning. Bitcoin has fallen below this bearish intersection. Anticipating price to fall rapidly on one of these two pathways to the Uber low liquidity levels.
DXY is retesting a major bearish breakdown - this is the conduit that will justify a flash crash of this magnitude prior to a 3-5 year bull run.
Happy trading.
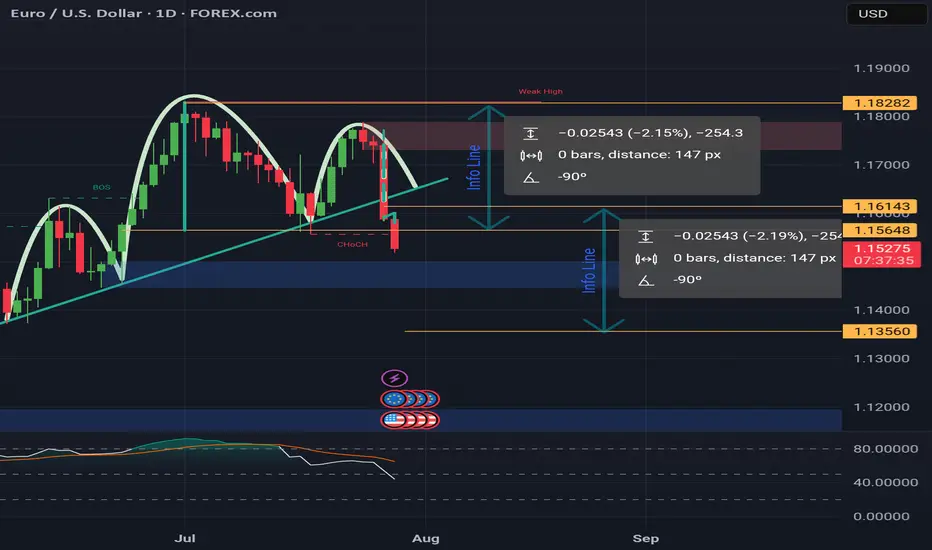
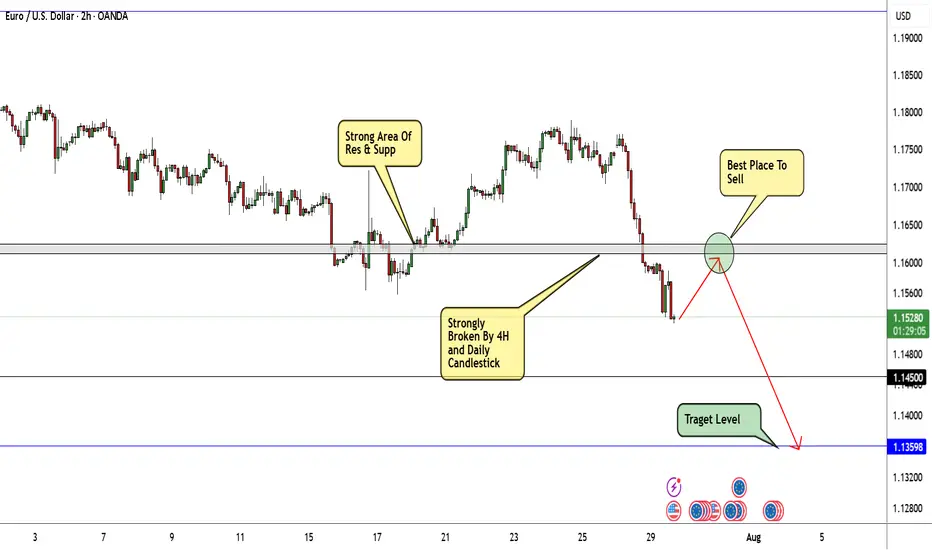
Head & Shoulders on EUR/USD daily!We're currently observing a significant Head & Shoulders pattern forming on the EUR/USD daily chart, with the price just breaking below the neckline on the right shoulder.
Applying standard Head & Shoulders trading principles, we measure the distance from the head's peak to the neckline and project that same range downward from the breakdown point. Based on this, the estimated target price (TP) for the trade lands around $1.135. The stop-loss will be positioned just above the right shoulder to manage risk effectively.
We'll be watching closely to see how this setup unfolds. 🍻
New targets for Reddit RDDT In this video I recap the previous reddit analysis where we looked for the long which is playing out really well .
I also look at the current price action and simulate what I think could be a target for the stock moving forward using Fib expansion tools as well as levels below for price to draw back too.
Welcome any questions below the chart . Thanks for viewing

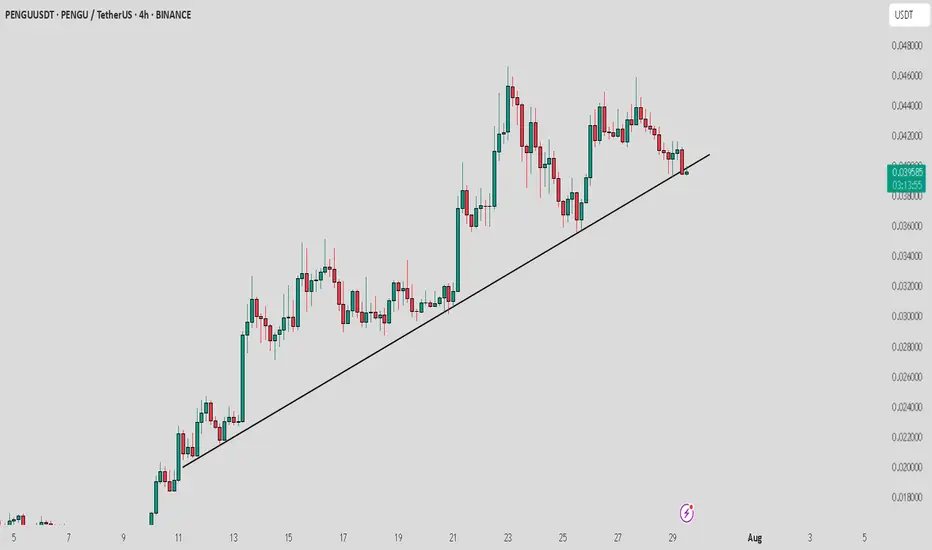
PENGU / USDT : Breaking down from Trendline supportPENGU/USDT is breaking down from the trend line support, but the retest is still in progress. Watch for rejection at key levels.
Pro Tip: Wait for confirmation of rejection before entering the trade and always apply proper risk management to safeguard your position.
Bearish Retest Setup After BreakdownPrice broke down from the recent bounce and lost the 0.098–0.101 zone, which lined up with the 23.6–38.2 fibs. That area is now likely to act as resistance. Momentum is still bearish. MACD histogram is red and expanding, and no signs of reversal yet. On the daily timeframe, MACD has just started to cross bearish, which adds weight to the downside bias.
If price retests that 0.098–0.101 area and shows weakness (like rejection wicks or small-bodied candles), it’s a clean short opportunity. First target would be the recent low around 0.092, and if that breaks, the next key level is 0.077.
Any push above 0.102 would invalidate the setup for me.

AUDCHF: Broken Support, Bearish Flow In Play Timeframe: 1H
Bias: Bearish
Type: Support Turncoat → Breakdown Play
📊 Technical Setup
AUDCHF previously broke the 4H resistance (0.5236) which flipped to support. However, price has now broken below this support, confirming it as a failed demand zone.
• Entry: Market execution or retest of 0.5236
• SL: Above 0.5245
• TP: 0.5189
• RR: ~1:2
• RSI: Below 50 and heading lower = momentum supports downside
📉 Macro & Fundamental Confluence
• AUD Weakness: RBA dovish, conditional score declining, bearish seasonality
• CHF Slightly Less Weak: Despite SNB dovish stance, CHF is outperforming AUD
• COT + Sentiment: AUD CFTC weakening, CHF holding steady
• Risk Sentiment: RISK ON environment reduces CHF demand but AUD still underperforms
🧭 Gameplan
“Support failed to hold. Bearish pressure intensifies. Target previous swing low zone.”
🔔 Watch for retest of 0.5236 for better RR setup before continuing short.

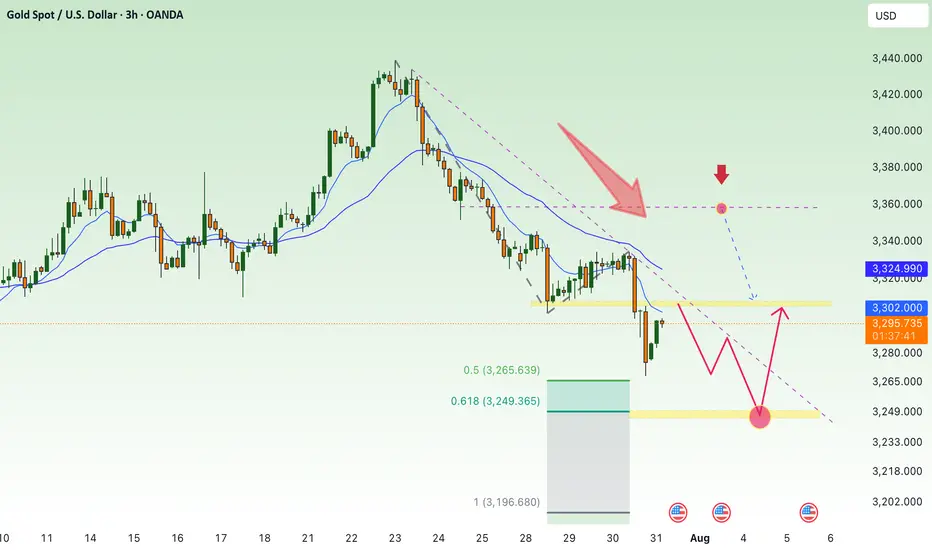
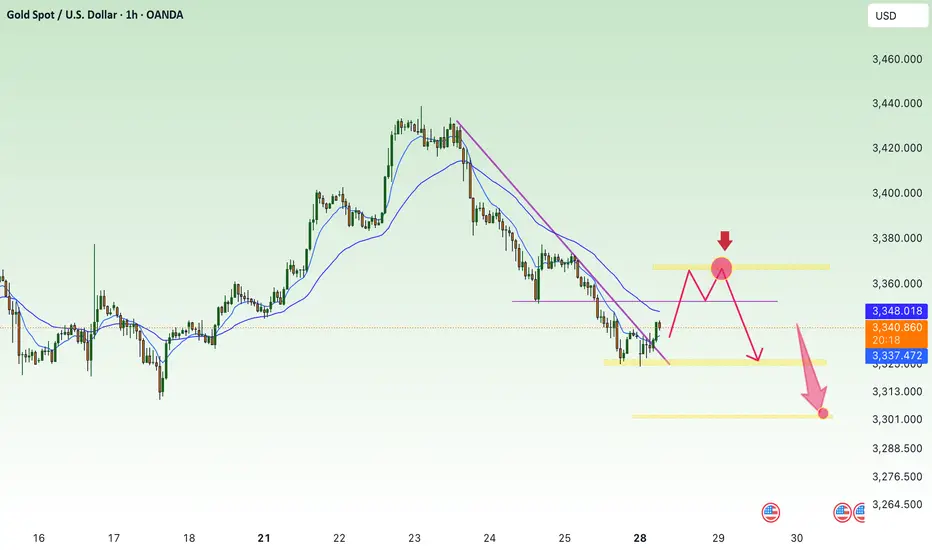
downtrend below 3300 , after ADP-NF⭐️GOLDEN INFORMATION:
The Federal Reserve’s policy statement noted that economic activity has slowed in the first half of the year, although the unemployment rate remains low and inflation is still “somewhat elevated.” The Fed reaffirmed its commitment to achieving maximum employment and returning inflation to its 2% target, while also acknowledging that “uncertainty around the economic outlook remains elevated.”
Earlier data showed that U.S. GDP grew in the second quarter, but underlying details painted a softer picture. Consumer spending cooled, and business investment declined significantly. According to Reuters, most economists now forecast full-year GDP growth at 1.5%, below the Fed’s 1.8% projection.
⭐️Personal comments NOVA:
Gold prices reacted negatively as the FED kept interest rates unchanged and Chairman POWELL's hawkish stance. Selling pressure below 3300 is being maintained.
⭐️SET UP GOLD PRICE:
🔥SELL GOLD zone: 3360- 3362 SL 3367
TP1: $3350
TP2: $3340
TP3: $3330
🔥BUY GOLD zone: $3249-$3247 SL $3242
TP1: $3258
TP2: $3270
TP3: $3285
⭐️Technical analysis:
Based on technical indicators EMA 34, EMA89 and support resistance areas to set up a reasonable SELL order.
⭐️NOTE:
Note: Nova wishes traders to manage their capital well
- take the number of lots that match your capital
- Takeprofit equal to 4-6% of capital account
- Stoplose equal to 2-3% of capital account
#PENGUUSDT confirms a bearish impulse📉 SHORT BYBIT:PENGUUSDT.P from $0.034625
⚡ Stop loss $0.035646
🕒 Timeframe: 4H
⚡ Overview:
➡️ A Double Top pattern BYBIT:PENGUUSDT.P has formed, signaling a bearish reversal.
➡️ The price broke the $0.0355 support and is consolidating below, confirming seller strength.
➡️ Increasing sell volume confirms bearish control.
➡️ Main focus on targets in the $0.034–0.033 zone.
➡️ The POC at $0.03113 remains the ultimate bearish objective.
🎯 TP Targets:
💎 TP 1: $0.033947
💎 TP 2: $0.033369
💎 TP 3: $0.032948
BYBIT:PENGUUSDT.P Trade Recommendations:
📢 Hold short towards the TP zones.
📢 Watch for reaction around $0.0339 — partial profit-taking possible.
📢 Invalidation if price reclaims above $0.0356.
⚠️ As long as bearish pressure holds, the price is likely to continue towards TP2–TP3.
⚠️ A recovery above $0.0356 would invalidate this setup.
🚀 The signal confirms a bearish impulse — expecting further downside!

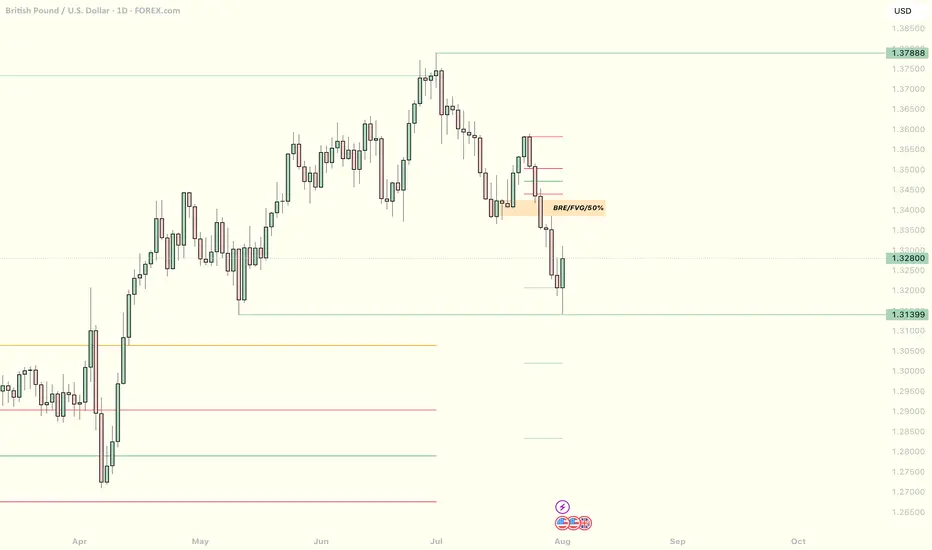
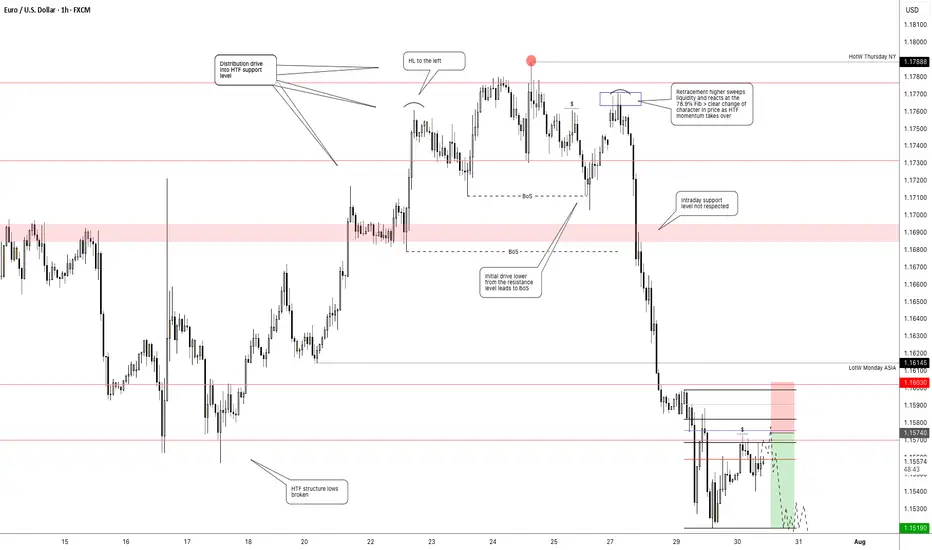
Getting short on EUR/USD!The dollar has looked set for a reversal and coming into the week it didn't hang around at all. I had a bit of a short bias on EUR/USD and was looking for confirmation signal which pretty much came at market open.
Price pushed higher back into the key level taking out a short term high, but was unable to follow through to form a new higher high. Heading into Monday London session, momentum immediately took hold with a clear bearish change of character and price didn't look back > breaking structure and key levels with minimal effort.
I was waiting for a pull back to get short early which didn't occur. But no need to chase price, waiting and patience is part of the game.
Price has now broken another key support level and is set to retest it as resistance. This will be my entry point (see screenshot) > using the 70.5%-78.6% fib retracement level and my stop above Tuesdays high. Keep it simple.
tradingview.sweetlogin.com/proxy-s3
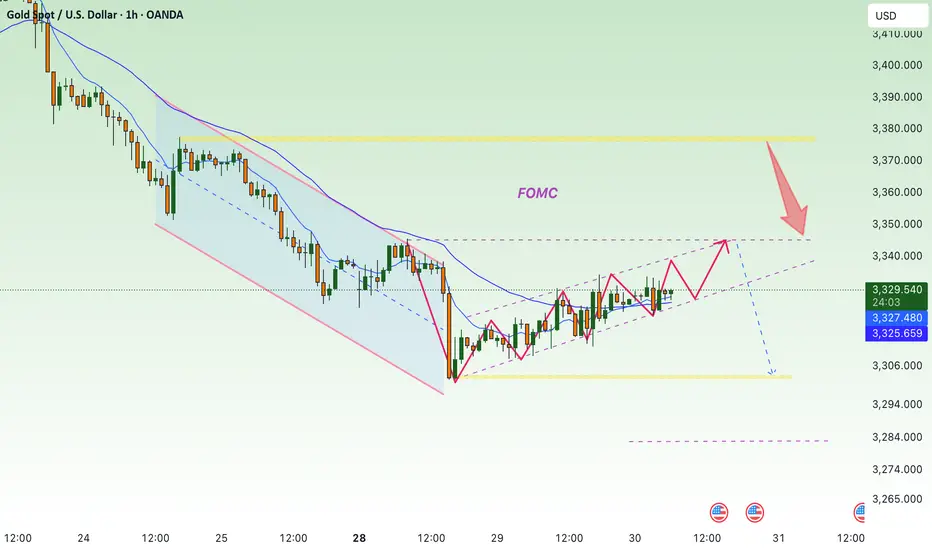
Is the market panicking over FOMC today?⭐️GOLDEN INFORMATION:
Gold (XAU/USD) fluctuates within a narrow range during the Asian session on Wednesday, showing only modest gains and losses as traders tread carefully ahead of the Federal Reserve’s policy announcement. The metal’s recent rebound from the $3,300 area faces hesitation, with investors awaiting clearer signals on the Fed’s rate-cut trajectory before committing to new positions. As such, attention remains firmly on the outcome of the two-day FOMC meeting, set to be released later today.
In the meantime, pre-Fed uncertainty is lending some support to the safe-haven appeal of gold. Additionally, a slight pullback in the U.S. Dollar—after hitting its highest level since June 23 on Tuesday—is providing a mild lift to the metal. However, expectations that the Fed will maintain elevated interest rates for an extended period are limiting the dollar’s decline and capping upside potential for the non-yielding yellow metal. Adding to the cautious mood, recent optimism on global trade also tempers bullish momentum in XAU/USD.
⭐️Personal comments NOVA:
slight recovery, not big before FOMC news. Gold price will still be under selling pressure when interest rate stays at 3300
⭐️SET UP GOLD PRICE:
🔥SELL GOLD zone: 3373- 3375 SL 3380
TP1: $3360
TP2: $3344
TP3: $3330
🔥BUY GOLD zone: $3283-$3281 SL $3276
TP1: $3295
TP2: $3307
TP3: $3320
⭐️Technical analysis:
Based on technical indicators EMA 34, EMA89 and support resistance areas to set up a reasonable SELL order.
⭐️NOTE:
Note: Nova wishes traders to manage their capital well
- take the number of lots that match your capital
- Takeprofit equal to 4-6% of capital account
- Stoplose equal to 2-3% of capital account
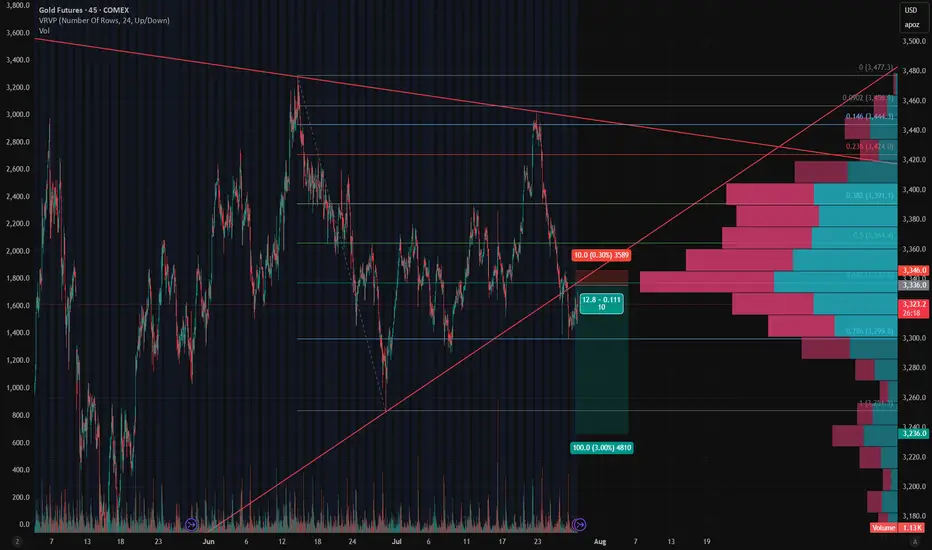
Gold - Short Setup Off Major Trendline Rejection📉 Gold - Short Setup Off Major Trendline Rejection
Gold has broken down through the rising trendline and is now retesting it — the moment of truth! 🧐
🔻 Short Entry: 3,336
🎯 Target: 3,236 (Fib 1.0 + HVN gap fill)
🛑 Stop: 3,346 (Above trendline retest)
⚖️ Risk/Reward: ~1:10
📊 Bonus: High volume node above adds resistance. Bearish volume profile structure confirms the breakdown bias.
Watching for volume to pick up on the move down. Let's see if GC bleeds into August. 🩸📆
EUR/USD Will Continue Melting Be Sure To Be Part Of That!Here is my thought of EURUSD chart today. I think that this pair can go down further more specially after breaking this strong area of support and old resistance. as shown on the chart we can wait for the price to come back again and retest this area once and then this will be the best place to enter a sell trade. I am targeting around 250n pips in this trade. as I said I will wait for a retest and a good bearish price action and from there I will enter a sell trade.
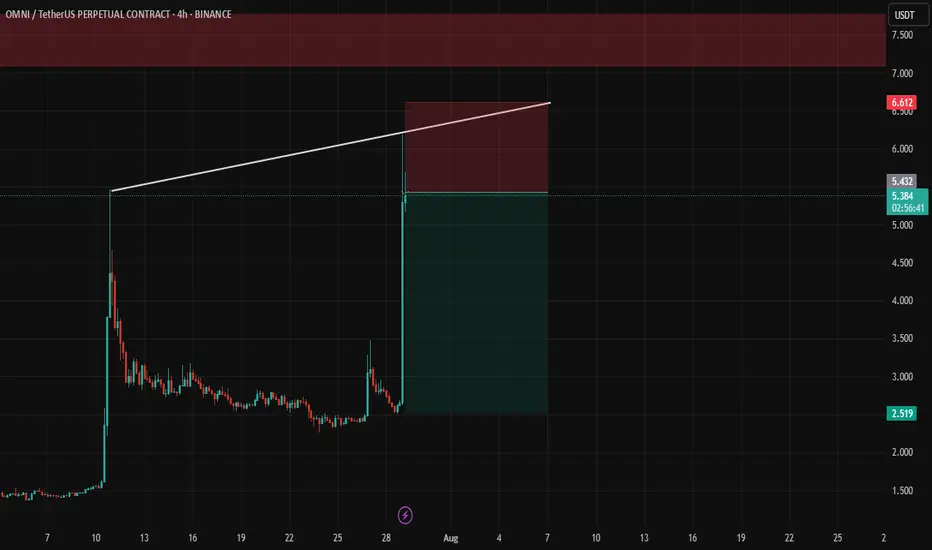
OMNI ShortShort Bias Active Now — but only with strict stop-loss near $6.35.
📌 Short Entry: $5.30–5.60
📌 Stop-Loss: $6.35
📌 Targets:
TP1: $4.60
TP2: $4.00
TP3: $3.50
maintain selling pressure around 3300, GOLD ⭐️GOLDEN INFORMATION:
Gold prices extended their slide for a fourth straight session, falling over 0.60%, as the U.S. and European Union reached a weekend trade agreement that halved proposed tariffs on EU goods—from 30% to 15%. XAU/USD is currently trading around $3,312, after earlier touching a high of $3,345.
The trade breakthrough lifted market sentiment, boosting risk appetite. Meanwhile, the U.S. Dollar is regaining strength, with the Dollar Index (DXY)—which measures the greenback against a basket of six major currencies—rising 0.99% to 98.64.
⭐️Personal comments NOVA:
Gold price maintains selling pressure around 3300, continuing the downtrend
⭐️SET UP GOLD PRICE:
🔥SELL GOLD zone: 3353- 3355 SL 3360
TP1: $3345
TP2: $3332
TP3: $3317
🔥BUY GOLD zone: $3287-$3285 SL $3280
TP1: $3295
TP2: $3307
TP3: $3320
⭐️Technical analysis:
Based on technical indicators EMA 34, EMA89 and support resistance areas to set up a reasonable SELL order.
⭐️NOTE:
Note: Nova wishes traders to manage their capital well
- take the number of lots that match your capital
- Takeprofit equal to 4-6% of capital account
- Stoplose equal to 2-3% of capital account
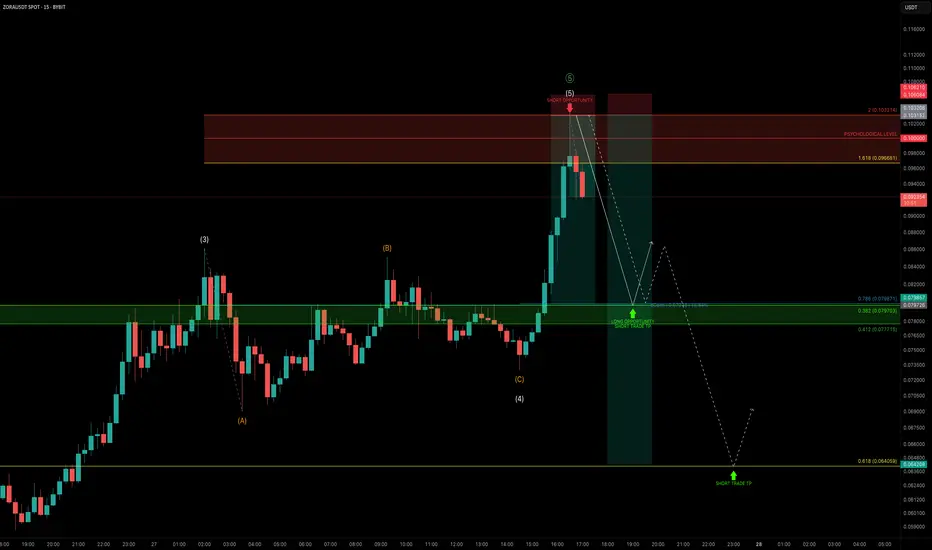
ZORA — Parabolic Rally Nearing ExhaustionZORA has been on an explosive run, pumping +1239% in just 20 days. But after such a vertical move, the question is:
Is this rally nearing exhaustion?
Let’s dive into the technicals 👇
🧩 Elliott Wave Structure
Looking at price action through the lens of Elliott Wave Theory, ZORA appears to be completing its 5th wave:
➡️ Wave 3–4 zone: Held around the $0.05 trading range
➡️ Wave 5: Now pushing into the $0.097–$0.103 zone
This area aligns with:
The 1.618–2.0 Fib extension pocket — a typical exhaustion zone for wave 5s
The $0.10 psychological level
🔴 Short Trade Setup
This zone between $0.097–$0.103 is the ideal reversal area to consider shorting, with clearly defined targets and confluence:
Entry: $0.097 – $0.103
Stop-Loss: Above the 2.0 Fib Extension
TP1: Around $0.08
TP2: Around $0.064
Confluence: TP1
Daily Open (dOpen)
0.786 Fib of the local move
0.382 Fib of the 5-wave structure
TP2 (Lower Target):
0.618 Fib retracement of the 5-wave move at $0.064
Risk-to-Reward:
TP1 gives an R:R of 1:8
TP2 offers potential 1:13+
Watch for signs of weakness.
_________________________________
💬 If you found this helpful, drop a like and comment!
Want breakdowns of other charts? Leave your requests below.
EURJPY – DAILY FORECAST Q3 | W31 | D28 | Y25📊 EURJPY – DAILY FORECAST
Q3 | W31 | D28 | Y25
Daily Forecast 🔍📅
Here’s a short diagnosis of the current chart setup 🧠📈
Higher time frame order blocks have been identified — these are our patient points of interest 🎯🧭.
It’s crucial to wait for a confirmed break of structure 🧱✅ before forming a directional bias.
This keeps us disciplined and aligned with what price action is truly telling us.
📈 Risk Management Protocols
🔑 Core principles:
Max 1% risk per trade
Only execute at pre-identified levels
Use alerts, not emotion
Stick to your RR plan — minimum 1:2
🧠 You’re not paid for how many trades you take, you’re paid for how well you manage risk.
🧠 Weekly FRGNT Insight
"Trade what the market gives, not what your ego wants."
Stay mechanical. Stay focused. Let the probabilities work.
OANDA:EURJPY

Get liquidity at the beginning of the week, continue to decrease⭐️GOLDEN INFORMATION:
Gold (XAU/USD) continues to lose ground, slipping to around $3,335 in early Asian trading on Monday. The metal is on its fourth straight day of declines as easing geopolitical tensions and trade progress weaken safe-haven demand. Investors are now turning their focus to the upcoming FOMC policy decision on Wednesday.
Market sentiment has improved following a breakthrough in US–EU trade talks, with both sides agreeing to a uniform 15% tariff on traded goods, effectively ending months of stalemate. The new tariffs will come into effect on August 1. Meanwhile, the US and China are reportedly planning to extend their tariff truce for another three months, according to the South China Morning Post. The renewed risk appetite continues to pressure gold, traditionally favored in times of uncertainty.
⭐️Personal comments NOVA:
Short-term recovery in Asian session, gold price takes liquidity and continues to accumulate below 3369
⭐️SET UP GOLD PRICE:
🔥SELL GOLD zone: 3369- 3371 SL 3376
TP1: $3360
TP2: $3350
TP3: $3340
🔥BUY GOLD zone: $3305-$3303 SL $3298
TP1: $3314
TP2: $3330
TP3: $3342
⭐️Technical analysis:
Based on technical indicators EMA 34, EMA89 and support resistance areas to set up a reasonable SELL order.
⭐️NOTE:
Note: Nova wishes traders to manage their capital well
- take the number of lots that match your capital
- Takeprofit equal to 4-6% of capital account
- Stoplose equal to 2-3% of capital account
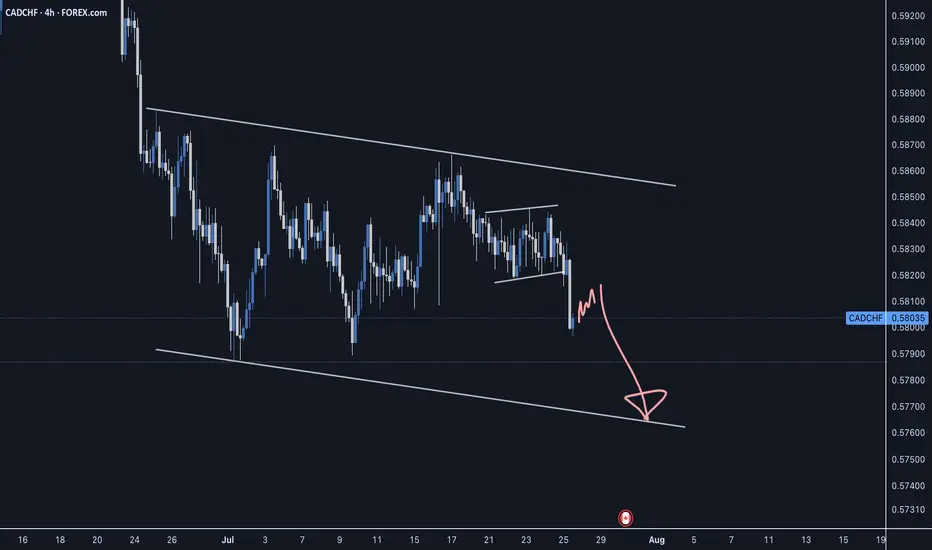
CADCHF - Sellers still in controlCADCHF has been moving within a reversal structure which could make another swing low to complete this pattern before the next move up.
Good Luck
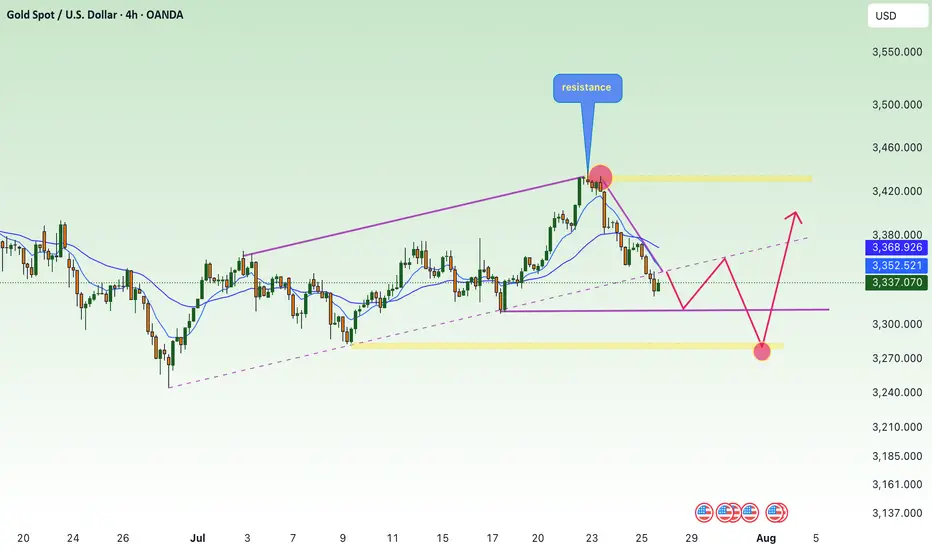
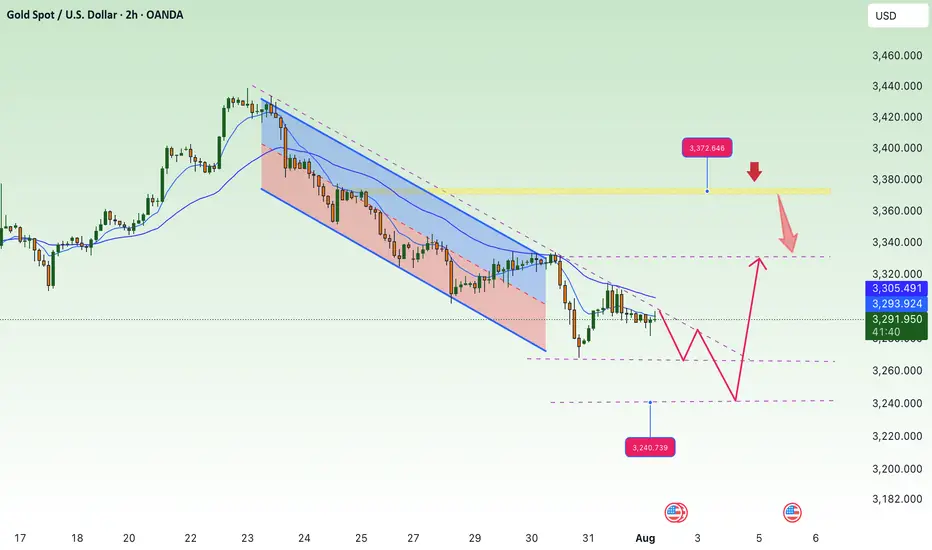
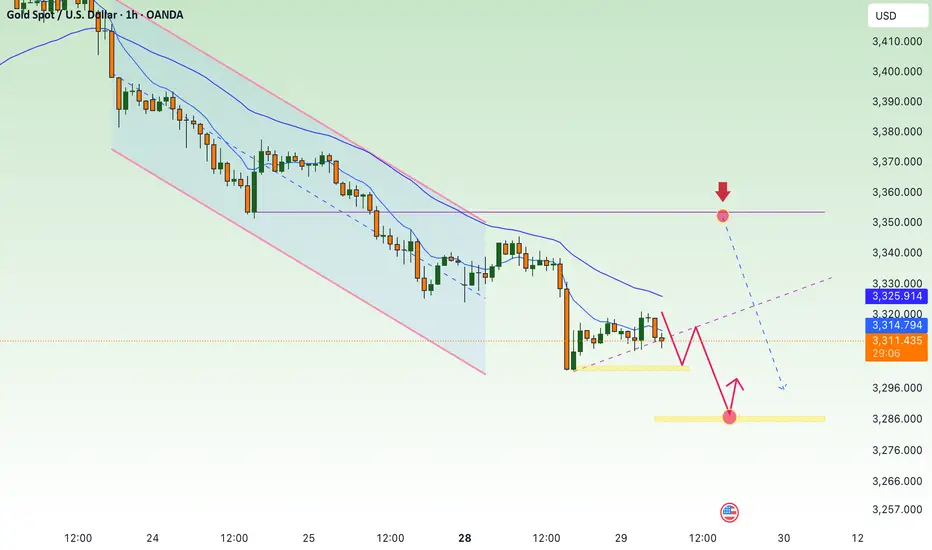
Gold price continues to decrease, keep the rate unchanged✍️ NOVA hello everyone, Let's comment on gold price next week from 07/28/2025 - 08/1/2025
⭐️GOLDEN INFORMATION:
Gold (XAU/USD) looks set to close the week lower, pressured by upbeat U.S. economic data and progress in trade negotiations, which have reduced demand for safe-haven assets. Despite declining U.S. Treasury yields, the U.S. Dollar regained some ground. At the time of writing, XAU/USD is trading around $3,336, down nearly 1%.
Looking ahead, the Federal Reserve is widely expected to keep interest rates steady at 4.25%–4.50% for the fifth time this year. Recent data supports this stance, with Initial Jobless Claims falling for the fourth straight week—signaling a resilient labor market—while Friday’s sharp drop in Durable Goods Orders, driven by weaker aircraft demand, adds a mixed tone to the outlook.
⭐️Personal comments NOVA:
Gold prices continue to fall as interest rates remain unchanged almost this week. Along with the H4 time frame, prices continue to break important support and continue to follow a downward trend.
🔥 Technically:
Based on the resistance and support areas of the gold price according to the H4 frame, NOVA identifies the important key areas as follows:
Resistance: $3350, $3428
Support: $3312, $3280, $3246
🔥 NOTE:
Note: Nova wishes traders to manage their capital well
- take the number of lots that match your capital
- Takeprofit equal to 4-6% of capital account
- Stoplose equal to 2-3% of capital account
- The winner is the one who sticks with the market the longest