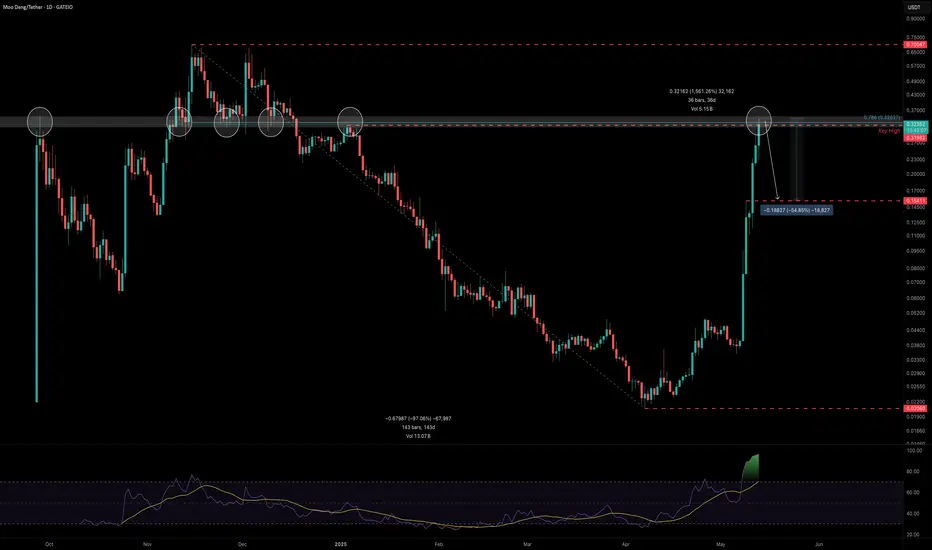
MOODENG Up 1561% — Is a 50% Crash Next?MOODENG has gone full parabolic — launching from $0.0206 to $0.34 in just 36 days. That’s a staggering +1561% gain. But after a move this vertical, it’s time to ask the real question: can it sustain this pace… or is a correction looming?
Let’s break it down.
Technical Snapshot
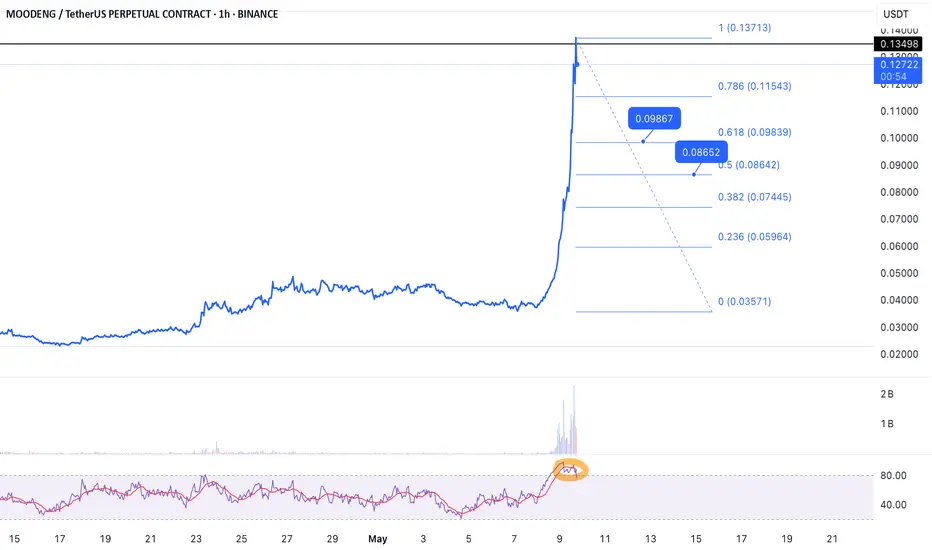
MOODENG just tapped a major resistance zone — the 0.786 Fibonacci retracement (log scale) of the entire bear trend from $0.70 down to $0.0206. That drawdown was a brutal -97% over 143 days, defining the last macro bear cycle. The current rally has now retraced almost 80% of that decline.
And now? It’s knocking on exhaustion’s door.
RSI Screaming Hot
The RSI on the daily chart is currently at 96 — a level rarely sustained for long. Historically, these readings lead to sharp corrections as early bulls take profit and late buyers get trapped.
Key Structure:
The key swing high at $0.31982 was just taken out, possibly as a liquidity grab.
Price is now hovering at this level — hovering… or topping?
Potential Retracement Zone
If MOODENG enters a standard corrective phase, the $0.15411 level stands out. — it lines up as a logical 50–61.8% retracement zone from the recent parabolic leg. A return to that level would mean a -50%+ crash from current highs.
Short Trade Idea (On Confirmation Only)
Entry: Break below $0.32 and retest it as resistance
Stop-Loss: Above $0.34 (structure invalidation)
Target: $0.15411 (0.618 Fib retracement)
R:R: 7:1+
This setup requires patience. Don’t front-run it — let price lose $0.32 with conviction and treat a clean retest as your trigger.
📘 Bonus Insight:
Whenever you see extreme RSI paired with major Fib levels (like 0.786), you’re likely looking at the exhaustion phase of a move — especially when paired with psychological price levels and historical resistance. That’s where smart money exits… and emotional money enters.
🧠 Educational Note: Why You Should Be Cautious with Parabolic Moves
These kinds of explosive rallies are exciting, but they’re often unsustainable. When price goes vertical and indicators like RSI hit extreme levels, smart money starts exiting — and emotional money starts chasing.
Parabolic moves often end with sharp, sudden crashes. Chasing these tops may feel tempting, but more often than not, it leads to losses. The real edge comes from waiting — for structure, confirmation, and setups with defined risk. Don’t trade hype. Trade the chart.
Summary
MOODENG up +1561% in just over a month
Tapped the 0.786 Fib of its entire macro downtrend
Daily RSI at 96 → overheated
Break & retest of $0.32 = ideal short setup
Targeting a possible -50% correction to $0.15411
Keep your emotions out of it — parabolic runs like this are exciting, but it’s discipline that gets you paid. Let price confirm. Then strike. 📉🔥
Shortsetup
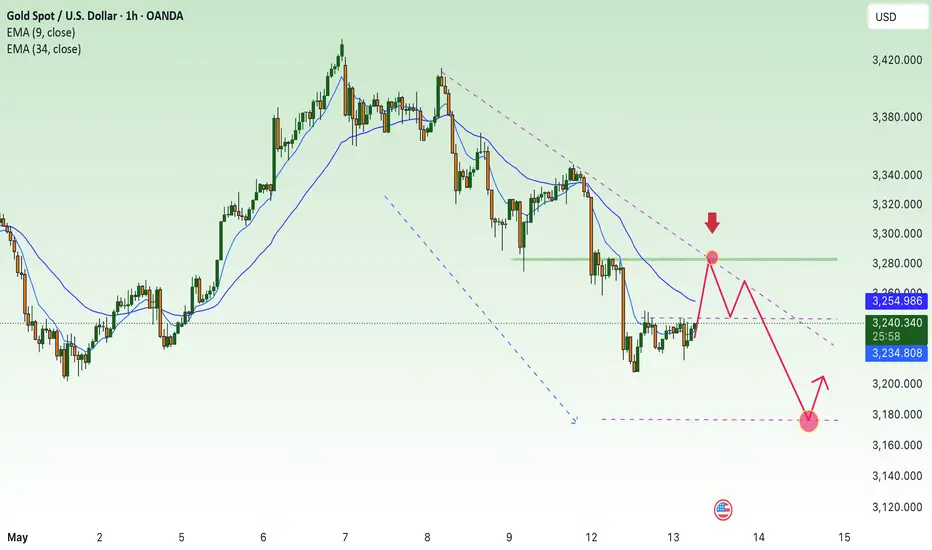
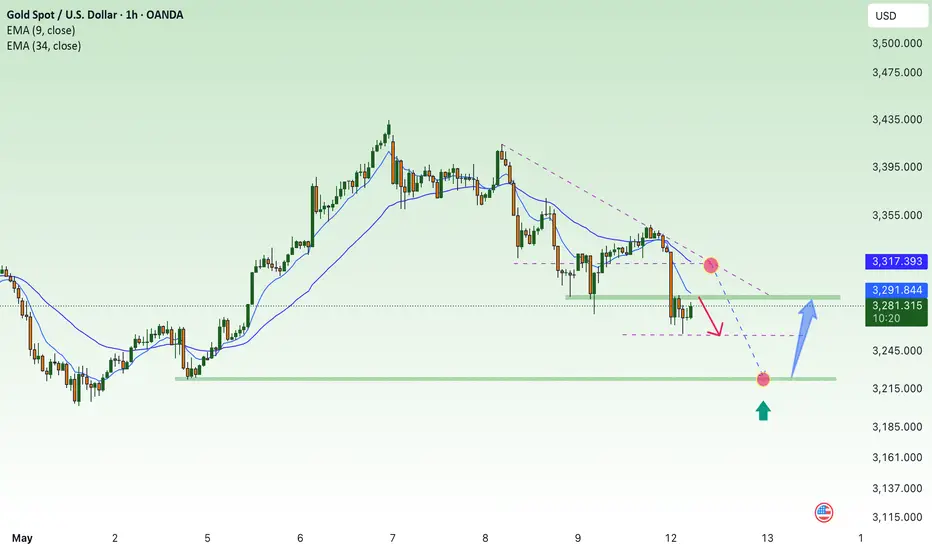
XAU/USD continues sideways above 3200 zone⭐️GOLDEN INFORMATION:
U.S. President Donald Trump stated on Monday that he does not anticipate reinstating the 145% tariffs on Chinese imports following the current 90-day suspension. In a Fox News interview on Wednesday, he emphasized the "excellent" relationship with China, which fueled trade optimism and weighed on safe-haven demand for Gold during the Asian session.
Meanwhile, on the geopolitical front, Russia and Ukraine are preparing for their first high-level, in-person negotiations since 2022, scheduled to take place in Istanbul this week. The talks come amid mounting international pressure for Moscow to accept a proposed 30-day ceasefire. Representing the U.S., Secretary of State Marco Rubio, along with special envoys Steve Witkoff and Keith Kellogg, are expected to participate in the discussions.
⭐️Personal comments NOVA:
Accumulation price zone, gold price sideways around 3200 - 3270, balance between buyers and sellers
⭐️SET UP GOLD PRICE:
🔥SELL GOLD zone : 3282- 3284 SL 3289
TP1: $3270
TP2: $3260
TP3: $3250
🔥BUY GOLD zone: $3167 - $3165 SL $3160
TP1: $3178
TP2: $3189
TP3: $3200
⭐️Technical analysis:
Based on technical indicators EMA 34, EMA89 and support resistance areas to set up a reasonable sell order.
⭐️NOTE:
Note: Nova wishes traders to manage their capital well
- take the number of lots that match your capital
- Takeprofit equal to 4-6% of capital account
- Stoplose equal to 2-3% of capital account

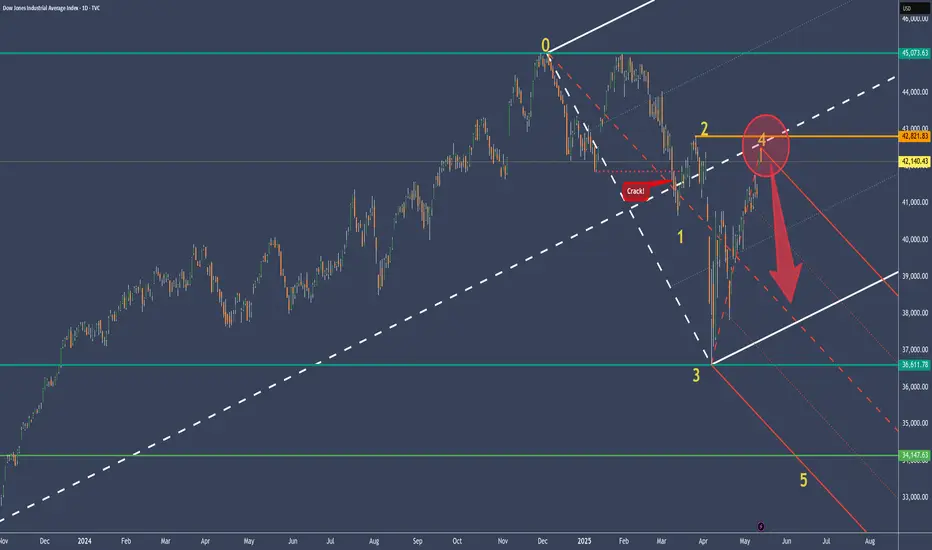
DJI – Ready for the Final ActAfter the breakdown below the last support on March 11th, the price pulled back and formed P2.
A frightening drop followed, reaching P3, then a sharp V-shaped recovery up to point (4)—just a few points shy of the Center Line.
If P2 doesn’t get taken out, things could turn ugly again. Because in that case, my new target lies below the white Lower Median Line Parallel, at P5.
Nothing is certain—never has been. But these days, *everything* feels off balance.
The moves are insane. Governments trading ahead of the news, making hundreds of millions at the expense of ordinary people. It’s like reality has left the building.
Tiny positions. Tight stops. Very high risk-reward ratios. And absolutely zero FOMO.
That’s how these markets must be traded.
Anything else, and we’re bound to get wrecked.
\#backfromcontemplation
CPI - inflation assessment, gold accumulation⭐️GOLDEN INFORMATION:
Swap markets have now fully priced in a 25 basis point rate cut by the Federal Reserve in September, with expectations for two additional reductions by year-end. This marks a slight shift from last week, when traders had anticipated the first cut as early as July and a total of three rate cuts in 2025.
On the geopolitical front, Indian Prime Minister Narendra Modi stated on Monday that military operations against Pakistan are merely on hold, warning that future actions will depend on Islamabad’s conduct. Meanwhile, Ukrainian President Volodymyr Zelensky expressed willingness to meet Russian President Vladimir Putin later this week, following US President Donald Trump's call for him to "immediately" accept a peace summit invitation in Turkey. Heightened geopolitical risks from these developments could fuel demand for safe-haven assets like gold, reinforcing the metal’s appeal amid ongoing global uncertainty.
⭐️Personal comments NOVA:
CPI assesses the level of inflation in the US economy, gold prices continue to strive to maintain the price range around 3200
⭐️SET UP GOLD PRICE:
🔥SELL GOLD zone : 3281- 3283 SL 3288
TP1: $3270
TP2: $3260
TP3: $3250
🔥BUY GOLD zone: $3176 - $3174 SL $3169
TP1: $3185
TP2: $3198
TP3: $3210
⭐️Technical analysis:
Based on technical indicators EMA 34, EMA89 and support resistance areas to set up a reasonable sell order.
⭐️NOTE:
Note: Nova wishes traders to manage their capital well
- take the number of lots that match your capital
- Takeprofit equal to 4-6% of capital account
- Stoplose equal to 2-3% of capital account
Will it fall? Yes. The reasons are HERE!Reasons why it will drop:
1. hypurrscan.io
This is an insider — take a closer look.
2. Selling pressure during the first attempt to rise.
3. Selling pressure is still ongoing.
4. Very low liquidity ahead. It's easy to push the price down because the rise happened with almost no consolidation.
5. Whoever is applying pressure needs to accumulate cheaper.

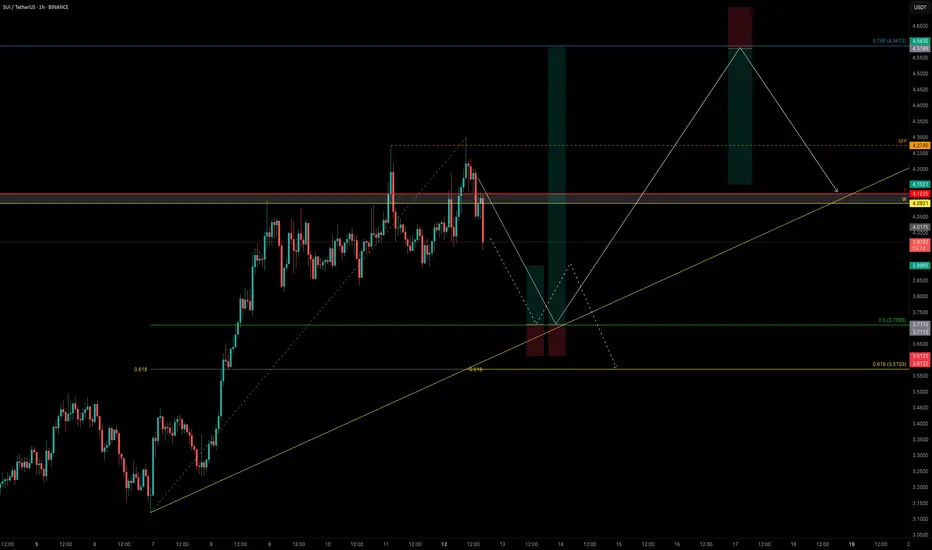
SUI Pullback in Motion — Here’s Where the Smart Money Loads UpSUI is showing signs of exhaustion after failing to convincingly reclaim recent highs. Today’s price action delivered a strong clue: a sweep of the key high at $4.274 followed by a sharp rejection — Swing Failure Pattern (SFP).
Momentum is fading as volume dries up, and bulls have lost control of major levels:
❌ Yearly Open at $4.1225
❌ Weekly Level at $4.0921
This suggests a deeper correction may be underway before SUI can attempt another leg higher.
📌 Liquidity & Fib Levels in Focus
There’s still significant liquidity resting below the $3.80 zone — and the market often seeks to sweep such areas before reversing. Taking the Fib retracement from the $3.12 low to the $4.2989 high, we can identify two critical zones for a potential long entry:
0.5 Fib Retracement → $3.7095
This level not only sits just below the $3.80 liquidity shelf but also provides a strong technical anchor. If SUI finds support here, it could offer a solid long opportunity.
🎯 Trade Setup from the 0.5 Fib ($3.7095)
Entry: Around $3.71
Stop-Loss: $3.612
Target 1: $3.90 → R:R ≈ 2:1
Target 2: $4.587 (0.786 Fib Retracement) → R:R ≈ 9:1
Key Note: Watch the volume on the bounce — strong reaction = continuation potential; weak reaction = deeper retrace risk
🔸 Golden Pocket (0.618–0.666) Zone → $3.57-$3.52
If the 0.5 Fib bounce fails or lacks volume confirmation, price may dig deeper into the golden pocket — a historically strong reversal area. This zone becomes your next high-probability long setup to monitor.
🧠 Summary & Strategy
SUI showed rejection via SFP at key high ($4.274)
Lacking volume for immediate continuation
Next key long opportunity: $3.71 (0.5 Fib), SL at $3.612
If weak, watch $3.57 (golden pocket) as secondary entry
R:R potential ranges from 2:1 up to 9:1 depending on bounce strength
Let price come to you. Monitor reactions at each zone and don’t trade blindly into weakness. This is where patience and precision pay off. 💡
___________________________________
If you found this helpful, leave a like and comment below! Got requests for the next technical analysis? Let me know.
Master HBAR with Fibonacci: The Golden Pocket BlueprintSince topping out at $0.20151, HBAR has spent the last nine days in a corrective pullback. Digging into a rich confluence of supports that offers a long trade setup. Here’s how to spot the high‑probability entries, manage your risk, and scale out for maximum reward.
Current Context
Two days ago, price was firmly rejected at the weekly open ($0.19029) right alongside the anchored VWAP drawn from the $0.28781 swing high.
HBAR now trades below the monthly open ($0.18210), the weekly open ($0.19029), and the daily open ($0.18024), sitting at about $0.177.
Just beneath today’s level lies the swing low at $0.17543. Breaching this could flush out stops before any meaningful bounce.
The Golden Support Zone
All signals converge between $0.170 and $0.1725:
The anchored VWAP from the $0.12488 low sits at around $0.17.
The 0.618 fib retracement of the $0.15396→$0.20239 move falls at $0.17246. Just under the swing low where the liquidity lies.
The secondary 0.666 fib retracement lands at $0.17014, reinforcing that floor.
Volume‑profile analysis of the past 27 days pins its Point of Control right at $0.17, great confluence with the anchored VWAP.
This “golden pocket” is your pivot for a low‑risk, high‑probability long.
Long Trade Setup
Ladder buy orders between the swing low ($0.17543) and the 0.666 fib at $0.17014.
Aim to average in around $0.1725.
Place a single stop‑loss just below $0.17
Scaling Your Exits
First Partial Exit at the monthly open ($0.18210). This offers roughly a 2:1 R:R.
Second Exit Zone around the weekly open and VWAP resistance (~$0.19) for about a 3:1 R:R.
Final Target at the 0.618 fib retracement of the entire down‑wave (from $0.28781 to $0.12488) near $0.2256. An astounding 10:1 payoff for the patient trader.
Keep in mind a potential false‑break (SFP) at $0.17543: if price briefly dips below then snaps back up, with increased volume.
Short Trade Setup
For traders looking to play the downside from the “golden pocket” flip, here’s a clear short strategy:
Entry Zone: Ladder short entries between the 0.618 fib at $0.22557 and the 0.666 fib at $0.23339.
Confluence: The 0.666 level aligns perfectly with the negative 0.618 fib from the prior swing, creating a resistance zone.
Stop‑Loss: Place your stop just above $0.23339, invalidating the confluence.
Take‑Profit: Target a return to around $0.206, where you can lock in gains as HBAR retests its previous high.
By scaling into shorts across that fib band, you balance your risk and capture the high‑odds reversal offered by stacked Fibonacci confluence. Let the golden pocket guide both your longs and shorts!
Key Takeaways
Confluence is king: VWAPs, Fibonacci retracements, Liquidity and volume‑profile all align in the $0.170–$0.175 zone.
Risk control: One stop‑loss under $0.17 protects the entire laddered entry.
Tiered targets: Small wins at $0.182, larger as you clear $0.19, and a big payoff if HBAR rallies toward $0.225. Trail your SL accordingly.
Patience pays: Wait for price to enter the golden pocket, avoid chasing!
With these confluences lining up and clear levels to work from, HBAR’s next high‑probability long setup is staring you in the face. Trade smart, size appropriately, and let the market reward your discipline.
Happy Trading!
___________________________________
If you found this helpful, leave a like and comment below! Got requests for the next technical analysis? Let me know.

SOL Hits Major Resistance — Patience Over FOMOOne of the most common mistakes traders make—especially in fast-moving markets—is jumping into trades impulsively at major resistance. It feels exciting when price is surging, but ironically, this is often where risk is highest and reward is most limited.
Why? Because historical resistance zones—like the $175–$183 region on SOL—tend to attract heavy sell pressure. These are levels where many past buyers look to exit, where smart money hunts liquidity, and where false breakouts are most common. Without volume confirmation and a proper retest, breakouts through such zones often fail.
That’s why experienced traders wait. The smarter approach is to let the market come to you, and only act when one of two things happens:
A pullback into a well-defined, confluence-rich support zone
A clean breakout above resistance, followed by a retest and confirmation
SOL has respected structure beautifully, but now is not the time to chase. Either wait for a healthy correction into support, or let price prove its strength through a confirmed breakout. No trade is also a trade — and capital preservation is the foundation of long-term success.
Patience isn’t passive — it’s a strategy. Let the market come to your desired levels. You don't need to catch every move, only the high-probability trades and there aren’t born from impulse — they’re built on patience, structure, and right timing. 💎
Technical Breakdown
SOL has entered a major resistance zone between $175 and $183 — a historically significant level respected for over a year.
Within this zone lie two key highs:
$179.85: Recently swept with a clean Swing Failure Pattern (SFP)
$180.52: Still untested — if broken, it would confirm a strong bullish continuation
Breaking through such a well-established resistance on the first attempt is uncommon — it typically requires momentum and structure. A rejection here would suggest that SOL needs a healthy correction before mustering the strength for a true breakout.
📉 Elliott Wave Count
Looking at the structure, we’ve completed a 5-wave sequence — signaling the potential end of this impulse leg. According to Elliott Wave Theory, a corrective phase is now expected before continuation.
📐 Additional Confluence: Fib Speed Fan
The 0.618 Fib Speed Fan — drawn from the all-time high at $295.83 to the swing low at $95.26 — aligns perfectly with this resistance zone, adding more weight to the idea of a potential rejection or pause.
🟢 Long Setup: The Next High-Probability Entry Zone
We now shift our focus to where the next long opportunity could arise. Here’s the technical confluence:
Anchored VWAP from the recent low at $141.41 sits at $164.70
4H bullish order block around $164.46
0.382 Fib retracement of the full 5-wave impulse: $165.42
0.412 Fib retracement: $164.25
All these levels converge in a tight band, providing a solid long entry zone between:
Long Entry Zone: $165.50 to $164.25
Stop-Loss: Below $160 (to protect against any deep wick)
Targets:
TP1: $171.75 (Point of Control from the range)
TP2: $180.00 (resistance retest)
TP3: $200.00 (psychological level)
Estimated R:R: ~6:1 — High-conviction setup
Bonus: If price returns to this $165 zone within 24 hours, it will also be supported by the 0.618 Speed Fan — adding one more layer of support.
🔴 Short Setup: Reversal Play at $200
For those watching from the sidelines or looking to fade the rally, the psychological level at $200 presents a strong short opportunity — but only on confirmation (e.g., SFP or bearish engulfing).
Short Entry: On rejection at $200
Stop-Loss: $206.10
Target: $187.00
Estimated R:R: ~2:1
🧠 Summary:
Completed 5-wave structure → potential correction phase underway
Strong resistance at $175–$183 with SFP and speed fan alignment
High-probability long setup at $165.5–$164.25 with multi-layered confluence
Potential short at $200 on confirmation
⚠️ Key Takeaway: Don’t Chase the Highs
This is where many traders slip — FOMOing into trades at major resistance. Please, don’t do it. Instead, wait for:
A pullback into well-defined support (like the $165 zone), or
A clean breakout above $180, followed by a confirmed retest
____________________________________
If you found this helpful, leave a like and comment below! Got requests for the next technical analysis? Let me know.

Bears are active at the beginning of the week, prices are down⭐️GOLDEN INFORMATION:
The United States and China announced “substantial progress” following two days of trade negotiations in Switzerland, marking a potential turning point in efforts to ease tensions between the world’s two largest economies. Chinese Vice Premier He Lifeng characterized the discussions as “an important first step” toward stabilizing bilateral trade, while US Treasury Secretary Scott Bessent echoed the sentiment, noting meaningful advancements were made. The US is expected to release more details about the outcome of the talks on Monday.
While signs of progress may dampen demand for safe-haven assets like gold, lingering uncertainty around the specifics of any deal could still lend some support to the precious metal. “Ongoing ambiguity surrounding tariffs remains one of the most influential factors sustaining gold,” noted David Meger, Director of Metals Trading at High Ridge Futures.
⭐️Personal comments NOVA:
The short-term downtrend is maintained, gold price accumulates around 3300 and continues to go down to lower support zones.
⭐️SET UP GOLD PRICE:
🔥SELL GOLD zone : 3315- 3317 SL 3322
TP1: $3300
TP2: $3290
TP3: $3280
🔥BUY GOLD zone: $3223 - $3225 SL $3218
TP1: $3238
TP2: $3245
TP3: $3260
⭐️Technical analysis:
Based on technical indicators EMA 34, EMA89 and support resistance areas to set up a reasonable sell order.
⭐️NOTE:
Note: Nova wishes traders to manage their capital well
- take the number of lots that match your capital
- Takeprofit equal to 4-6% of capital account
- Stoplose equal to 2-3% of capital account
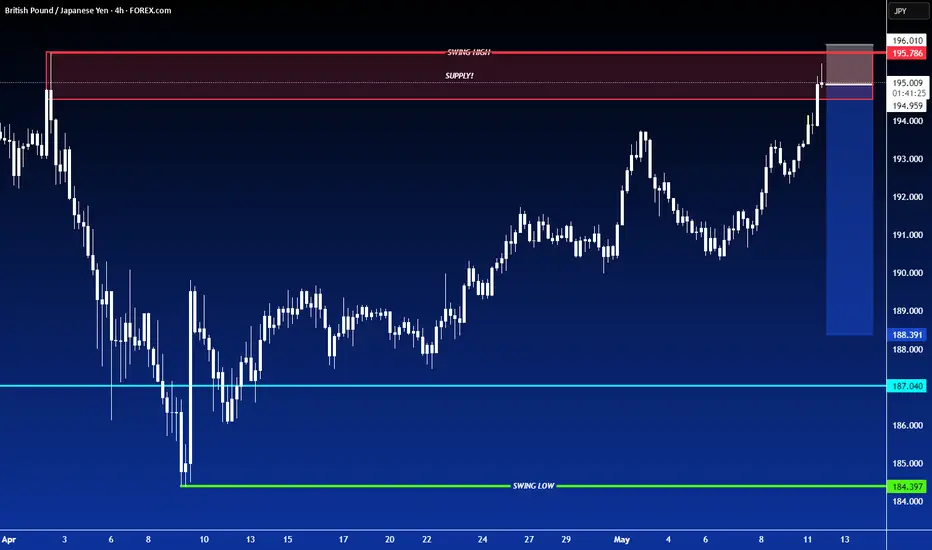
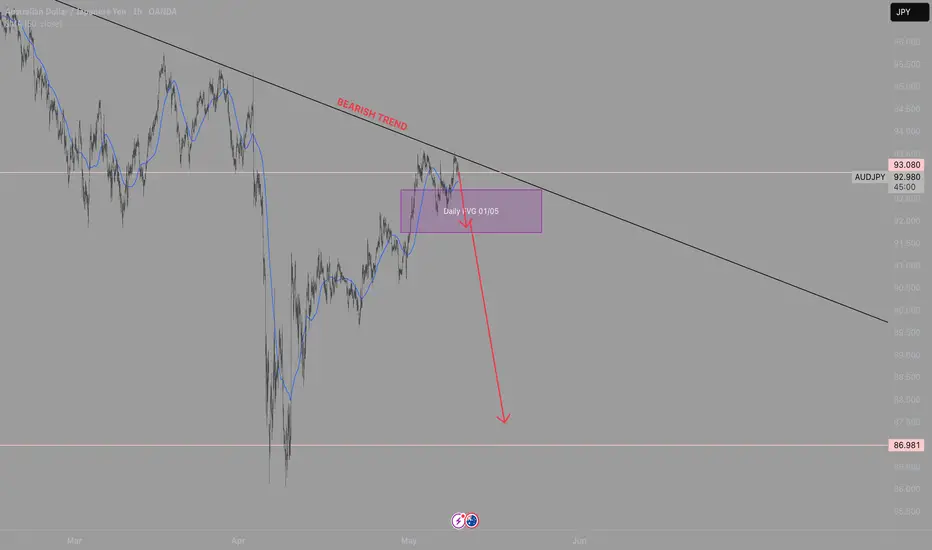
SHORT ON GBP/JPYGJ Has finally pulled back to a Major Resistance area.
This previous high broke a low in the past and is a strong resistance zone.
I expect price to fall to the pervious swing low / demand are for over 300-400 pips.
SUI - Leveraging Fibonacci & Elliott for Precision TradesSUI’s movement is rapid, sharp swings—both up and down. In volatile conditions like this, we aim 0.702–0.786 fib retracements (and occasionally 0.886 in harmonic contexts) for high‑probability entries. Below is a clear, Elliott-focused breakdown of the current setup and both long and short trade plans.
Before diving into the charts, let’s cover the basics of Elliott Wave Theory. Elliott Wave Theory provides a roadmap for market psychology by dividing price action into two distinct phases:
1. Impulse Phase (Waves 1–5)
Wave 1: The spark that ignites a new trend as early adopters push prices beyond the prior range.
Wave 2: A corrective pullback that tests the strength of the emerging trend, often retracing 38–61.8%.
Wave 3: The powerhouse wave—typically the longest and most dynamic—driven by broad market participation and often extending to key Fibonacci levels (1.618, 2.618).
Wave 4: A consolidating correction that digests gains and builds the base for the final thrust; it must not overlap Wave 1 territory in a classic impulse.
Wave 5: The final leg of the advance, often fueled by last bursts of optimism and weaker hands.
2. Corrective Phase (Waves A–B–C)
Wave A: Initial counter-trend reaction as profit-taking begins.
Wave B: A deceptive retracement back toward the trend, frequently trapping traders.
Wave C: The concluding leg of the correction, which typically tests or breaks the low of Wave A before the next cycle begins.
Key Points:
Impulse waves showcase momentum and structural clarity, often aligning with Fibonacci extensions.
Corrective waves follow Fibonacci retracements (38.2%, 50%, 61.8%), offering optimal entry points.
Wave 3 is seldom the shortest; Wave 4’s complexity sets the stage for Wave 5’s final push.
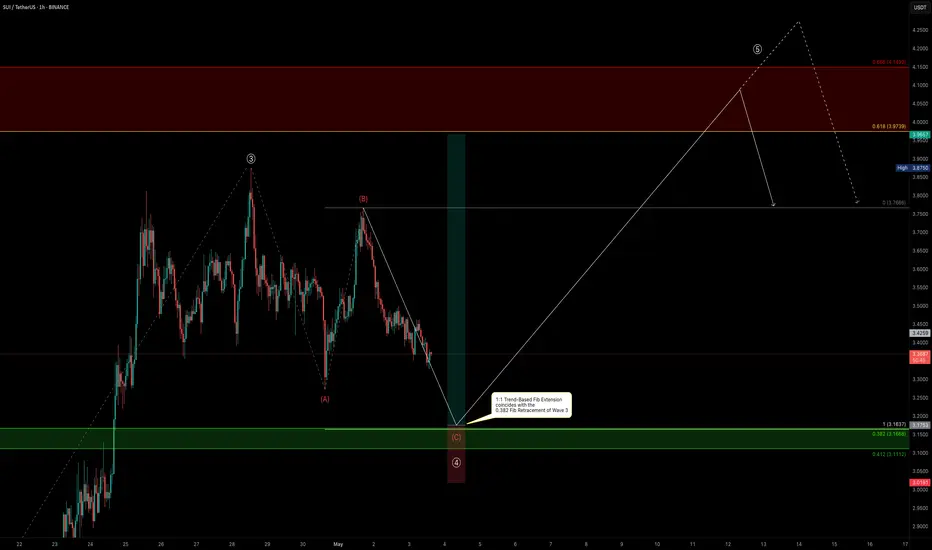
In the current SUI structure:
Wave 1 ignited the initial rally.
Wave 2 delivered a healthy retracement, a pullback close to the 0.618 fib, setting the stage for stronger momentum.
Wave 3 roared to a powerful peak topped at the 2.618 extension ($3.875)
Now, we’re deep into Wave 4, likely an ABC corrective pattern. This pause is critical—it gathers energy before the final push of Wave 5. Below is a clear breakdown of each wave, big-picture confluences, and trade setups.
🚀 Elliott Wave Overview
1. Wave 1 & Wave 2
Wave 1: Quick surge from $2.4175 → $2.75, setting initial momentum.
Wave 2: Pulled back close to the 0.618 fib, creating a solid launchpad.
2. Wave 3: The Power Move
Peak: Hit the 2.618 extension of Wave 1→2 and aligned with the –2 extension of Wave 1.
Significance: In strong bull markets, a run to the 2.618 extension often precedes a meaningful pullback. Here, Wave 3’s exhaustion suggests a retrace toward the 38.2% Fib of that advance—our ideal Wave 4 entry zone.
3. Wave 4: The Correction
All eyes on the $3.17 level—the projected 1:1 extension of A→B and 0.382 fib retracement of Wave 3. This confluence zone is yet to be tested and could offer an ideal Wave 4 entry.
ABC Pattern: Currently working on Wave C.
4. Wave 5: The Finale
Target Zone: $4.00–$4.35, with strong focus at $4.31
Extension Levels:
1.133 → $3.9695 aligns with the 0.618 fib retracement.
1.272 → $4.0683 is close to the weekly resistance level.
1.412 → $4.1678 alings with the 0.666 fib retracement.
1.618 → $4.3142 alings with the key swing high.
🔑 Key Confluence Levels
Golden Pocket: $3.9739–$4.1492 (90-day retrace).
Speed Fan 0.618: Support around $3.15.
Fair Value Gap:
Psychological: $3.00 major support.
📈 Long Trade Setup
Entry Ladder: $3.25–$3.111 (stack orders to DCA)
Stop‑Loss: $3.07 (just below the 0.786 Fib low)
Profit Targets:
Fib 1.133 at $3.9795 ($4 psychological & partial take‑profit)
Fib 1.272 at $4.0683
Fib 1.412 at $4.1678
Fib 1.618 at $4.3142
Risk:Reward: ~6:1+ (average entry around $3.20 → SL at $3.07 → TP1 at $3.9795)
📉 Short Trade Setup
Entry Zone: $4.00–$4.35 (sweet spot at weekly level/yearly open)
Confirmation: Bearish reversal candle or volume spike down
Stop‑Loss: Above $4.35
Target: $3.77 (near Wave 3 high turned support)
Risk:Reward: ~2:1 (varies with DCA entry)
⚙️ Summary & Game Plan
Primary Bias: Long in the $3.25–$3.111 zone—stack into the 0.382-0.412 fib retracement entries with tight SL, aiming for the $4.00–$4.30 upside zone.
Alternate Bias: Short on a clear rejection within $4.00–$4.35, targeting $3.77 or lower.
Risk Management: Keep stops tight to maximize R:R.
Patience & Confirmation: Wait for price to reach these zones and show reversal signals (price action, volume, patterns) before committing.
All set—now let SUI’s swings unveil the opportunities. Sit tight, follow your plan, and let patience pay its dividend.
Happy Trading!
____________________________________
If you found this helpful, leave a like and comment below! Got requests for the next technical analysis? Let me know.
H4 frame accumulation 2 trend lines✍️ NOVA hello everyone, Let's comment on gold price next week from 05/12/2025 - 05/16/2025
🔥 World situation:
Gold prices advanced over 1% on Friday, rebounding as the US Dollar (USD) softened following a two-day winning streak, pressured by declining US Treasury yields. Renewed risk-off sentiment, fueled by persistent geopolitical tensions, bolstered demand for the safe-haven metal. At the time of writing, XAU/USD is trading near $3,338.
US equity markets slipped as investors adopted a cautious stance ahead of Saturday’s high-stakes meeting between US and Chinese delegations in Switzerland. While hopes for a de-escalation in trade tensions remain elevated, uncertainty continues to dominate sentiment.
Adding to the volatility, US President Donald Trump reignited trade concerns by stating on social media, “80% Tariff on China seems right! Up to Scott B.”
🔥 Identify:
Gold prices slow down, starting to accumulate more. Trade negotiations will appear more, putting selling pressure on gold prices in the near future.
🔥 Technically:
Based on the resistance and support areas of the gold price according to the H4 frame, NOVA identifies the important key areas as follows:
Resistance: $3402, $3435
Support : $3282, $3203
🔥 NOTE:
Note: Nova wishes traders to manage their capital well
- take the number of lots that match your capital
- Takeprofit equal to 4-6% of capital account
- Stoplose equal to 2-3% of capital account
- The winner is the one who sticks with the market the longest

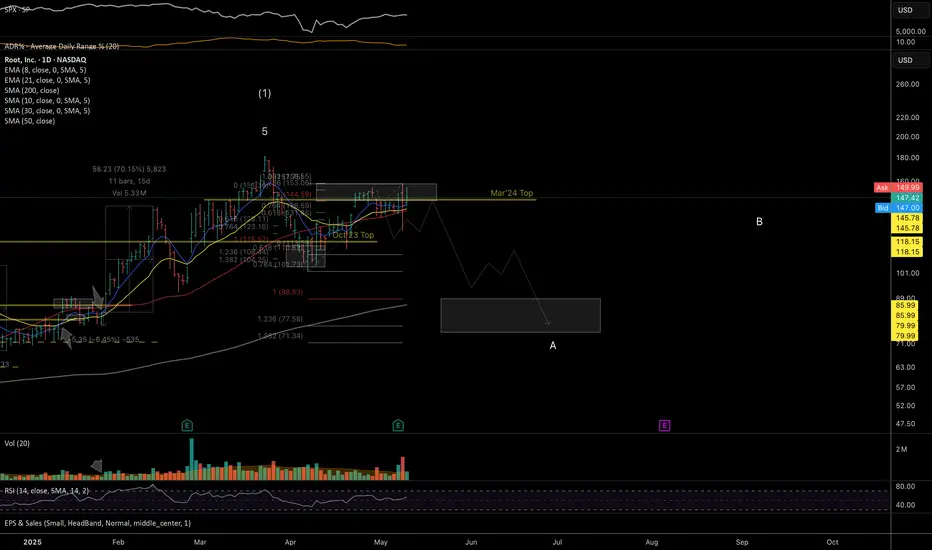
ROOT: double-top short / shortable bounce set-up Stock's fundamentals, price relative strength, and group action look strong.
But the uptrend structure may have formed a mid-term top.
Weekly:
Downside potential remains as long as the price stays below the May 8th highs.
Ideal macro support zone: 90–70.
Daily:
Thank you for your attention and I wish you successful trading decisions!
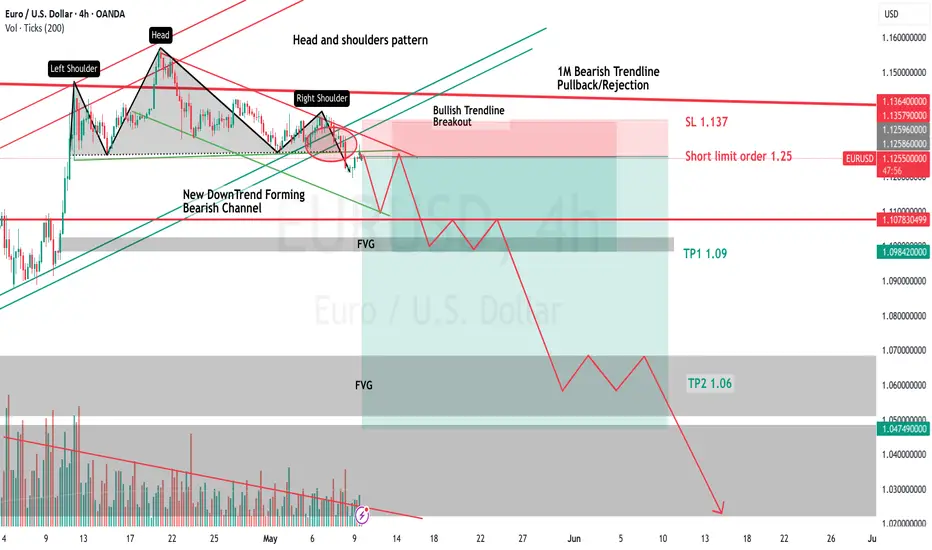
My thoughts on EUR/USDSince January 31st, EUR/USD had been in a bullish trend--a bullish channel in the 4H and 1D. I knew we were about to break out of this bullish trend. I had been anticipating a very strong reversal for a while, given we recently retested the top of another stronger Trendline. A much more reliable channel. the channel I speak of is the 3M, 1M and 1W timeframe channels, they are bearish. We once again hit the resistance of this monthly channel, while, at the same time being in a bullish trend in the 4H and 1D timeframes. So obviously I presumed the 4H bullish trend would end and reverse-which it has and did. This monthly bearish channel has been active for 14-17 years and has perfectly retested the support and resistances numerous times--making it a valid A+ setup in my book. To further this, on the 4H-1D timeframes, while we were still inside this 4H bullish channel, we saw a perfect Head and Shoulders pattern and quickly got our confirmation when it crossed the neckline. All of this indicates we will see strong selling pressure very soon.
So, where are we headed exactly? Well we know that we have FVGs and strong Supports. key areas for TPs are 1.09, 1.06, and on the monthly as low as 0.82.
If you guys have any questions feel free to ask. And share your thoughts and opinions on EUR/USD--thanks :)
Example Short Orders
SL 1.137
Limit order 1.255
TP1 1.09
TP2 1.06
TP3 1.02
TP4 0.82
(Maybe i am wrong, but if I am it will be the first time in 17 years for EUR/USD.. I like the odds)
OANDA:EURUSD
OptionsMastery: A potential short opportunity for GOLD!🔉Sound on!🔉
📣Make sure to watch fullscreen!📣
Thank you as always for watching my videos. I hope that you learned something very educational! Please feel free to like, share, and comment on this post. Remember only risk what you are willing to lose. Trading is very risky but it can change your life!

Downtrend - will gold price return to 3233?⭐️GOLDEN INFORMATION:
Gold price (XAU/USD) rebounded from an early Asian session drop to a multi-day low, reclaiming ground above the $3,300 psychological level in the past hour. The precious metal continues to draw support from persistent geopolitical uncertainties, including the Russia-Ukraine conflict, intensifying tensions in the Middle East, and renewed friction along the India-Pakistan border. That said, the upside appears constrained by improving risk sentiment, driven by renewed optimism surrounding a US-UK trade agreement and the launch of US-China tariff negotiations over the weekend.
⭐️Personal comments NOVA:
Gold prices are under great selling pressure as trade negotiations on tariffs are becoming more active. They may return to the 323x price zone and continue to accumulate.
⭐️SET UP GOLD PRICE:
🔥SELL GOLD zone : 3351- 3353 SL 3358
TP1: $3340
TP2: $3330
TP3: $3320
🔥BUY GOLD zone: $3232 - $3234 SL $3227
TP1: $3245
TP2: $3260
TP3: $3270
⭐️Technical analysis:
Based on technical indicators EMA 34, EMA89 and support resistance areas to set up a reasonable sell order.
⭐️NOTE:
Note: Nova wishes traders to manage their capital well
- take the number of lots that match your capital
- Takeprofit equal to 4-6% of capital account
- Stoplose equal to 2-3% of capital account
Moondeng - RSI is overbought and shows strong divergence.Dear my friends,
Observe the 1-hour chart of Moondeng: after spectacular price breakouts, when hitting strong resistance on the daily timeframe, the price begins to correct. I checked the RSI, and indeed, there’s a strong divergence here. The RSI is almost absolutely overbought. I tried drawing Fibonacci levels to identify potential retracement points. I decided to wait for a buyback at the 0.98 and 0.86 zones. Let’s see if my prediction is as accurate as it was with Virtual.
Best Regards,
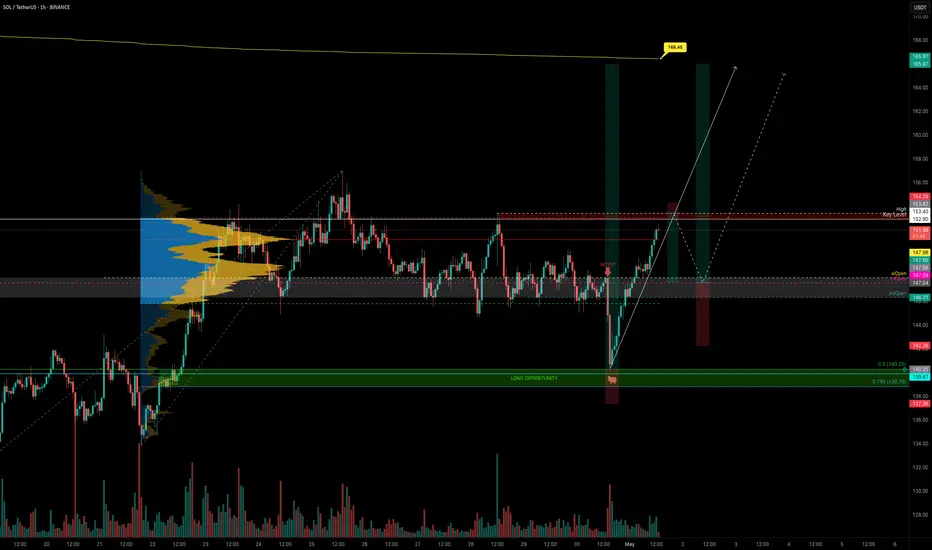
SOL Analysis Deep Dive: Identifying Optimal Entry and Exit ZonesYesterday, SOL gave a sharp downside shakeout, dropping from the weekly open at $147.98 (perfectly retested) down to the 0.5 Fib retracement of the swing at $140.25. Here’s a structured breakdown of the key levels, trade setups, and R:R profiles for both longs and shorts:
🔑 Key Levels & Confluences
1. Higher-Timeframe Opens
Weekly Open & Retest: $147.98 – pivoted price before the drop
Monthly & Prior-Day Open Cluster: $147.98–$146.31 – strong support confluence zone
2. Fibonacci Support Zones
0.5 Fib at $140.25 – primary mean-reversion entry
0.786 Fib (smaller wave) at $138.78 – secondary, deeper support
3. Order Block
Daily Bullish Order Block at $139.87 – just below 0.5 Fib, adds extra support
4. Volume-Weighted Average Price
Anchored VWAP (from ATH $295.83) at ~$166.45 – key upside resistance
5. Market Profile Value Areas (10-Day Range)
Value Area High (VAH) at ~$153.00 – overhead resistance confluence
Value Area Low (VAL) at ~$145.75 – underpins support
📈 Long Trade Setups
1. 0.5/0.786 Fib + Daily Bullish Order Block
Entry: $141-138.78
Stop-Loss: $137.5
Target: $165 (anchored VWAP / Fib zones)
R:R ≈ 9:1
2. Higher-Timeframe Open Cluster
Entry Zone: $147.98–$146.31(monthly/weekly open)
Stop-Loss: $142.5
Target: $165
R:R ≈ 3:1
• Why these levels? The 0.5 Fib is a classic mean-reversion zone, bolstered by the daily order block. The $147–146 zone ties together multiple opens (weekly, monthly, prior-day), offering a solid demand area if price retraces back up.
📉 Short Trade Setup
Trigger: Rejection / swing-failure around $153.4
Entry: $153.4
Stop-Loss: $154.3
Target: Weekly/Monthly open (~$147)
R:R ≈ 6:1
• Low-risk short: A clean rejection at the recent high lets you define risk tightly above the swing, aiming to capture the retrace back to the opens.
🎯 Summary & Game Plan
Primary bias: Look for long entries at the 0.5 Fib ($140.25) or the open-cluster zone ($147–146), with targets toward the anchored VWAP at ~$166.
Alternate bias: A short on clear rejection from $153.4, targeting the opens as support.
Risk management: Keep stops tight (SL below $137.5 or above $154.3) to maximize R:R on your favored setups.
Volume & Price Action: Confirm entries with an uptick in volume or bullish price structure (for longs) or swift failure patterns (for shorts).
Now it’s a waiting game! Let price revisit these zones, watch for confirmation signals, and then scale into your chosen side. Good luck! Don't chase, let the charts come to you!
____________________________________
If you found this helpful, leave a like and comment below! Got requests for the next technical analysis? Let me know.

Possible Next Move AUD JPYLooking at the Daily & 1HR Chart. Bearish trend over all. Likely to take out the Daily FVG to head down to the next significant price zone of 86.981. This area also shows a 1HR liquidity zone.
bullish momentum, accumulating around 3400⭐️GOLDEN INFORMATION:
Gold price (XAU/USD) regained strong upward momentum during the Asian session on Thursday, rebounding sharply above the $3,400 level in the past hour and recovering much of its overnight pullback from a two-week high. The renewed demand for the safe-haven metal comes as US President Donald Trump downplayed expectations of an imminent resolution to the US-China trade dispute, stating he feels "no rush" to finalize an agreement. Heightened geopolitical tensions—including the ongoing Russia-Ukraine war, instability in the Middle East, and escalating military friction between India and Pakistan—further support gold's appeal as a defensive asset.
⭐️Personal comments NOVA:
Gold price continues to recover well around 3400, FED's speech is quite moderate, predicted early by investors, the market is positive in the recovery trend this week
⭐️SET UP GOLD PRICE:
🔥SELL GOLD zone : 3438- 3440 SL 3445
TP1: $3425
TP2: $3410
TP3: $3395
🔥BUY GOLD zone: $3352 - $3350 SL $3345
TP1: $3365
TP2: $3380
TP3: $3400
⭐️Technical analysis:
Based on technical indicators EMA 34, EMA89 and support resistance areas to set up a reasonable sell order.
⭐️NOTE:
Note: Nova wishes traders to manage their capital well
- take the number of lots that match your capital
- Takeprofit equal to 4-6% of capital account
- Stoplose equal to 2-3% of capital account
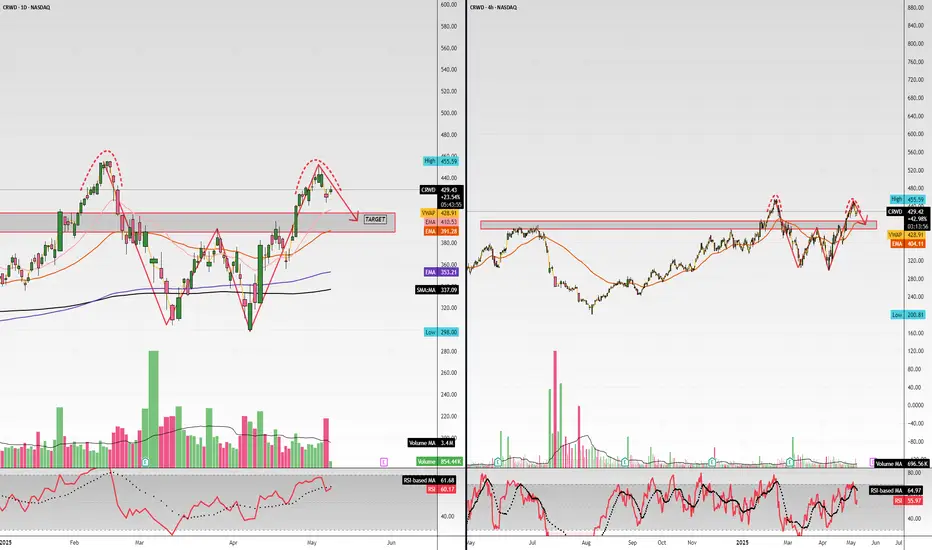
$CRWD double top off W into overbought, $400 pullbackNASDAQ:CRWD on watch for put swing. We have a possible double top off accelerated upswing momentum. Expecting a pullback into the 50 and 20 EMAs.
WSL
Pull Back is RequiredAMZN Sell Setup - GETTEX:AMZ
Bearish Momentum on Daily Chart
Instrument: AMZN
Timeframe: Daily
Direction: Sell
Confidence: 75%
Setup Overview:
AMZN is showing bearish signals after a recent pullback. MACD has a bearish crossover, and RSI is overbought at 61.25, indicating potential for a downward move. VIX is rising, and 10-year yields are increasing, adding to market pressure. Social sentiment on X is mixed, but news sentiment leans bearish.
Trade Details:
Entry Price: $198.82
Profit Target: $182.23 (~5% downside)
Stop Loss: $205.61 (2:1 risk-reward ratio)
Position Size: 4% of portfolio
Expected Move: -5%
Key Indicators:
MACD: Bearish crossover
RSI: Overbought at 61.25
Market Context: Rising VIX, increasing 10-year yields
Follow for Best AI Signals on the market
