Panic Selling LINK? Here’s Your Master PlanBuckle up! LINK has been riding a relentless bearish trend for 113 days, ever since it kissed its peak of $30.94 back in December 2024. With economic uncertainty casting a shadow over the markets and fear gripping investors, the big questions loom: Is this the dip to buy while others panic-sell? Or is it wiser to sit on the sidelines? Let’s slice through the noise, dissect LINK’s chart like a seasoned pro, and uncover the setups that could turn this chaos into opportunity. Let’s dive in!
The Big Picture: LINK’s Bearish Blueprint
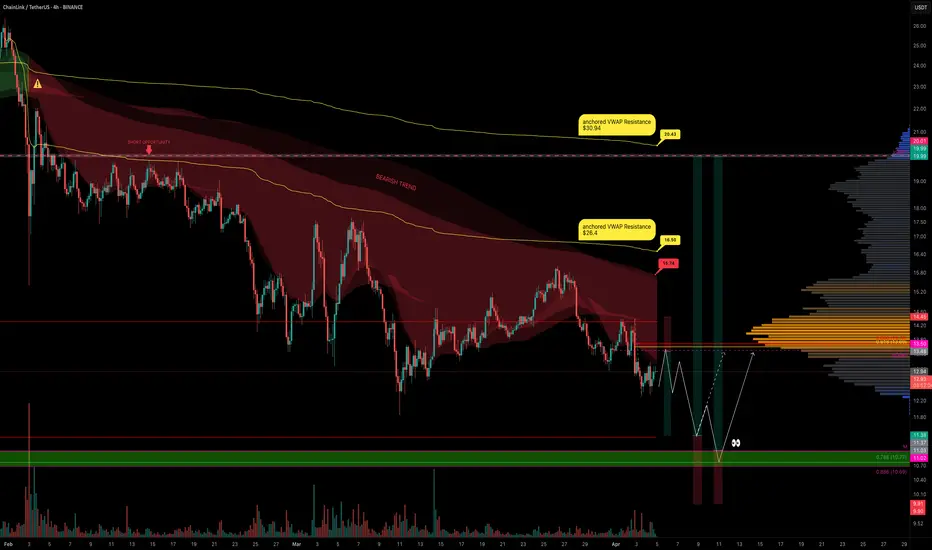
LINK is currently trading at $13, a far cry from its yearly open of $20. April has kicked off, and LINK has already surrendered the monthly open at $13.5, a critical level now acting as a brick wall overhead. Zooming out, the trend is unmistakably bearish: lower highs and lower lows dominate the chart. Adding fuel to the fire, LINK is languishing below the Point of Control (POC) at $14.32, derived from a 1.5-year trading range. This is a market screaming caution for bulls and whispering opportunity for bears, at least for now.
But charts don’t lie, and they’re packed with clues. Let’s map out the key levels, pinpoint trade setups, and arm ourselves with a plan that’d make even the most seasoned traders nod in approval.
Resistance Zones: Where Bears Sharpen Their Claws
1.) Resistance - The Golden Pocket ($13.6 - $13.7)
Using the Fibonacci retracement tool on the latest downward wave, the golden pocket (0.618 - 0.65 Fib) aligns beautifully with the monthly open at $13.5. Oh wait there’s more, this zone overlaps with a Fair Value Gap (FVG), making it a magnet for price action.
Trade Setup (Short):
Entry: ~$13.5 (if price tests and rejects this zone).
Stop Loss (SL): Above the recent swing high at $14.4.
Take Profit (TP): First target at $11.85 (swing low), with a stretch goal at $11.
Risk-to-Reward (R:R): A solid 2:1.
The Play: If LINK crawls up to this resistance and gets smacked down, bears can pounce. Watch for rejection candles (e.g., shooting star, bearish engulfing) to confirm the move.
2. Key Resistance - Cloud Edge & VWAP ($15.74 - $16.5)
The Cloud edge of my indicator sits at $15.74, while the anchored VWAP (from the $26.4 high) hovers at $16.5. A break above $16.5 would flip the script, snapping the bearish structure and signaling a potential trend reversal.
Bullish Scenario: If bulls reclaim $16.5 as support, it’s a green light for a long trade. Until then, this is a fortress for bears to defend.
The Play: No bullish setups here yet.
Support Zones: Where Bulls Build Their Base
1.) Support - Swing Low ($11.85)
This is the first line in the sand for bulls. A potential Swing Failure Pattern (SFP), where price dips below $11.85, sweeps liquidity, and reverses—could spark a long trade.
The Play: Watch for a bullish reversal candle or volume spike here.
2.) Major Support Cluster - The Golden Zone ($10 - $11.85)
This is where the chart sings a symphony of confluence:
Swing Low: $11.85.
POC: $11.33 (1.5-year trading range).
Monthly Level: $11.02.
Fib Retracement: 0.886 at $10.69 and 0.786 (log scale) at $10.77.
Psychological Level: $10.
Trade Setup (Long):
Entry: Dollar-Cost Average (DCA) between $11.85 and $10.
Stop Loss (SL): Below $10
Take Profit (TP): First target: $13.5 (monthly open), stretch goal: $20 (yearly open).
Risk-to-Reward (R:R): A monstrous 6:1 or better, depending on your average entry. This is the kind of trade we are looking for!
The Play: Patience is key. Wait for confirmation—think bullish engulfing candles, a surge in volume, or positive order-flow momentum. This isn’t a “hope and pray” trade; it’s a calculated ambush on the bears.
Market Structure: Bears Rule, But Bulls Lurk
Right now, LINK’s chart is a bear’s playground—lower highs, lower lows, and no bullish momentum to speak of. The $16.5 VWAP is the line in the sand for a trend shift, but until then, short trades take priority. That said, the $10 - $11.85 support zone is a coiled spring for bulls. If fear drives LINK into this range, it’s time to load the boat with longs—provided confirmation aligns.
Your Trading Edge
LINK’s 113-day bearish descent is a wild ride, but it’s not random chaos—it’s a roadmap. Bears can feast on rejections at $13.5 - $13.7 with a tidy 2:1 R:R short. Bulls, meanwhile, should stalk the $10 - $11.85 zone for a high-probability long with a 6:1+ R:R payoff. Whether you’re scalping the dips or swinging for the fences, these levels give you the edge to trade with confidence.
So, what’s it gonna be? Short the resistance and ride the wave down? Or stack bids at support and catch the reversal of a lifetime? The chart’s laid bare—now it’s your move. Drop your thoughts below, and let’s conquer this market together!
If you found this helpful, leave a like and comment below! Got requests for the next technical analysis? Let me know, I’m here to break down the charts you want to see.
Happy trading =)
Shortsetup
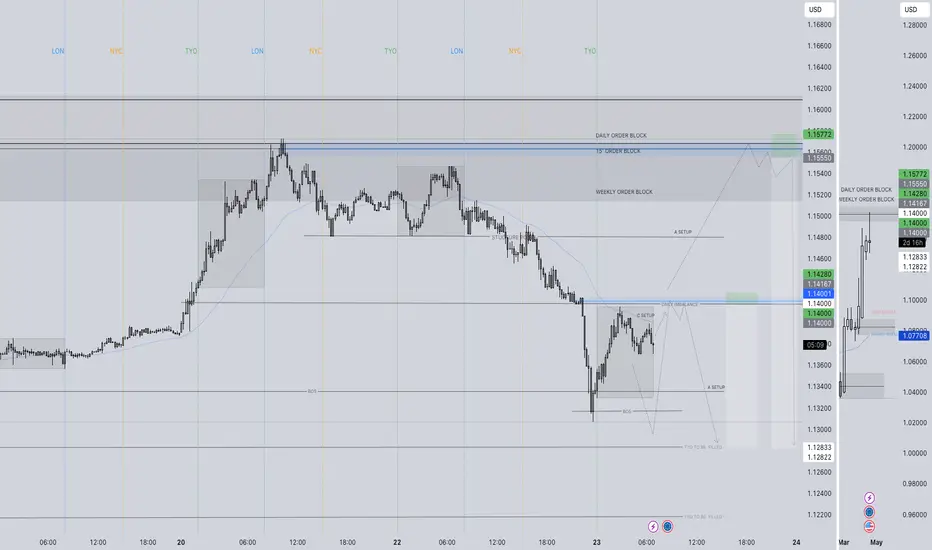
EURUSD SHORT FORECAST Q2 W17 D23 Y25EURUSD SHORT FORECAST Q2 W17 D23 Y25
Professional Risk Managers👋
Welcome back to another FRGNT chart update📈
Diving into some Forex setups using predominantly higher time frame order blocks alongside confirmation breaks of structure.
Let’s see what price action is telling us today!
Trade confluences
- Weekly order block rejection
- Daily bearish close
- Intraday breaks of structure
- 15’ order block created
- Tokyo ranges to be filled
🔑 Remember, to participate in trading comes always with a degree of risk, therefore as professional risk managers it remains vital that we stick to our risk management plan as well as our trading strategies.
📈The rest, we leave to the balance of probabilities.
💡Fail to plan. Plan to fail.
🏆It has always been that simple.
❤️Good luck with your trading journey, I shall see you at the very top.
🎯Trade consistent, FRGNT X
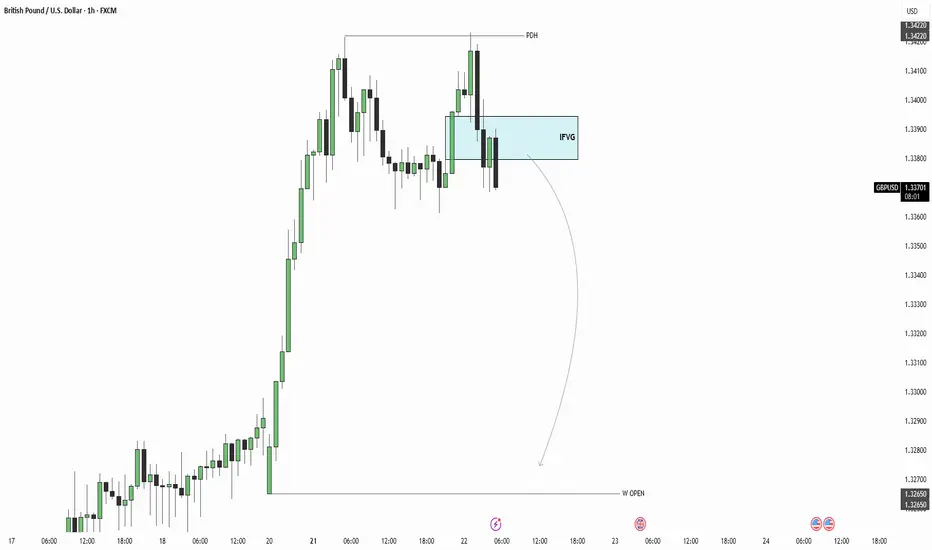
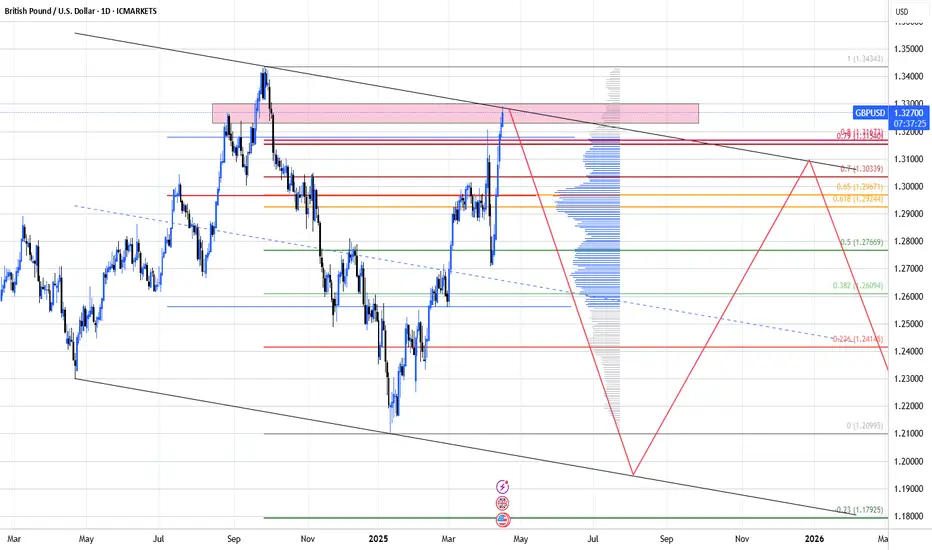
GBPUSD Analysis with ICT ConceptsMy current outlook on the British Pound is bearish, with an expectation of lower levels in the near term.
A key level I am anticipating price to reach is the Weekly Open, which has not yet been touched.
Yesterday's price action seems to be confirming this potential move towards the Weekly Open.
Therefore, I am actively looking for confirmed short position opportunities to align with this view.
Trade safe!
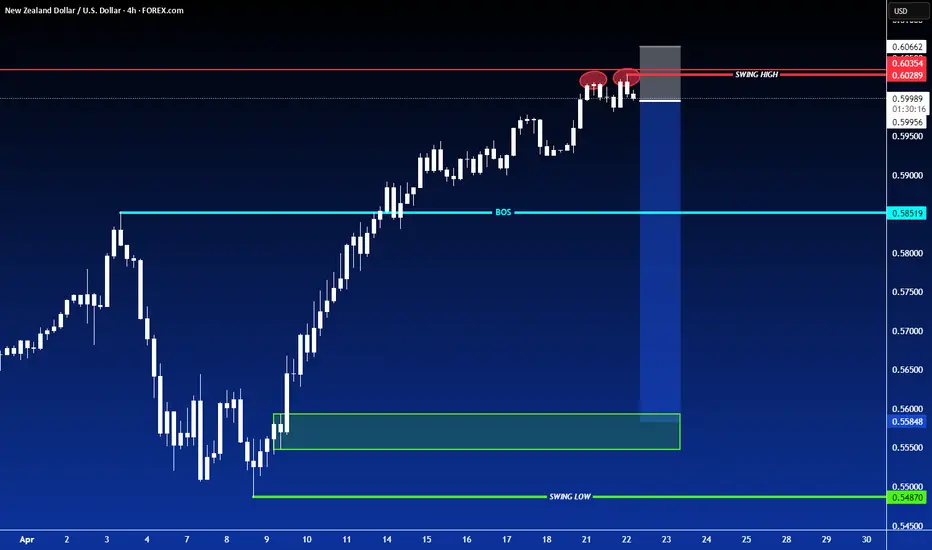
SHORT ON NZD/USDNZD/USD Is currently at a major resistance level/zone and has created a double top or equal highs.
Price has started to fall a bit, but I do believe price will rise to take out the equal highs in a "Liquidity hunt"
Overall I am taking a market execution sell on NZD/USD to the next demand level looking to catch over 300+ pips.
Watch for a breakout from the #BANKUSDT📍 The price of MEXC:BANKUSDT.P is approaching the apex of the pattern — a breakout from consolidation is expected soon. The main scenario favors a downward breakout, with a short opportunity if confirmed.
📍 Important note: ➡️ Don’t rush the entry! Wait for a clear breakout from the pennant and confirmation of the direction.
📍 Beware of fakeouts — the key to success lies in confirmation with candle closes and volume.
📉 SHORT MEXC:BANKUSDT.P from $0.04118
🛡 Stop loss: $0.04284
🕒 Timeframe: 1H
📢 Overview:
➡️ The main structure of MEXC:BANKUSDT.P remains bearish, showing consolidation after a drop.
➡️ A break below the $0.04118 support will trigger the Bearish Pennant pattern.
➡️ Volume increase on the breakout will confirm sellers' dominance.
🎯 TP Targets for SHORT:
💎 TP 1: $0.04010
💎 TP 2: $0.03900
💎 TP 3: $0.03815
📢 Entry conditions for MEXC:BANKUSDT.P :
Enter only after a clear breakdown and candle close below $0.04118, ideally with volume confirmation.
📢 If the price holds above $0.04588, the structure may be invalidated, and the short scenario should be reconsidered.
📈 LONG MEXC:BANKUSDT.P from $0.04652
🛡 Stop loss: $0.04501
🕒 Timeframe: 1H
📢 Overview:
➡️ Price is compressing inside a Bearish Pennant, but there is still potential for a fake breakout upward.
➡️ A breakout above the pennant on strong volume may lead to a bullish impulse.
➡️ The $0.04652 level is key for a long entry after confirmation.
🎯 TP Targets for LONG:
💎 TP 1: $0.04760
💎 TP 2: $0.04870
💎 TP 3: $0.04970
📢 Entry conditions:
Enter only after a confident breakout above $0.04652 and a solid candle close (preferably with high volume).
🚀 Watch for a breakout from the MEXC:BANKUSDT.P structure and trade only in the confirmed direction. Either way — there is good movement potential and the R/R ratio is solid in both directions!

USDCHF SELLSPrice is still bearish therefore I’m only interested in sells for now. I’d wait for price to breakout of this h4 range then I’ll look for sells towards 0.78250 area.

CAKEUSDT Short Setup – Watching 2.40 Zone for RejectionHey Traders,
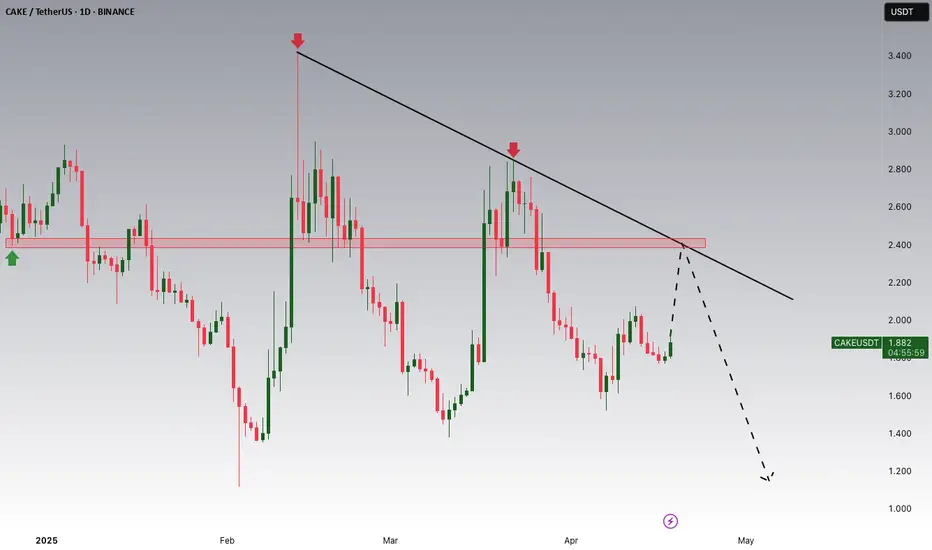
CAKEUSDT is currently trading within a well-defined downtrend, consistently forming lower highs and lower lows. The recent move appears to be a corrective rally, bringing price back toward a key daily resistance zone around 2.40, which also aligns with the descending trendline.
I’m monitoring this area closely for potential bearish price action to develop, signaling a continuation of the dominant bearish trend.
Key Confluences:
Major daily resistance at 2.40
Approaching descending trendline
Market still in a clear downtrend
Possible lower high formation in progress
Trade Plan:
If I see bearish confirmation in this zone (e.g. rejection candles, bearish structure break on lower timeframes, or weakening momentum).
A strong break and hold above 2.40 would invalidate the setup!
Is BTC Set up for a fall today? (17/04/2025)BTC has been ranging since last Friday and therefore the price action has been very tight but one candle has given us a clue about the possible next direction.
This has been highlighted by the red arrow. This 2H candle is a bearish engulfing candle, which as a single candle is bearish.
Since that candle was printed, the price has currently retraced into that candles range but has failed to break over it.
I am speculating that this is a failed high.
The blue arrow points to a wick on a subsequent 2H candle which signifies bullish exhaustion and a rejection of that 85000 price level.
The Green lines represent the High and Low price of the most recent 7H candle.
The Orange lines represents the High and Low price of yesterday's Daily candle.
The Red line represents the High and Low price of last week's candle.
There is a purple target beside a 2h FVG that I believe that market could be targeting alongside last weeks low.

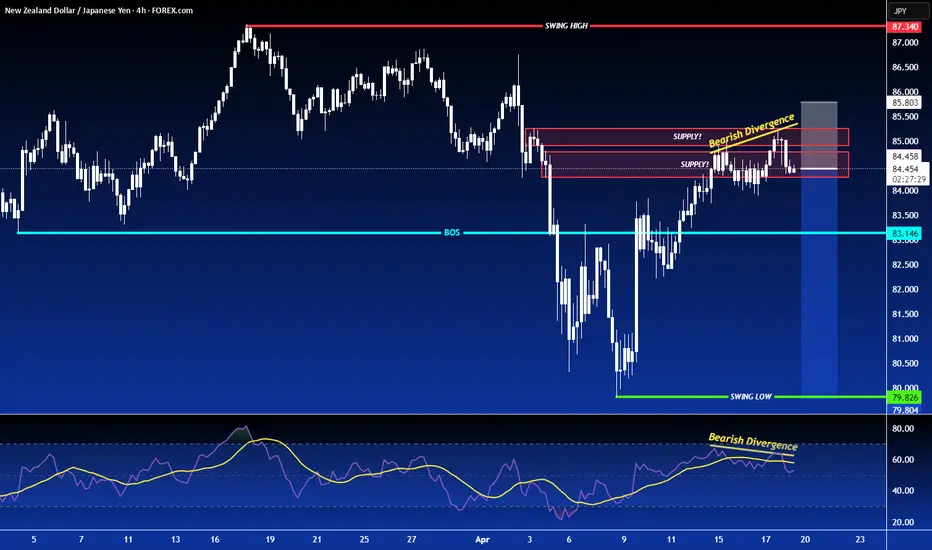
SHORT ON NZD/JPYNZD/JPY is in a overall downtrend.
Price has completed its pullback phase to a key supply area and has created bearish divergence.
I expect price to drop to the next support level which was the previous low it created. (green line).
I am aiming to make 300-400 pips
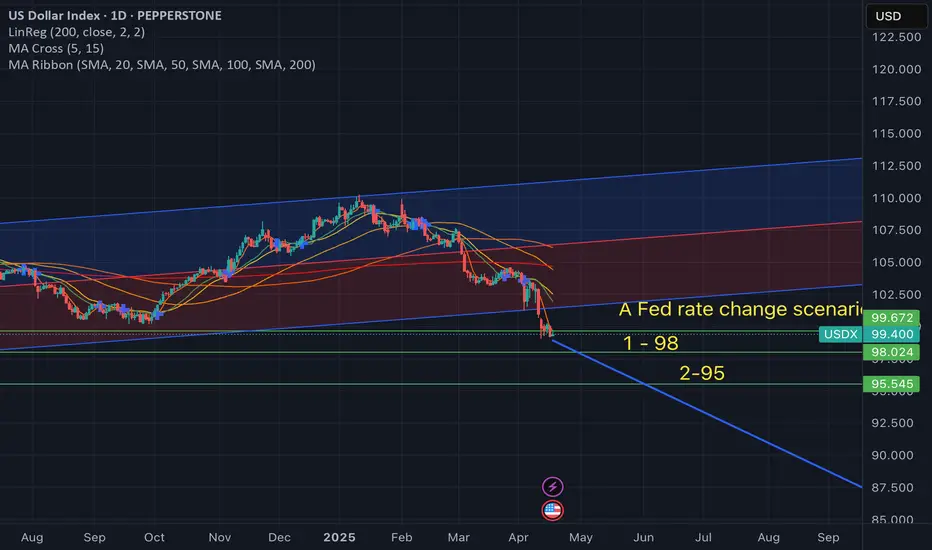
Global Market Overview. Part 1: USDXThe Dollar Index is drifting at the key 99.5 mark. This strategic support level, which has held since early 2024, is on the verge of collapsing.
Let’s be clear: this isn’t just about the strength of the dollar. What’s at stake is the monetary sovereignty of the United States, caught between inflation, politics, and election-season hysteria.
And make no mistake — this has nothing to do with technical analysis. What we’re witnessing is a fundamental fire, and Donald Trump and his administration are fanning the flames.
Powell: “Rates remain unchanged.” But for how long?
Just days ago, Fed Chair Jerome Powell delivered what seemed to be a firm message:
“We are in a wait-and-see mode. Cutting rates prematurely could do harm.”
“If inflation accelerates, more difficult decisions may follow.”
On the surface — classic hawkish rhetoric. But in reality, this isn’t resolve.
It’s a delay tactic. Even Powell admits:
“The labor market is walking a fine line.”
“Economic growth weakened in Q1.”
“Business sentiment is deteriorating.”
“Tariff policy could lead to stagflation.”
“Political pressure is mounting by the week.”
The Fed says, “It’s too early to cut rates.”
But the market hears something entirely different: “We’re getting close.”
Trump applies pressure
Ahead of the elections, Trump declares:
“If we don’t cut rates now, we’ll lose to China, Europe, and our own markets.”
This isn’t just campaign rhetoric. It’s an open challenge to the Fed’s independence.
And history already tells us what happens when Trump applies pressure — 2019 rate cuts proved he can break through Powell’s defenses.
What the charts are saying
The Dollar Index (USDX) is locked in a persistent downward channel.
The 103.0 support zone has been broken
The 101.17 level remains the final significant support
99.5 is already being tested as a potential sell-off trigger
Below that — only air until 98.0 and 97.5
The technical setup confirms a fundamental truth:
The market no longer believes in the dollar’s strength.
What if the Fed actually cuts rates?
If the Fed moves to cut, USDX will break below 99 and enter a systemic phase of weakening.
Capital will flow into gold (as if it hasn’t already gone far enough), oil, crypto, and high-yield emerging markets.
The United States will lose its competitive edge in monetary policy,
and the dollar will slowly cease to function as the global anchor it once was.
Powell can talk tough all he wants. The market is no longer listening.
The Dollar Index isn’t dropping because rates are already cut — it’s falling because everyone knows it’s just a matter of time.
U.S. monetary policy has lost the initiative, and market expectations have taken over.
Today, the Fed rate is no longer a tool of control. It’s a signal of approaching capitulation.
The question is no longer “Can we hold 99.5?”
The real question is: “What happens after it breaks?”
Manipulation or strategy? Black swans on a leash
Powell’s rate policy, DXY charts, inflation forecasts — all of it loses clarity when the dominant market force is no longer economics, but politics.
We live in an era where markets break not from bad data, but from tweets, briefings, and backroom deals — moves that only reveal themselves in the charts after the fact.
That’s what makes the current cycle the most toxic in the last 15 years.
Markets aren’t just volatile — they’ve become irrational.
Trade war: scalpel in a surgeon’s hand or a bat in a brawler’s grip?
Tariffs aren’t new.
But in Trump’s hands, they’ve evolved — from macroeconomic tools to blunt political weapons.
He uses them as battering rams — to force concessions, corner opponents, and set up ideal conditions for insider gains.
The market reacts exactly as you’d expect:
Tariffs announced — indexes fall
Panic ensues — capital flees into dollars and gold
Within 48 hours — videos surface of Trump and his allies joking about the “hundreds of billions” they made during the crash
This isn’t conspiracy.
It’s already triggered official investigations, but everyone knows: the odds of accountability are near zero.
And that’s the biggest risk for fundamental analysis today:
It’s powerless against narratives crafted behind closed doors.
So who’s really running the market?
Trump is deliberately deflating the bubble. Loudly. Dramatically. On camera.
But the goal isn’t destruction. It’s control.
And while Powell fears making a mistake, Trump fears only one thing — losing control of the narrative.
The market is no longer a field for rational actors.
It has become a battlefield, where officials already understand:
You can control more than just money through the market — you can shape public consciousness.
How not to lose your footing in this chaos?
We’ll break it down in the next part of the Global Market Overview. Stay tuned.
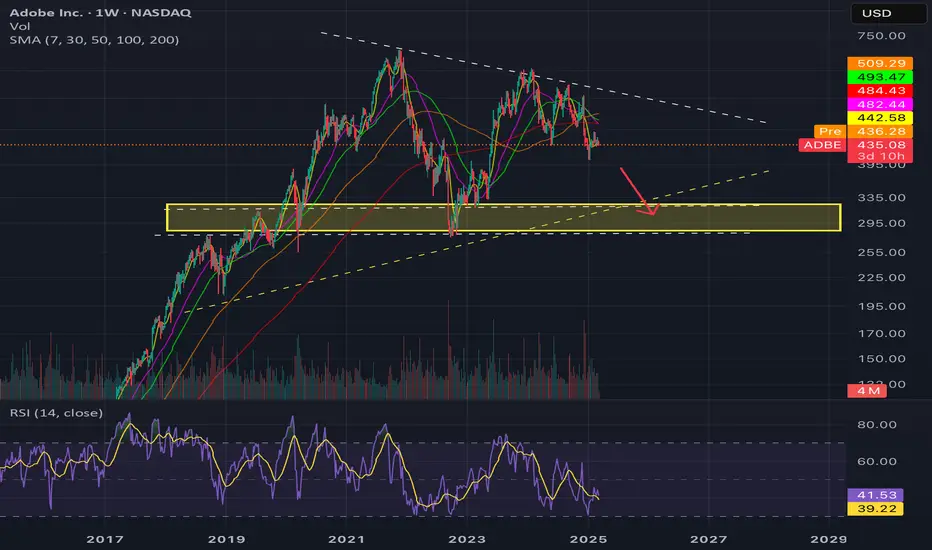
$ADBE deteriorating MOAT ; Still Expensive; PT < $350- NASDAQ:ADBE is one of the blue chip company of the last decade.
- However, Chicken has come to roost.
- Core products of NASDAQ:ADBE like acrobat are useless. One can use ChatGPT or any AI tool to parse and get the information. Google Doc for creating a PDF
- Adobe designer tool might still be used but AI tools are taking over which provides done for you. Apart from that Canva & Figma are way better and easier to use NASDAQ:ADBE
- NASDAQ:ADBE products are hard to use and have huge learning curve. On top of that, NASDAQ:ADBE engages in shady subscription practices where it doesn't let user cancel subscription and ask people to go through customer support potentially delaying cancellation to bill users.
- NASDAQ:ADBE despite having huge datasets of images isn't able to launch a good AI model. Firefly by Adobe is Joke and not good enough.
Fundamentally, it is still trading at a premium.
Year | 2025 | 2026 | 2027 | 2028
EPS | 20.39 | 23.01 | 25.56 | 27.02
EPS % growth | 11.61% | 12.82% | 11.11% | 5.72%
Base Case ( Lenient ):
Ideally, for a blue chip company with a MOAT growing EPS at 11-15% ; Failr forward P/E should be 20. For them, who are willing to pay forward p/e of 20
Year | 2025 | 2026 | 2027 | 2028
Stock price (F. p/e = 20) | 407 | 460 | 500 | 540
Base Case ( conservative ):
However, I believe NASDAQ:ADBE MOAT has been severely challenged and should doesn't command a premium multiple. Therefore, according to me, fair forward p/e should be 15
Year | 2025 | 2026 | 2027 | 2028
Stock price (F. p/e=15) | 305 | 345 | 383 | 405
Extreme Bear Case :
If we account for recession, We could see further compression in forward p/e ~ 10. Extreme bear case, where they miss EPS or revenue or both and guide lower.
Year | 2025 | 2026 | 2027 | 2028
Stock price (F. p/e=10) | 200 | 230 | 255 | 270
Bull Case ( F. p/e = 25 )
Year | 2025 | 2026 | 2027 | 2028
Stock price (F. p/e=25) | 509 | 575 | 639 | 675
Amazon losing weekly trendline – watch these Fibo levels nextTechnical Analysis
Amazon (AMZN) has broken below its weekly ascending trendline and failed to reclaim the key 0.618 Fibonacci level (180.52). Strong bearish volume and a weakening RSI suggest downside continuation. Key support targets lie at 161.55, 151.21, and 142.58, with extended downside to 119.12.
Fundamentals
Macro pressure from high interest rates and a slowdown in consumer spending weighs on Amazon. Intense competition in AWS and e-commerce adds uncertainty. Upcoming earnings may serve as a catalyst for directional clarity.
Scenarios:
Base case – move down toward 151.21, 142.58, 119.12
Bullish case – break above 180.52 → rally toward 207.52, 241.92

Potential medium-term trend continuation? If this is the case of a trend continuation, then this current price provides a decent opportunity for a little medium-term swing. We would need to await further sell confirmation for entries. Targets would be the previous swing low at +-1.21000
I will update accordingly.
SHORT ON NZD/USDPrice is in a overall uptrend but has started its pullback phase from the high.
Got a choc (change of character) to the downside as well as equal highs/ double top forming.
Dollar news just came out positive and there is a good chance this pair could fall 200-300 pips by the end of the week.

SOL throwback short setup formingShort Entry : 133
TP : 122
SL : 136.5
My trading is based on momentum, and the chart said that SOL is going to retest the previous 4H breakout resistance.

AERGO: Golden Pocket Hit – Crash Incoming?On April 3rd, AERGO hit a historic low of $0.04746—and just 13 days later, it's trading around $0.60, an astonishing +1500% surge in less than two weeks. The rapid rise begs the question: What are the bulls aiming for next, and how sustainable is this move?
Key Observations:
Explosive Rally:
AERGO’s meteoric move from $0.04746 to $0.70 in just 13 days has propelled the coin into uncharted territory. Such a dramatic spike is not only eye-catching but also raises concerns about overextension.
RSI Overbought:
The daily RSI sits at 98, indicating extreme overbought conditions. This level suggests that the current rally is unsustainable and may be ripe for a pullback.
Historical Resistance Levels:
Looking back at 2021, key highs were established around $0.60 to $0.62. These levels serve as critical resistance zones.
Fibonacci Confluence:
Taking the Fibonacci retracement from the low at $0.04746 to the previous rally's high at $1.0809 (April 13, 2024), the 0.618 level is projected at $0.68613. The bulls just tested that golden pocket.
Trade Strategy & Potential Setups:
For Longs:
With the market showing signs of being overbought (RSI at 98) and the explosive move possibly winding down, this may be the perfect opportunity to take profits rather than accumulate further.
Take Profit Consideration:
Target: Near the 0.618 fib retracement at $0.68613.
Observation: If bulls push beyond this level, the move might extend — however, the risk of a sharp pullback is high given current overbought conditions.
For Shorts:
A corrective move is very much on the table, and traders looking to short should focus on the key resistance zone between $0.60 and $0.70.
Short Setup:
Entry: Look to initiate shorts near the $0.60–$0.70 zone.
Target: $0.4 and $0.2 as take profit targets
The Big Question:
Will AERGO drop as sharply as it surged? Given the extreme overbought conditions and the rapid, unsustainable spike, a healthy—and perhaps brutal—correction seems very possible. Keep a close eye on volume and price action near the $0.60–$0.70 resistance zone and be ready to adjust positions accordingly.
Anyone riding this wave has experienced one of the wildest moves in recent memory. For those in long positions, consider taking profits now; for potential short traders, watch those key levels tightly. The market's rhythm will soon reveal its next chapter.

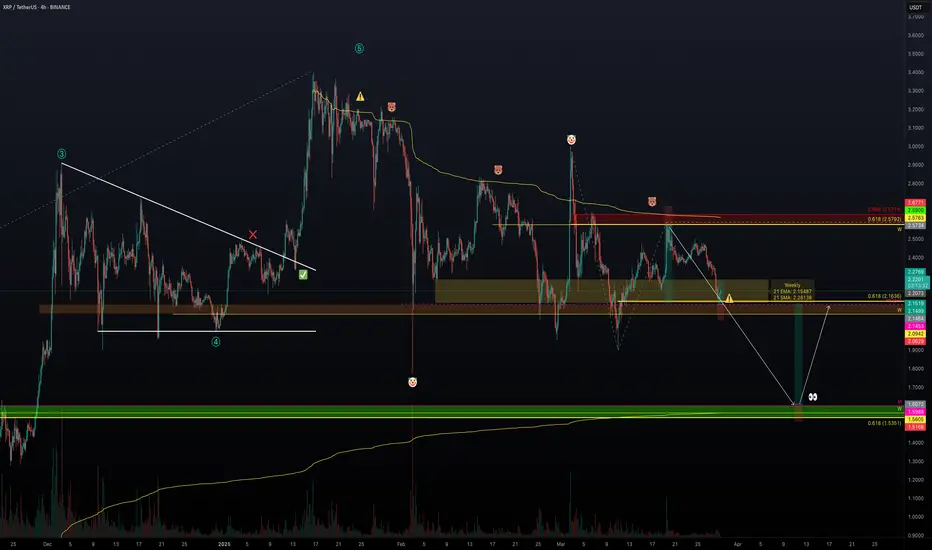
XRP - Choppy Market, Will We See $1.5 Again?After finishing the 5-wave structure in early 2025, XRP had a rough patch, trading between $3 and $2 and offering some pretty neat swing trade opportunities. Now, two months later, the big question is: will this range continue, or is a breakout on the horizon? Let’s break down the key levels and high-probability setups.
Short Trade Setup
Resistance Zone:
The weekly level and the 0.618 Fibonacci retracement are both around $2.5763 to $2.5792, aligning nicely with each other.
The anchored VWAP from the all-time high at $3.4 adds extra resistance at about $2.63.
Setup Details:
A low-risk short trade can be considered at the weekly level, with a stop-loss set above both the anchored VWAP and the swing high.
Target: The monthly open, aiming for an R:R of about 4:1.
Support Backup:
Additional support in this range comes from the 0.618 Fibonacci retracement (from a low at $1.9 to a high at $2.59), the weekly 21 SMA at $2.28, and a weekly level at $2.0942 just below the monthly open.
This support between the weekly level at $2.0942 and the monthly open is crucial for maintaining bullish momentum. If it holds, the bearish short setup stands; if it breaks, things could get tricky.
Long Trade Setup
When to Consider a Long:
If the support zone mentioned above fails, look for a long trade opportunity at the swing low around $1.77.
Support Confluence:
Primary Support: The swing low at $1.77, with lots of liquidity around that area.
Additional Layers:
The monthly level at $1.5988.
The weekly level at $1.5605 sits just below the monthly.
The 0.618 Fibonacci retracement from the 5-wave structure at $1.5351.
Anchored VWAP from the low at $0.3823, aligning with the weekly level.
And don’t forget the psychological level at $1.5.
Setup Details:
This long trade setup would offer an attractive R:R of roughly 6:1, targeting back to the monthly open for an approximate 33% gain, with a stop-loss placed below the $1.5 mark.
XRP's current trading range has provided some good short and long trade setups, a long opportunity at the swing low ($1.77-$1.5) could be the next big play. Whether you lean towards short or long, finding these confluence zones helps in making more informed, high-probability trade decisions.
If you found it helpful, please leave a like and a comment. Happy trading!
XRP/USDT I Reverse Short Squeeze Alert! Resistance at 2 USDTHey Traders after the success of my Previous trade this month on NASDAQ:HOOD hitting Target 1 & 2 in 2 days more than 16%+
With a Similar Trade setup But Crypto I bring you today
BINANCE:XRPUSDT
Short opportunity
- Market structure
- Head and shoulder pattern
- Currently will be trading at supply zone which was a recent support and now an ideal place for a reversal which is taking place as we speak- 4 Hour TF.
- Breakdown and retest
- Risk Aversion Dynamics in Cryptocurrency Markets
PROTIP/-
Entry on Bearish candle stick pattern on Current Levels
Stop Loss : 2.2292
Target 1 : 1.4707
Target 2 : 1.0507
Technical View
The orange circle marks a double top within the supply zone, acting as the shoulders of a larger head and shoulders pattern, suggesting strong resistance.
Bearish Trendline
breakdown + Retest
Risk Aversion Dynamics in Cryptocurrency Markets
Fundamental View - How Current Affairs can effect this pair!
The proposed imposition of significant tariffs, such as the 60% levy on Chinese imports suggested by former U.S. President Donald Trump, could trigger a chain reaction across global markets. This scenario would likely amplify risk aversion among investors, potentially catalyzing a sell-off in risk-sensitive assets like XRP (Ripple) in favor of perceived safe havens such as the U.S. dollar (and by extension, Tether/USDT). Below, we analyze the mechanics of this relationship and its implications for the XRP/USDT trading pair.
1. Tariff Escalation and Its Macroeconomic Consequences
1.1 Direct Impact on China’s Economy
A 60% tariff on Chinese exports to the U.S. would directly reduce China’s export competitiveness, potentially lowering its GDP growth by 1.5–2.5 percentage points annually, according to UBS economists. This slowdown would exacerbate existing vulnerabilities in China’s economy, including a property market crisis, weak domestic demand, and deflationary pressures (June 2024 CPI: 0.2% YoY). Reduced economic activity in China—the world’s second-largest economy—could dampen global trade volumes and commodity prices, indirectly affecting risk sentiment in financial markets.
1.2 Global Spillover Effects
The UBS analysis highlights that retaliatory measures by China or other nations could amplify trade fragmentation, further destabilizing supply chains and corporate earnings. For example, the April 2025 announcement of 25% U.S. tariffs on automotive imports triggered a 2.9% drop in the S&P 500 and a 5–7% decline in major Asian equity indices. Such volatility often precedes broader risk aversion, as investors reassess exposure to growth-dependent assets.
2. Risk Aversion Dynamics in Cryptocurrency Markets
2.1 Flight to Safety and USD Appreciation
During periods of economic uncertainty, capital typically flows into safe-haven assets like U.S. Treasuries and the dollar. Tether (USDT), a stable coin pegged 1:1 to the USD, often benefits from this dynamic as crypto traders seek stability. For instance, Bitcoin’s role as a “weak safe haven” for the USD in acute crises suggests that stable coins like USDT could see increased demand during tariff-induced turmoil, while altcoins like XRP face selling pressure.
2.2 XRP’s Sensitivity to Risk Sentiment
XRP, unlike Bitcoin, lacks established safe-haven credentials. Its price action in Q2 2025 exemplifies this vulnerability: a 7.5% decline over 30 days (peaking at 2.57 USDT on March 19 and bottoming at 1.64 USDT on April 7). This volatility aligns with broader patterns where altcoins underperform during risk-off periods. A global slowdown would likely intensify this trend, as retail and institutional investors reduce exposure to speculative crypto assets.
3. Mechanism: From Tariffs to XRP/USDT Price Decline
3.1 Investor Behavior in Risk-Off Environments
Tariff Announcements → Equity Market Sell-Off: The April 2025 auto tariffs caused a 6–7% drop in Asian equities, signaling growing risk aversion.
Liquidity Reallocation: Investors exit equities and crypto (including XRP) to hold cash or cash equivalents like USDT.
USD/USDT Demand Surge: Increased demand for USD lifts USDT’s relative value, pressuring XRP/USDT downward.
3.2 Technical and Fundamental Pressure on XRP
Supply-Demand Imbalance: As sellers dominate XRP markets, the token’s price in USDT terms declines. The 14.56% 90-day volatility in XRP/USDT suggests heightened sensitivity to macroeconomic shocks.
Liquidity Crunch: A broader crypto market downturn could reduce trading volumes, exacerbating price swings.
4. Historical Precedents and Limitations
4.1 Bitcoin’s Mixed Performance as a Hedge
While Bitcoin has shown limited safe-haven properties for the USD in short-term crises, its decoupling from altcoins like XRP during stress periods is well-documented. For example, Bitcoin’s 40% rebound post-COVID crash contrasted with XRP’s prolonged slump in 2020–2021.
4.2 Mitigating Factors
Stimulus Measures: If China implements aggressive fiscal stimulus, as UBS posits, a partial recovery in risk appetite could cushion XRP’s decline.
Crypto-Specific Catalysts: Regulatory clarity or Ripple-related developments (e.g., SEC case resolutions) could counteract macro-driven selling.
5. Conclusion: Bearish Outlook for XRP/USDT in Tariff Scenario
In a tariff-driven slowdown, the XRP/USDT pair faces downward pressure due to:
Risk Aversion: Capital rotation from crypto to stable coins.
USD Strength: USDT demand surges as a proxy for dollar safety.
Altcoin Underperformance: Historical precedent of XRP lagging during macro stress.
People interested should monitor China’s policy response and U.S. tariff implementation timelines, as these factors will determine the severity of XRP/USDT’s downside. A breach below the April 7 low of 1.64 USDT could signal prolonged bearish momentum.
This analysis synthesizes macroeconomic triggers, market psychology, and cryptocurrency-specific dynamics to outline a plausible pathway for XRP/USDT depreciation amid escalating trade tensions.
Not An Investment Advise

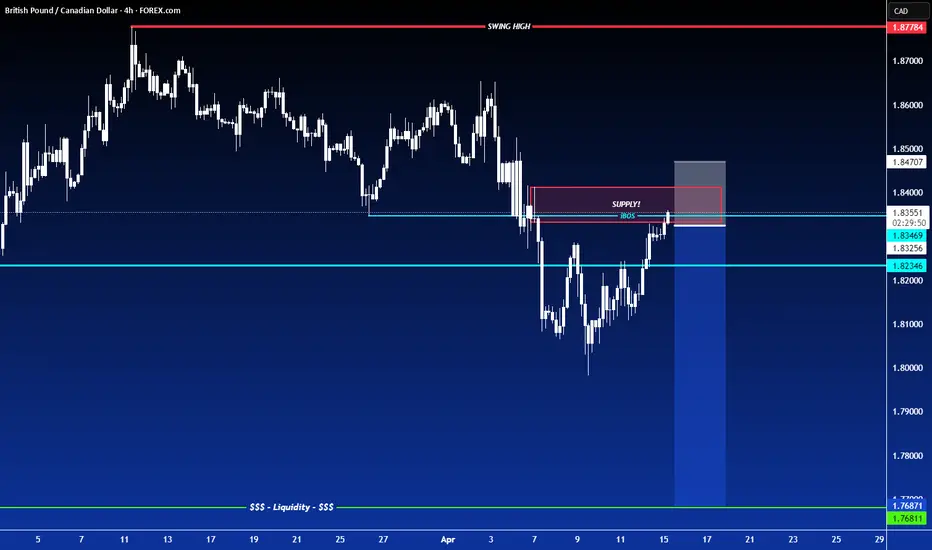
SHORT ON GBP/CADGBP/CAD is currently in the pullback phase of its overall uptrend.
Its has given a perfect BOS (break of structure) to the downside followed by a perfect retest of the supply area that created the BOS.
I will be selling GBP/CAD to the next demand level for a 500-600 pip move.
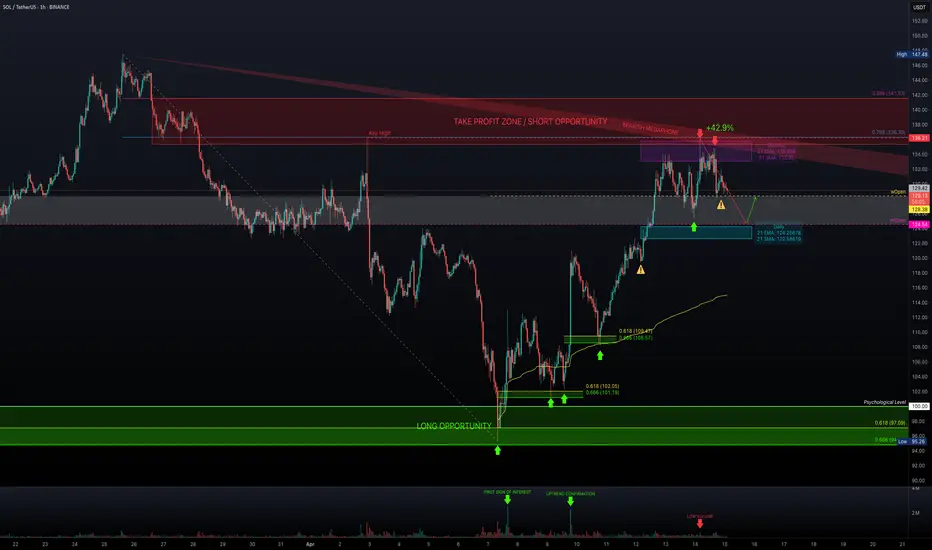
SOL Bulls Strike Back — But Is It Sustainable?Solana continues to respect technicals with precision — after a +42.9% move from the $95 low, we're now at a pivotal moment in price structure. Let’s break down what’s happening and where the high-probability setups lie.
📍 Key Bounce Zone – Golden Pocket Confluence
Local Low: $95.26
Golden Pocket Zone (0.618–0.666): $97.09–$94.82
This area acted as a major demand zone, with price sharply rebounding.
First Volume Spike: Followed by retracement into Golden Pocket Zone at $102.
Second Volume Spike: Occurred right after touching Anchored VWAP ($108.21) from the $95.26 low, which added beautiful confluence with the Golden Pocket Zone – a secondary high-conviction long entry.
📈 Rally to Resistance – Short-Term Climax
After the anchored VWAP retest, SOL rallied into the key resistance zone aligned with the 0.786 Fib retracement from the previous down move — a historically reactive level and a prime profit-taking zone.
Monthly 21 EMA ($135.83) and the monthly 21 SMA ($133) — both key dynamic resistance zones.
Low-volume retest of that key high suggests buyer exhaustion, not continuation — a classic setup for a short-term reversal.
🧭 Current Market Structure
Current Price Action: Trading above both the weekly open ($128.38) and the monthly open ($124.54).
This forms a critical S/R zone between $124–$128, now acting as a potential battleground for bulls and bears.
As long as price stays above this zone, momentum remains with the bulls.
🔍 What to Watch Next – Reclaim or Reject?
Key Support to Watch:
$125 (psychological level) and monthly open at $124.54 – This zone is likely to be liquidity-hunted. Expect a sweep of this low, look for the reaction.
Daily Support Confluence: currently at 21 EMA: $123.77 & 21 SMA: $123.27
1.) 📈 Scenario A – Bullish Reclaim:
If SOL sweeps the low and shows strong buying reaction (bullish engulfing candle, volume spike), it sets up a potential long opportunity towards the weekly open, to watch for the next reaction.
2.) 📉 Scenario B – Failed Hold:
If there's no bullish reaction at $124–$125, expect further downside.
First target = $122
Second target = $120.65
🎯 Tactical Game Plan
Bulls:
Watch for reaction at $124–$125 – potential scalp long with tight SL.
Confirmation on volume expansion and break of $128.38 for continuation.
Re-enter long after clean retest of weekly open from above.
Bears:
Short setup possible if weekly/monthly open is broken and retested as resistance.
First TP = $122, second TP = $120.65.
Pop and Flop in GOOGL?Google recently staged a sharp rebound, filling the gap perfectly after a major sell-off driven by tariff-related headlines. While I had personally expected a deeper move into the $137.36–$135.41 range, price found strong buying interest earlier than anticipated.
The area we bounced from is significant—it's essentially the origin of the move that led to Google’s all-time high in 2024. However, despite the bounce, GOOGL has lost support across all timeframes , which shifts my focus toward potential short opportunities.
I’m now watching for a reaction around the support-turned-resistance zone near $164 . There’s an untested monthly level at $161.72 , which could trigger a reaction, but the area I’m really eyeing is the weekly resistance zone from $164 to $165.87 . I believe this range could act as a strong reversal zone and spark a deeper pullback.
If that rejection plays out, here are the levels I’m watching for downside targets:
- Target 1: $157.04 (daily support zone)
- Target 2: $146.75 (leg end and major weekly swing low from September 2024)
- Target 3: $141.55 (previous leg low)
- Final Target: New lows below $140.00
This short setup was far more appealing before the recent bounce off the $140 zone, so I will remain cautious. However, if price starts reacting from this resistance zone and breaks back below the monthly at $161.72 —or even more convincingly, the local daily support at $160.67 —that would trigger confirmation for continuation to the downside.
Invalidation levels:
- A weekly close above $165.03
- A daily close above $170.60
Either of those would invalidate the short thesis.

SHORT ON GOLD (XAU/USD)Gold has found a ceiling and has given a bit of a double top with a change of market structure from up to down.
Its currently retesting the supply area that provided the choc (change of character)
I will be selling gold to the next support level looking to make a $50 move which is 500 pips.
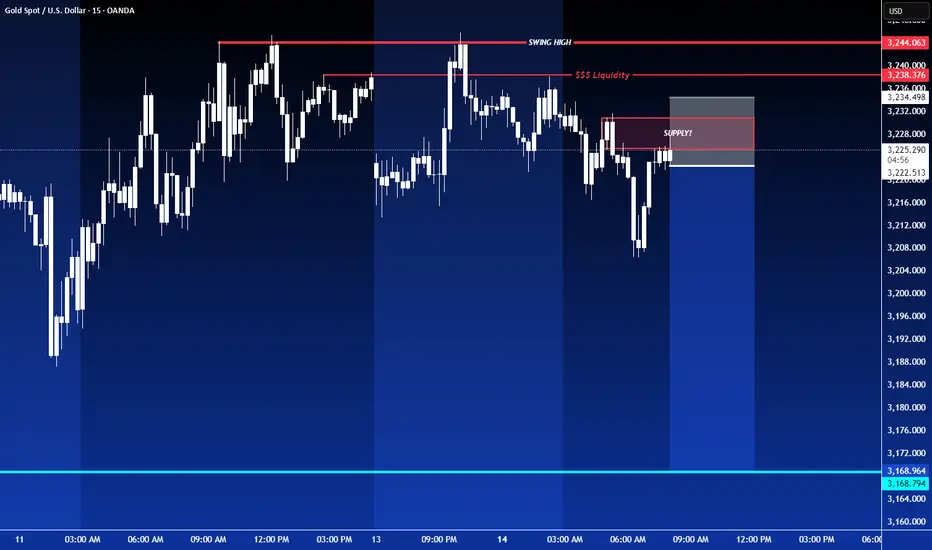
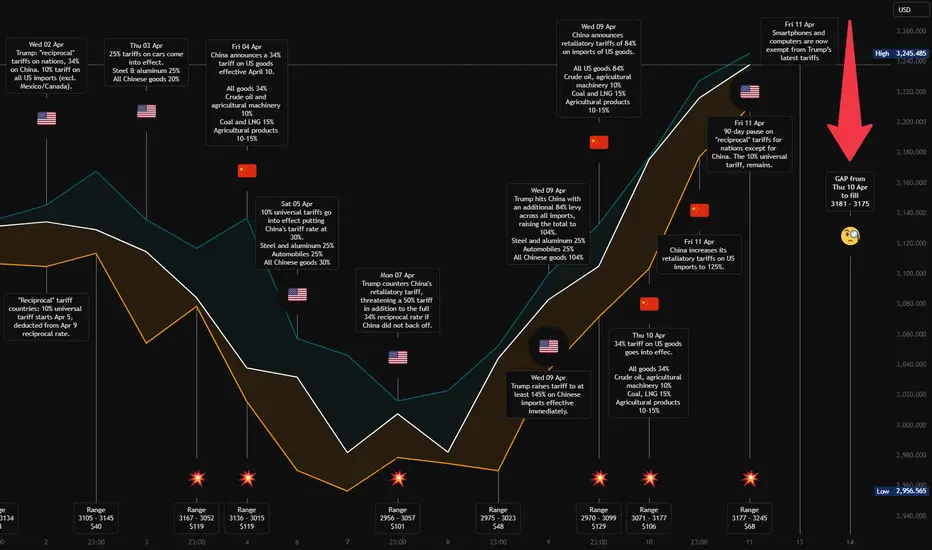
Idea for Mon 14 Apr - Gold Short – Bear in a Bull OutfitOANDA:XAUUSD
Gold has been heavily influenced by recent developments in the trade war.
A 90-day pause on tariffs (excluding China) and the exemption of smartphones and computers from tariffs were announced on friday.
These headlines may temporarily calm markets and give stocks room to rise — which typically puts pressure on gold. If Dollar is rising again, could be a side effect too.
This could lead to a short-term pullback in gold prices.
A price gap was formed around $3175.51 during the opening session on Thursday, April 10th.
After a small bounce, i expect gold to move downward to fill that gap.
A potential support level is sitting near $3156, which could act as a bounce zone.
"Next week it’s a bear inside a bull outfit."
Despite a broader bullish structure, we could see the week start with a correction. A classic gap-fill setup for the short-term traders.
RSI and MacD are on top levels, but for how long?
-------------------------------------------------------------------------
This is just my personal market idea and not financial advice! 📢 Trading gold and other financial instruments carries risks – only invest what you can afford to lose. Always do your own analysis, use solid risk management, and trade responsibly.
Good luck and safe trading! 🚀📊