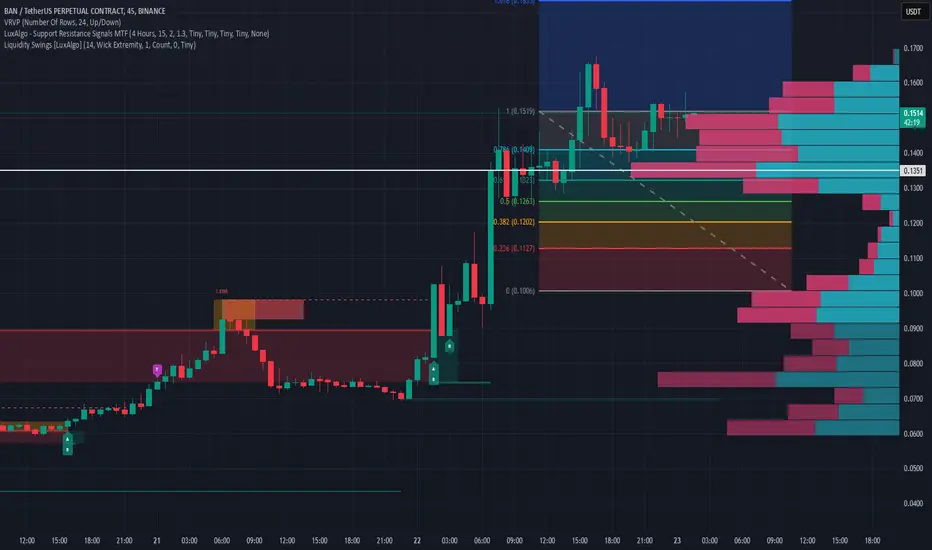
A big decline on BAN/USDT upcomingWhile every single indicator shows that BAN/USDT shows strong buy , our team diagree. Let's find out why..
Ban in the past 24hrs had a big pump of 120% , clear sign of manipulation..
Buyers started coming in and the coin will liquidate all of them..
A drop of 33% is expected from this coin..
Lets see if we are right on this one..
Shortsetup
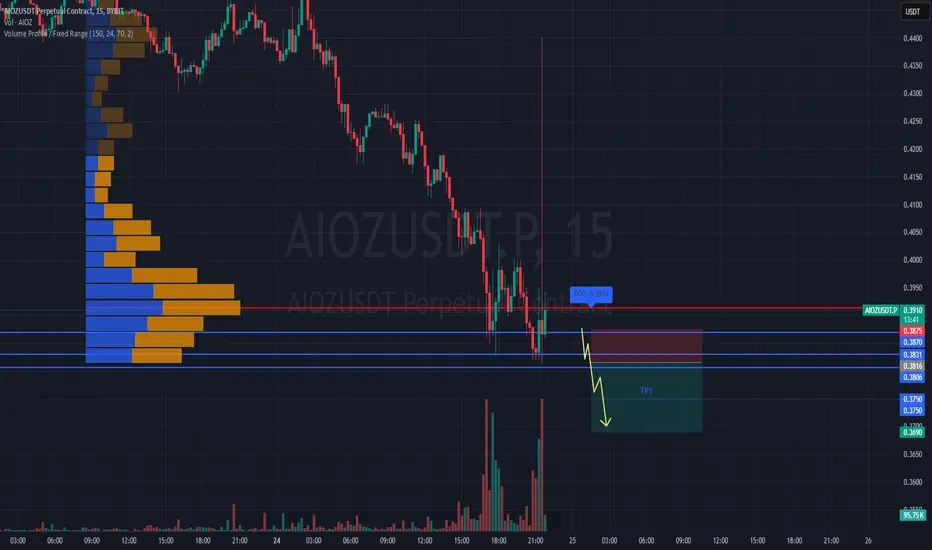
#AIOZUSDT maintains bearish momentum📉 SHORT BYBIT:AIOZUSDT.P from $0.3816
🛡 Stop Loss: $0.3875
⏱ 15M Timeframe
✅ Overview:
➡️ BYBIT:AIOZUSDT.P is trading in a downtrend, forming a series of lower highs and lower lows.
➡️ Volume Profile suggests that the main liquidity (POC) is positioned above the current price ($0.3919), indicating potential selling pressure.
➡️ A break below $0.3816 will trigger the short position, confirming buyer weakness.
➡️ The main downside targets are in the $0.3750 – $0.3690 range, where a short-term bounce may occur.
⚡ Plan:
➡️ Short entry upon breaking $0.3816, confirming bearish momentum.
➡️ Stop-Loss at $0.3875—placed above the nearest resistance level to minimize risk.
➡️ Main targets: $0.3750 and $0.3690, where downside movement may slow down.
🎯 TP Targets:
💎 TP 1: $0.3750
🔥 TP 2: $0.3690
🚀 BYBIT:AIOZUSDT.P maintains bearish momentum — expecting further downside!
📢 BYBIT:AIOZUSDT.P remains in a bearish trend, and a breakdown below $0.3816 will reinforce selling pressure.
📢 Watch for price reactions near $0.3690, where a slowdown or bounce may occur.
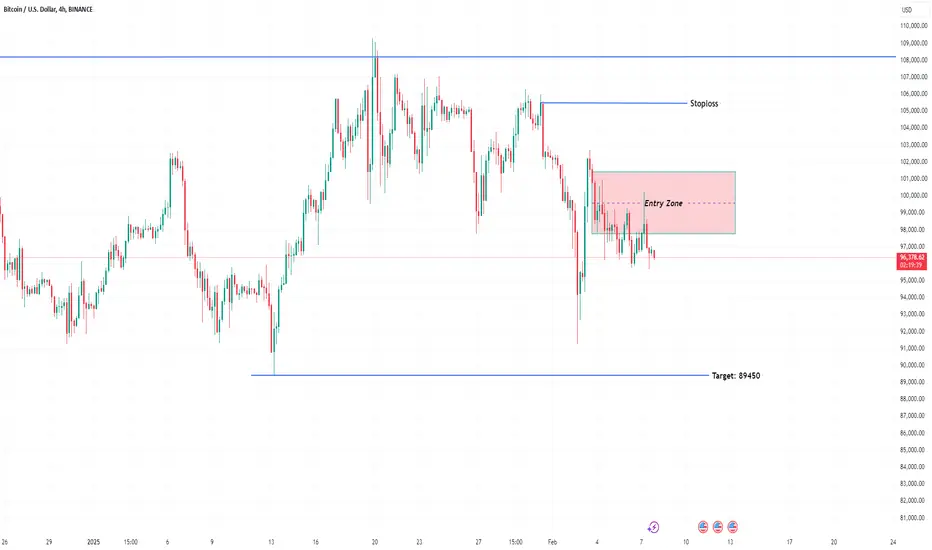
Bitcoin, No matter what going below $90,000Hello Guys, Wish you a Very Happy Valentines Week.
a Quick update on Bitcoin, i do not see any upward positive rally for next few weeks , my direction and target for the same is below $90,000.. a setup with entry stoploss and target is placed in the charts.
good luck and good trading :)
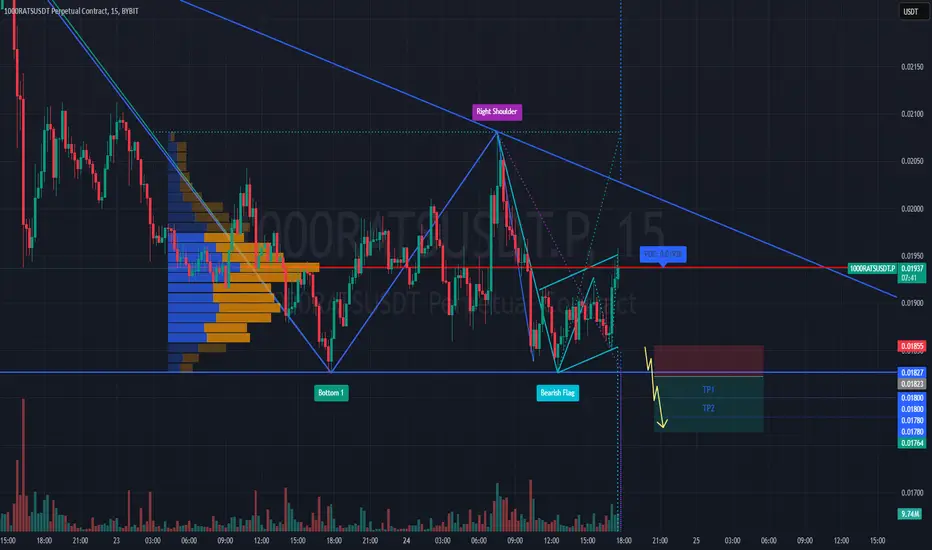
#1000RATSUSDT maintains bearish momentum📉 SHORT BYBIT:1000RATSUSDT.P from $0.01823
🛡 Stop Loss: $0.01855
⏱ 15M Timeframe
✅ Overview:
➡️ BYBIT:1000RATSUSDT.P is in a downtrend after rejecting the descending trendline, confirming buyer weakness.
➡️ Volume Profile suggests that the main liquidity (POC) is positioned at $0.01938, reinforcing selling pressure.
➡️ The Head and Shoulders pattern strengthens the bearish case, and a break below $0.01823 will trigger further decline.
➡️ The main downside targets are in the $0.01800 – $0.01764 range, where profit-taking may occur.
⚡ Plan:
➡️ Short entry upon breaking $0.01823, confirming the bearish scenario.
➡️ Stop-Loss at $0.01855—placed above the nearest resistance to minimize risk.
➡️ Main targets: $0.01800, $0.01780, and $0.01764, where downside movement may slow down.
🎯 TP Targets:
💎 TP 1: $0.01800
🔥 TP 2: $0.01780
⚡ TP 3: $0.01764
🚀 BYBIT:1000RATSUSDT.P maintains bearish momentum — expecting further downside!
📢 BYBIT:1000RATSUSDT.P remains weak, and a breakdown below $0.01823 could accelerate the decline.
📢 Watch for price reactions near $0.01764, where a slowdown or bounce may occur.
DEEP - Finding The Next Trade SetupDEEP recently took out the January 13, 2025 low at $0.12345 with a Swing Failure Pattern (SFP), followed by a successful retest. This led to a bounce that hit a key level at $0.12141, presenting a solid long opportunity with minimal risk.
After this, the market turned bullish, forming a 5-wave structure and rallying to the 0.786 Fibonacci retracement level at $0.18643 (measured from the $0.20473 high to the $0.11922 low). This was a key take-profit zone for longs and a great short opportunity.
Adding confluence, the anchored VWAP also acted as resistance just above at $0.19, offering another low-risk short setup. Additionally, a key resistance level at $0.1809 further reinforced the rejection zone.
Current Price Action & Short Setup
From the 0.786 Fib retracement, DEEP retraced 20% downward, nearly touching the 0.618 retracement of the 5-wave structure before bouncing. Now, price is finding resistance at the golden pocket (0.618 at $0.17347 and 0.666 at $0.17534) of the recent drop, aligning perfectly with the daily 21 EMA ($0.1757) and daily SMA ($0.17347).
This setup suggests an ABC corrective move is forming.
Using the trend-based Fibonacci extension, the 0.786 extension aligns with the 0.618 retracement at $0.1457, creating a strong short setup.
Short Entry: Between $0.17347 - $0.17534
Target: $0.1457 (0.786 trend-based Fib extension / 0.618 retracement)
Stop Loss: $0.1845
Risk/Reward: 2.5:1
There’s also potential to extend the target to the 1:1 trend-based Fib extension at $0.13733, but this would depend on price action.
Potential Long Setup
If price reaches the $0.1457 support zone, this could present a high-probability long opportunity.
Entry: Around $0.1457
Risk/Reward: 2:1 or better, but confirmation is needed before executing the trade

XAU / USD, recovery at the beginning of the week⭐️ Smart investment, Strong finance
⭐️ GOLDEN INFORMATION:
Gold price (XAU/USD) sees renewed buying interest during the Asian session on Monday but stays within its recent range near last week’s record high. Ongoing uncertainty over US President Donald Trump's trade tariffs and their global economic impact, coupled with broader risk aversion, supports the safe-haven metal. Additionally, geopolitical tensions and a weaker US Dollar further bolster demand for gold.
⭐️ Personal comments NOVA:
Gold price recovered positively at the beginning of the week, mainly sideways and accumulated below 2955
⭐️ SET UP GOLD PRICE:
🔥 BUY GOLD zone: $2916 - $2918 SL $2911
TP1: $2920
TP2: $2925
TP3: $2930
🔥 SELL GOLD zone: $2952 - $2954 SL $2959
TP1: $2948
TP2: $2940
TP3: $2930
⭐️ Technical analysis:
Based on technical indicators EMA 34, EMA89 and support resistance areas to set up a reasonable SELL order.
⭐️ NOTE:
Note: Nova wishes traders to manage their capital well
- take the number of lots that match your capital
- Takeprofit equal to 4-6% of capital account
- Stoplose equal to 2-3% of capital account
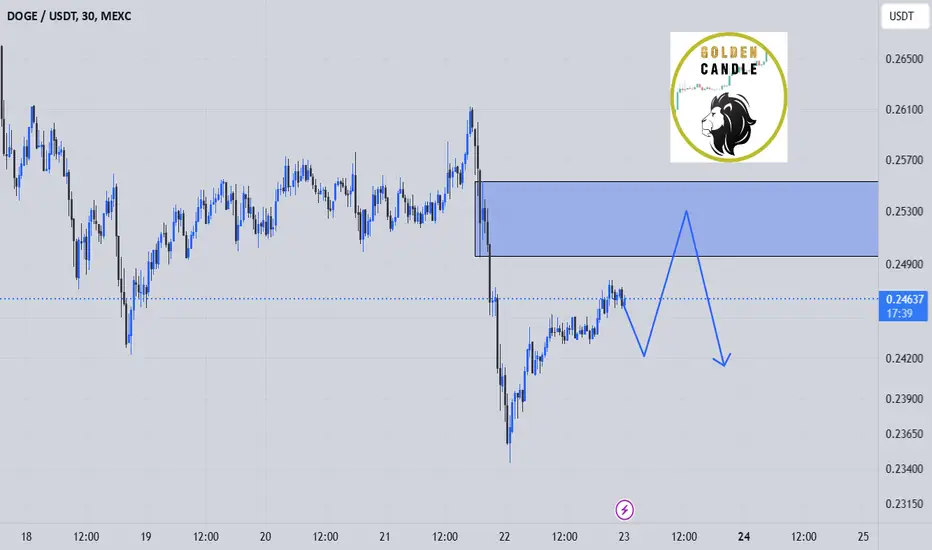
doge sell midterm"🌟 Welcome to Golden Candle! 🌟
We're a team of 📈 passionate traders 📉 who love sharing our 🔍 technical analysis insights 🔎 with the TradingView community. 🌎
Our goal is to provide 💡 valuable perspectives 💡 on market trends and patterns, but 🚫 please note that our analyses are not intended as buy or sell recommendations. 🚫
Instead, they reflect our own 💭 personal attitudes and thoughts. 💭
Follow along and 📚 learn 📚 from our analyses! 📊💡"
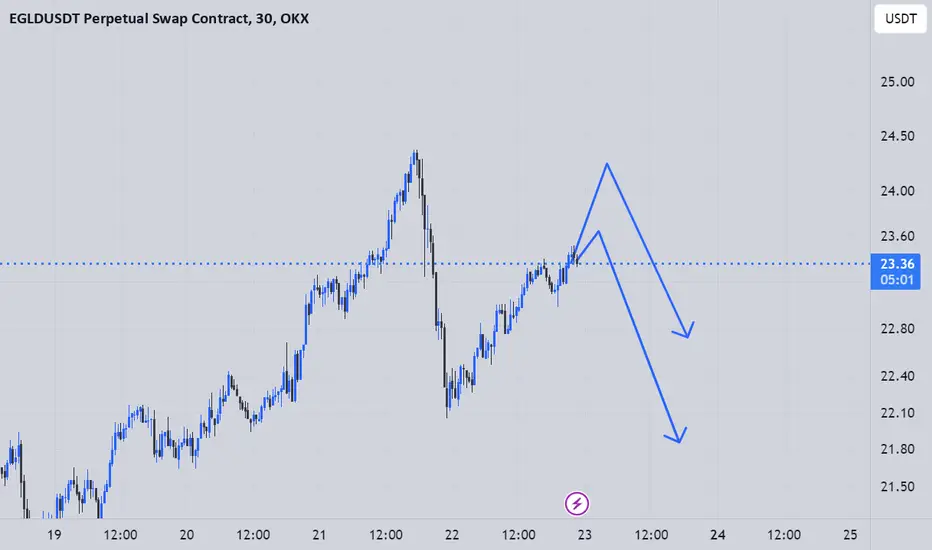
egld setup"🌟 Welcome to Golden Candle! 🌟
We're a team of 📈 passionate traders 📉 who love sharing our 🔍 technical analysis insights 🔎 with the TradingView community. 🌎
Our goal is to provide 💡 valuable perspectives 💡 on market trends and patterns, but 🚫 please note that our analyses are not intended as buy or sell recommendations. 🚫
Instead, they reflect our own 💭 personal attitudes and thoughts. 💭
Follow along and 📚 learn 📚 from our analyses! 📊💡"
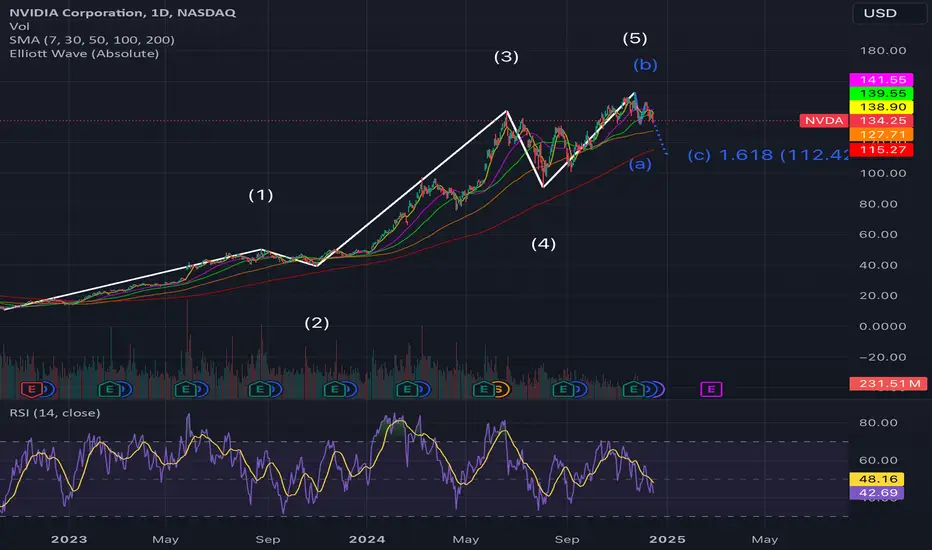
NVDA correction to $105-112 range- NVDA has completed it's motive wave 1-5 and currently is under corrective wave ABC.
- Within ABC leg, it's under the leg C where it will eventually find a bottom and then start fresh motive wave 1-5.
- Chart looks interesting and monitor carefully for the entry when it corrects!
#JAILSTOOLUSDT is showing weakness 📉 SHORT BYBIT:JAILSTOOLUSDT.P from $0.01194
🛡 Stop Loss: $0.01234
⏱ 15m Timeframe
🔹 Overview:
➡️ The price has broken a key support level and is trading below the POC zone ($0.01356), where the highest volume was accumulated.
➡️ A bearish trend is forming, with lower highs continuing to develop.
➡️ Selling pressure is increasing, indicating growing momentum from the sellers.
➡️ If selling activity persists, expecting further downside movement toward TP levels.
⚡ Plan:
➡️ Entering short below $0.01194, targeting profit at TP levels.
➡️ Expecting a breakdown confirmation and continuation of bearish momentum.
🎯 TP Targets:
💎 TP 1: $0.01152
📢 BYBIT:JAILSTOOLUSDT.P is showing weakness — preparing for further decline!

Next draw of liquidity: NzdUsd0.58083 is a weekly POI that have been respected before. I'm anticipating price to retest that zone again this week , hence anticipating the news (Existing Home Sales) by 10:00 New York time to push price to my point of interest and rejection kicks in.
Therefore this weekly candle might close with a rejection of that zone and next week would be bearish till we clear this week low 0.56779
I'm anticipating price to also clear previous week low (the monthly low) 0.55164 by next month.
Kindly boost if you find this insightful 🫴

RCI, Bear Flag On The Daily As Well As The 4hr Analyzing both the daily and 4-hour charts reveals a very prominent bear flag, which has formed following a steep decline. This pattern is often indicative of further downward movement, and it's hard to ignore the implications.
Word on the street is that they're currently in dire straits. Since the Shaw acquisition, they've hemorrhaged 11 billion in valuation. The situation is exacerbated by declining revenues and missed growth targets. In short, it's not looking promising.
If the trend continues downward, we might see the price testing the $19 USD mark sooner rather than later.
For those who are currently long on this or have any vested interest, it might be prudent to reconsider your position and cut your losses before it's too late.

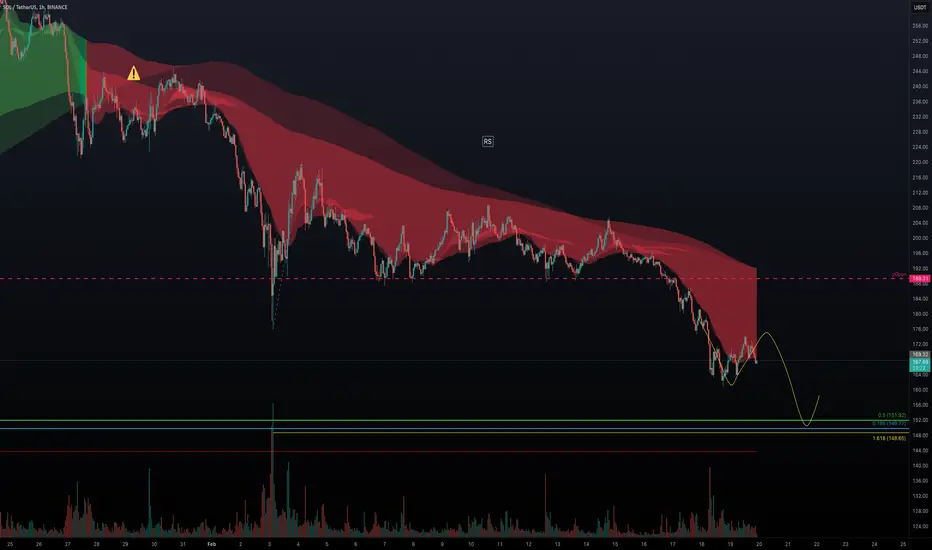
SOL on the Slide: Is a Bounce from $150 in the Cards?Solana has been in a downtrend for over 30 days after reaching its ATH at $295.83. For the past two weeks, SOL was stuck in a trading range that formed a descending triangle (a bearish pattern) which eventually broke down, confirming the downtrend. Additionally, SOL lost its yearly support level at $189.31. Where is SOL heading next? Let's find out!
Key Support Zone
Our main long opportunity is around the $150 level, where several confluences align:
Fibonacci Levels:
The 0.5 fib retracement of the entire 5-wave structure sits at $151.92.
The 0.786 fib retracement from the 5th wave is at $149.77.
A fib extension 1.618 of the descending triangle is at $148.65, which is very close to the $150 mark.
Volume Profile:
The Point of Control (POC), highlighted by the red horizontal ray, is around $144, adding another layer of support.
Trade Setup
Currently waiting for SOL to reach the support zone between $152 and $144. An alarm is set when price nears these levels for a long opportunity.
LTC short positionits a smal short position before a good pump
you can use candlestick patterns in lower timeframe for entry

Attempt to find ATH again for the 3rd time - gold price down⭐️ Smart investment, Strong finance
⭐️ GOLDEN INFORMATION:
US real yields, which move inversely to gold prices, rose 4.5 basis points to 2.086%, putting pressure on bullion.
Fed Governor Christopher Waller expects President Donald Trump's new trade restrictions to have only a minor effect on prices. Meanwhile, Philadelphia Fed President Patrick Harker reiterated his support for steady interest rates, noting that inflation remains high and persistent.
⭐️ Personal comments NOVA:
Gold returns to ATH 294x zone, 3rd attempt to create ATH but will continue to decrease, need more tax news in the near future
⭐️ SET UP GOLD PRICE:
🔥 SELL GOLD zone: $2942 - $2944 SL $2949
TP1: $2935
TP2: $2920
TP3: $2910
🔥 BUY GOLD zone: $2901 - $2899 SL $2894
TP1: $2906
TP2: $2915
TP3: $2925
⭐️ Technical analysis:
Based on technical indicators EMA 34, EMA89 and support resistance areas to set up a reasonable SELL order.
⭐️ NOTE:
Note: Nova wishes traders to manage their capital well
- take the number of lots that match your capital
- Takeprofit equal to 4-6% of capital account
- Stoplose equal to 2-3% of capital account

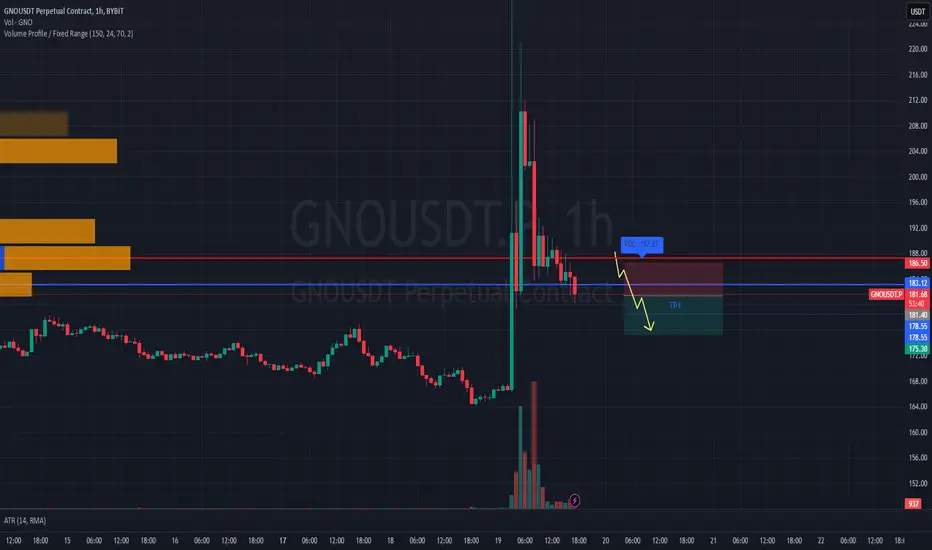
#GNOUSDT remains weak after a strong drop📉 SHORT BYBIT:GNOUSDT.P from $181.40
🛡 Stop Loss: $186.50
⏱ 1H Timeframe
✅ Overview:
➡️ BYBIT:GNOUSDT.P experienced a sharp rally above $210, followed by an equally strong pullback.
➡️ The POC (Point of Control) at $187.27 indicates the highest liquidity area, which serves as a strong resistance level.
➡️ Price is consolidating below $183.12, signaling potential seller dominance.
➡️ If $178.55 breaks downward, further decline toward $175.30 is expected.
⚡ Plan:
➡️ Enter short upon a confirmed break below $181.50.
➡️ Stop-Loss placed at $186.50, above the resistance zone.
🎯 TP Targets:
💎 Take Profit1- 178.55
🔥 Take Profit2- 175.30
🚀 BYBIT:GNOUSDT.P remains weak after a strong drop—expect further downside.
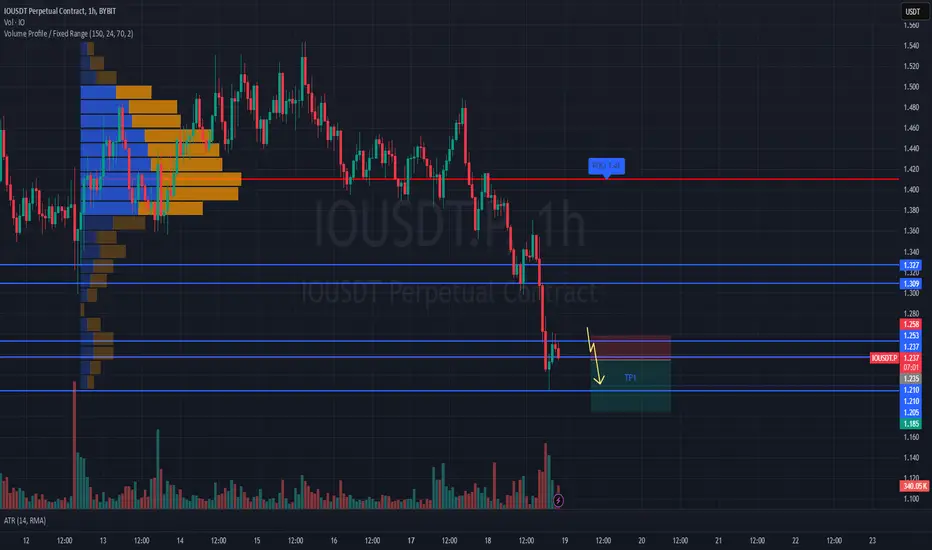
#IOUSDT remains under strong selling pressure📉 SHORT BYBIT:IOUSDT.P from $1.235
🛡 Stop Loss: $1.258
⏱ 1H Timeframe
✅ Overview:
➡️ BYBIT:IOUSDT.P continues its downward movement, trading near the $1.235 level, which acts as a potential breakdown zone.
➡️ The highest liquidity area (POC) is at $1.41, significantly above the current price, indicating strong seller dominance.
➡️ The price has broken a key support level, confirming the bearish trend.
➡️ If the price consolidates below $1.235, further declines to target levels are expected.
⚡ Plan:
➡️ Enter short below $1.235 upon confirmation of bearish momentum.
➡️ Risk management through Stop-Loss at $1.258 to protect against sudden reversals.
🎯 TP Targets:
💎 TP1: $1.210
🔥 TP2: $1.185
🚀 BYBIT:IOUSDT.P remains under strong selling pressure, and a breakdown below $1.235 could accelerate the downward move.
ES NQ AND RTY FUTURES QUICK OVERVIEW OF TODAY and LEVELS Areas of major interest from last nights and todays futures session. High probability levels to keep a close eye on for further developments.

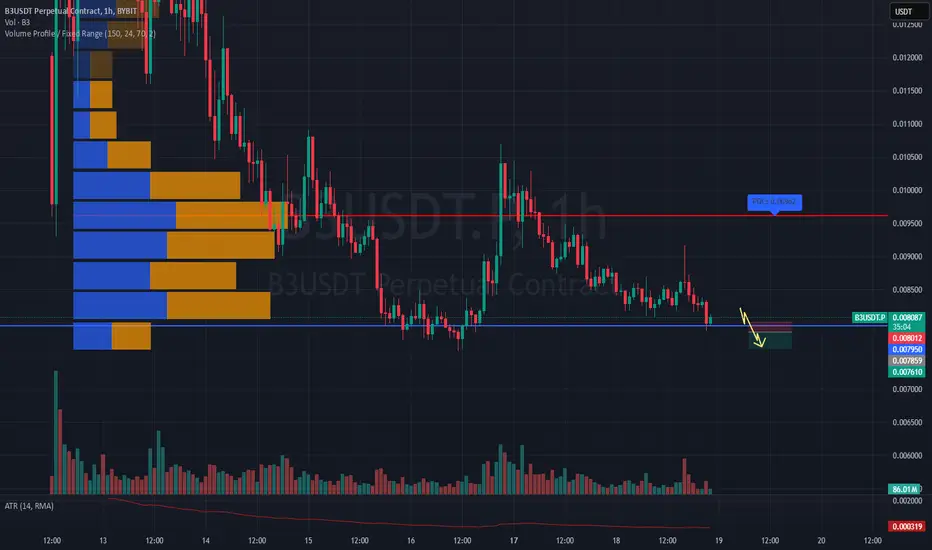
#B3USDT remains weak—expecting further decline!📉 SHORT BYBIT:B3USDT.P from $0.007859
🛡 Stop Loss: $0.008012
⏱ 1H Timeframe
✅ Overview:
➡️ BYBIT:B3USDT.P remains in a steady downtrend after retracing to the resistance level.
➡️ POC (Point of Control) at $0.00962 confirms seller dominance, and the current price trades below the high-volume area.
➡️ A break below $0.007859 opens the door for further downside as liquidity lies below.
➡️ If the price holds below this key level, a continuation of the decline is expected.
⚡ Plan:
➡️ Enter short below $0.007859 to confirm the bearish scenario.
➡️ Stop-Loss at $0.008012 to manage risk in case of an upward reversal.
🎯 TP Targets:
💎 TP1: $0.007610
🚀 BYBIT:B3USDT.P remains weak—expecting further decline!
📢 General advice on the asset:
Weak price action in BYBIT:B3USDT.P suggests continued downside potential. If the price breaks below $0.007859, it is likely to drop to $0.007610.
📢 However, a rebound above $0.008012 could lead to a short-term recovery.
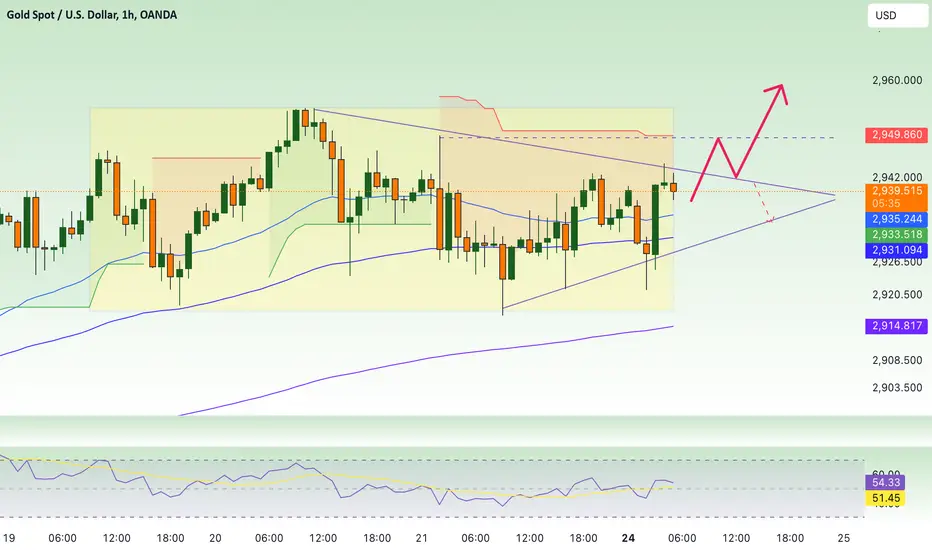
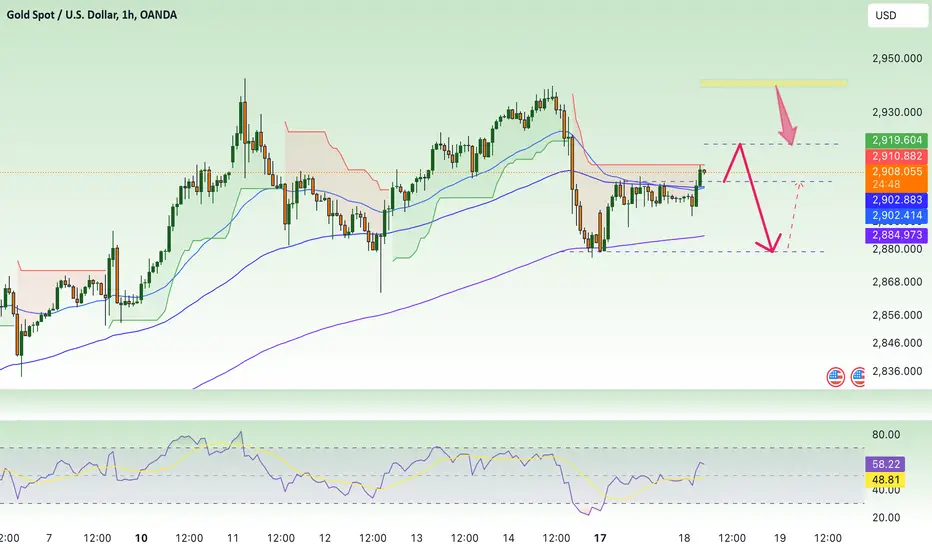
Gold short term recovery, bulls try⭐️ Smart investment, Strong finance
⭐️ GOLDEN INFORMATION:
US real yields, which typically move opposite to gold prices, fell by four basis points to 2.039%, providing support for XAU/USD.
Meanwhile, the World Gold Council (WGC) reported that central banks acquired over 1,000 tons of gold for the third year in a row in 2024. Following Trump’s election victory, central bank purchases soared by more than 54% year-over-year, reaching 333 tons, according to WGC data.
⭐️ Personal comments NOVA:
Short recovery at the beginning of the week, still in the accumulation process, no important news, gold is not affected too much
⭐️ SET UP GOLD PRICE:
🔥 SELL GOLD zone: $2916 - $2918 SL $2921 scalping
TP1: $2912
TP2: $2907
TP3: $2900
🔥 SELL GOLD zone: $2940 - $2942 SL $2947
TP1: $2930
TP2: $2920
TP3: $2910
🔥 BUY GOLD zone: $2878 - $2880 SL $2873
TP1: $2885
TP2: $2892
TP3: $2900
⭐️ Technical analysis:
Based on technical indicators EMA 34, EMA89 and support resistance areas to set up a reasonable SELL order.
⭐️ NOTE:
Note: Nova wishes traders to manage their capital well
- take the number of lots that match your capital
- Takeprofit equal to 4-6% of capital account
- Stoplose equal to 2-3% of capital account
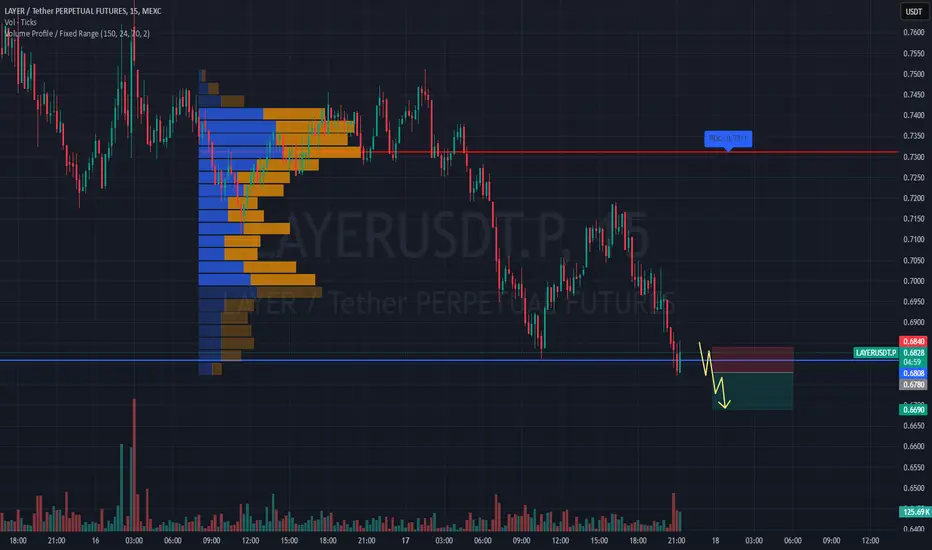
#LAYERUSDT remains weak — expecting further downside!This is a quick trade designed for a fast entry and exit with profit.
📉 SHORT #LAYERUSDT from $0.6780
🛡 Stop Loss: $0.6840
⏱ 15M Timeframe
✅ Overview:
➡️ #LAYERUSDT remains in a downtrend, trading near $0.6780, which could act as a short entry point.
➡️ POC (Point of Control) at $0.7316 confirms a high liquidity zone above the current price, indicating strong selling pressure.
➡️ The price failed to hold above the previous consolidation zone and continues downward.
➡️ If the price breaks below $0.6780, a further decline is expected, targeting lower support levels.
⚡ Plan:
➡️ Enter short upon breaking $0.6780, confirming the downward trend.
➡️ Risk management via Stop-Loss at $0.6840, protecting against a false breakout.
🎯 TP Targets:
💎 TP1: $0.6690
🚀 #LAYERUSDT remains weak—expecting further downside!
📢 #LAYERUSDT is under strong selling pressure. If the price breaks $0.6780, increased momentum may push it toward $0.6690. However, if it reclaims $0.6840, a short-term rebound could occur.
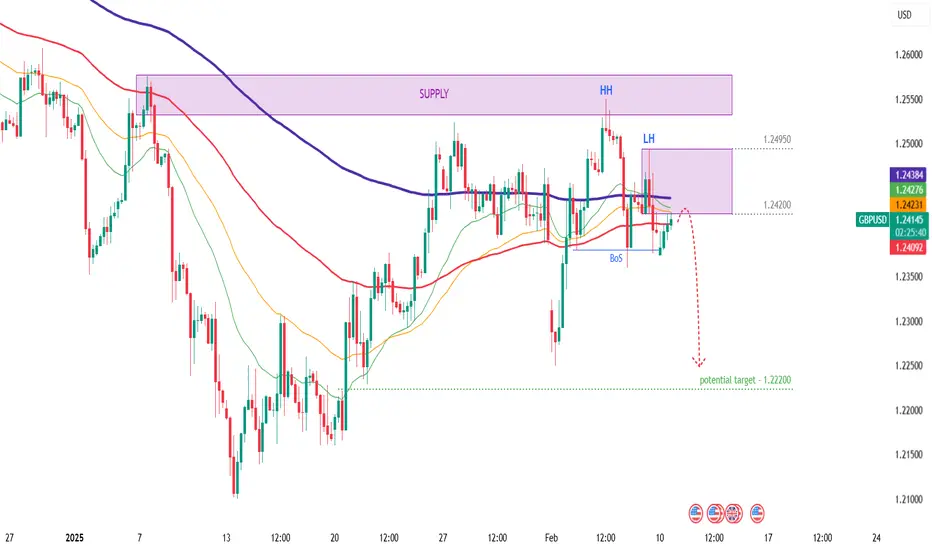
GBPUSD - Analysis and Potential Setups (Intraday- 10.02.25)Overall Trend & Context:
The OANDA:GBPUSD pair is in an overall downtrend on the higher time frames and lower time frames are in alignment.
Technical Findings:
Price broke below all EMA's - is now consolidating below.
Keep an eye on LTF supply levels between 1.24635 - 1.24530 (within 4h supply).
Bullish price action appears inherently weaker against the bears.
Potential Scenarios:
For now I will only be considering shorts.
Trade is active at 1.24150.
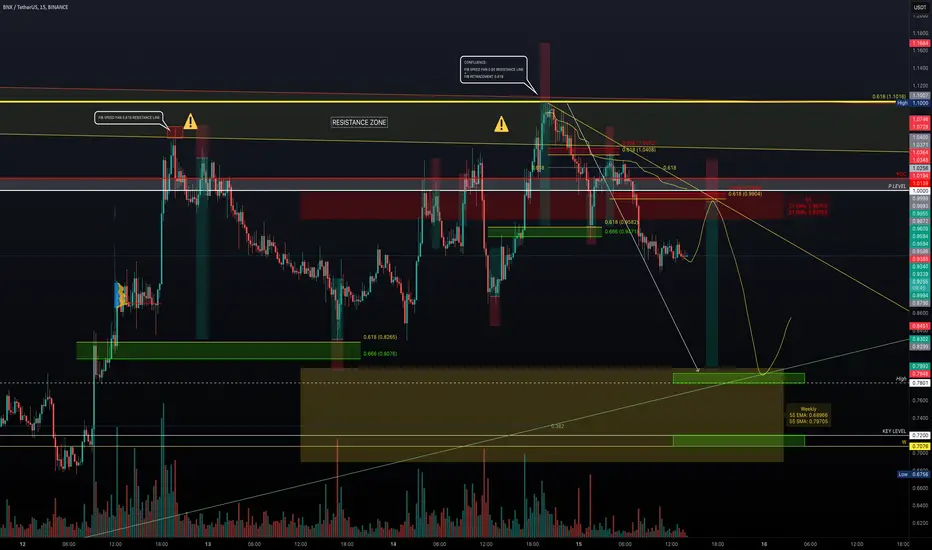
BNX Breakdown: The Next Trade SetupBNX has recently been testing a key resistance zone around the $1 level. After hitting the 0.618 Fibonacci retracement at $1.10, the market shifted into a downtrend. Let's analyse where our next trade opportunity might arise.
Market Structure & Confluence Zones
$1 to $1.1: BNX encountered robust resistance between $1 and $1.1, where the 0.618 Fib retracement aligns perfectly with the fib speed fan (0.618-0.65). Additionally, the anchored VWAP taken from the high at $1.1 aligns beautifully with the $1 mark, adding another robust layer of resistance. This convergence reinforces the strength of this zone and signals potential continuation of the downtrend.
Recent price action shows that BNX has repeatedly bounced off the 0.618/0.666 levels during small downward corrections.
Moving Averages on the 1-Hour Chart: The 21 EMA/SMA on the 1-hour timeframe is clustering between $0.97 and $1, providing additional confirmation of the resistance and offering an ideal entry region for short trades.
Primary Short Trade Setup
Given the multiple confluences around the resistance zone, our main focus is a short trade with a well-defined laddering strategy:
Entry Strategy (Laddering): Initiate short positions with staggered entries between $0.97 and $1.019. This dollar-cost averaging (DCA) approach allows for flexibility and optimises your entry as price tests the resistance zone.
Stop Loss (SL): Place your stop loss around $1.0375, just above the Point of Control (POC) or the previous high in this range to effectively manage risk.
Target: Aim for a profit target at $0.8. This target is supported by multiple technical indicators.
Risk/Reward Ratio: With these levels, you are looking at an approximate risk/reward ratio of 4:1 or better, depending on your specific DCA weighting.
Confirmation: As always, await confirmation through order flow analysis and the appearance of rejection candles at key levels before entering the trade.