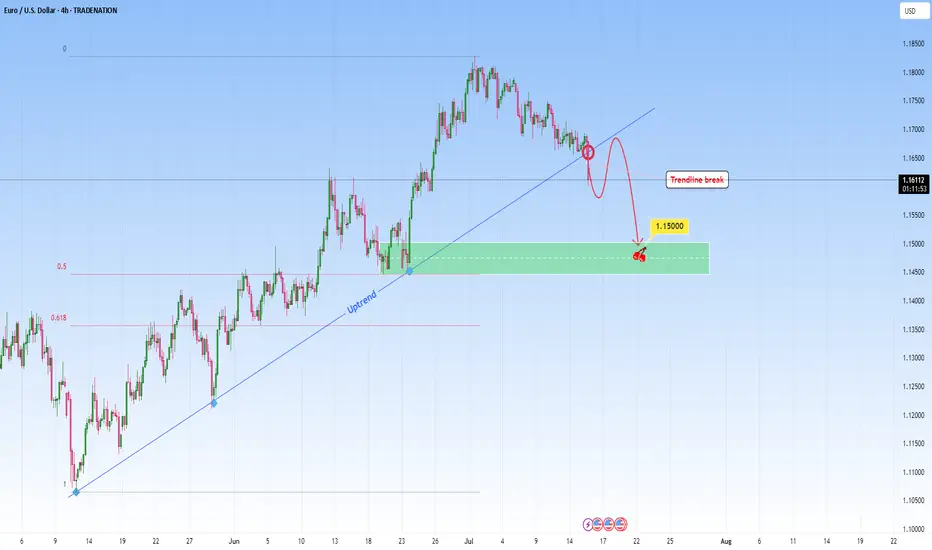
EURUSD: Sell Opportunity after Trendline breakEURUSD was in a steep uptrend but it might stop with this recent break through the uptrend. A break like this one on a strong trendline that had multiple touches, indicates either a potential reversal or major pause in the trend. This candle that broke the trendline signals the first hint of structural change.
I will be waiting for a retest and look to get involved in a short setup.
Ideally, what I look for in retests is to be met with a confirming candle. This would confirm the sellers have taken over and validate the change from uptrend to potential downtrend or consolidation phase.
My target would be around 1.1500.
Just sharing my thoughts for the charts, this isn’t financial advice. Always confirm your setups and manage your risk properly.
Disclosure: I am part of Trade Nation's Influencer program and receive a monthly fee for using their TradingView charts in my analysis .
Shortsetup
RCI, Bear Flag On The Daily As Well As The 4hr Analyzing both the daily and 4-hour charts reveals a very prominent bear flag, which has formed following a steep decline. This pattern is often indicative of further downward movement, and it's hard to ignore the implications.
Word on the street is that they're currently in dire straits. Since the Shaw acquisition, they've hemorrhaged 11 billion in valuation. The situation is exacerbated by declining revenues and missed growth targets. In short, it's not looking promising.
If the trend continues downward, we might see the price testing the $19 USD mark sooner rather than later.
For those who are currently long on this or have any vested interest, it might be prudent to reconsider your position and cut your losses before it's too late.

Bearish or bullish? Analysis:
Daily outlook:
- if market moves to to the daily key level, and make a short term bounce or sweep
will take longs setups
- if market moves sharply through the Daily key level, will look for short setups

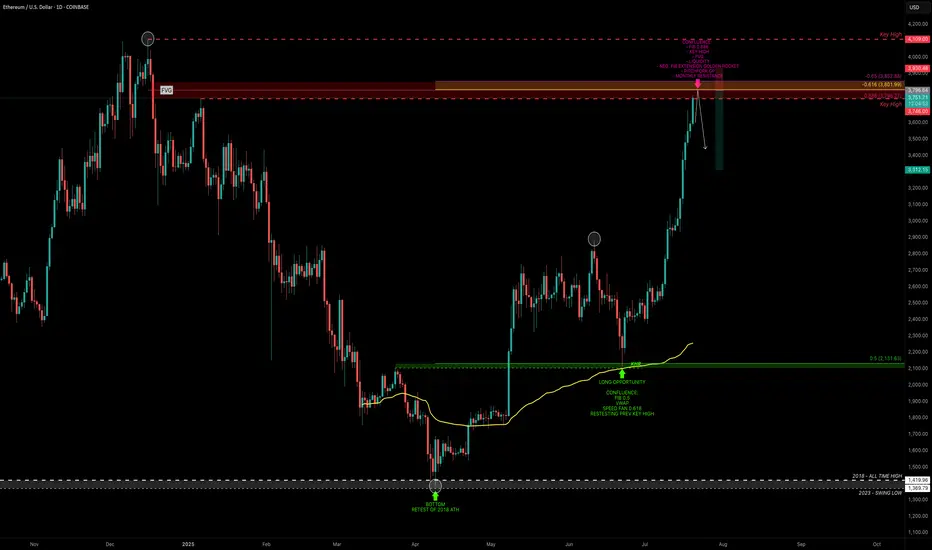
ETH — Rally Exhaustion or More Upside?ETH has been on an absolute tear. After retesting its old 2018 all-time high, it marked a bottom at $1383 — a brutal -66% correction over 114 days from the $4109 top.
From there, ETH ripped +100% in just one month, followed by 40 days of consolidation, and now, over the past 28 days, it’s surged another +76%, currently trading around $3715 — all without any major correction.
So the big question:
What’s next? Are we near a short setup, or is it time to long?
Let’s break it down.
🧩 Key Technicals
➡️ Bounce Zone:
On June 22, ETH retested the 0.5 fib ($2131.63) of the prior 5-wave Elliott impulse, with extra confluence from:
Anchored VWAP
Speed fan 0.618
➡️ Key Highs to Watch:
$3746 → recent local high
$4109 → 2021 all-time high
➡️ Fib Retracement Levels:
ETH has smashed through all major fibs, including the golden pocket (0.618–0.65) and 0.786 fib. The 0.886 fib at $3798.27 is the last major resistance, just above the $3746 key high.
At this zone, we also have:
Fair Value Gap (FVG)
Monthly Resistance
Negative Fib Extension Golden Pocket Target
➡️ Momentum Signal:
ETH is currently on its 8th consecutive bullish daily candle — historically, after 8–13 consecutive candles, price tends to cool off or correct. A sign to be cautious about longing here and consider profit-taking.
🔴 Short Trade Setup
Look for a potential SFP (swing failure pattern) at the key high $3746 to initiate a short trade.
This offers a low-risk setup with:
Entry: around $3746 (if SFP confirms)
Target (TP): ~$3300
Stop-loss: above SFP
R:R ≈ 1:4+
💡 Educational Insight: Why You Don’t Want to Long the Top
Markets often trap late longers near key highs or resistance zones — this is where smart money distributes while retail piles in emotionally.
Lesson: Look for zones of confluence (fib, VWAP, liquidity, FVG) and avoid chasing extended moves after multiple bullish candles.
Patience and confirmation at reversal points lead to higher-probability setups — you don’t need to catch every pump.
Final Thoughts
We’re approaching major highs, so this is a time for caution, not FOMO. Watch for reaction and potential reversals near $3750–$3850.
Stay sharp, manage risk — and remember, tops are where longs get trapped.
_________________________________
💬 If you found this helpful, drop a like and comment!
Want breakdowns of other charts? Leave your requests below.
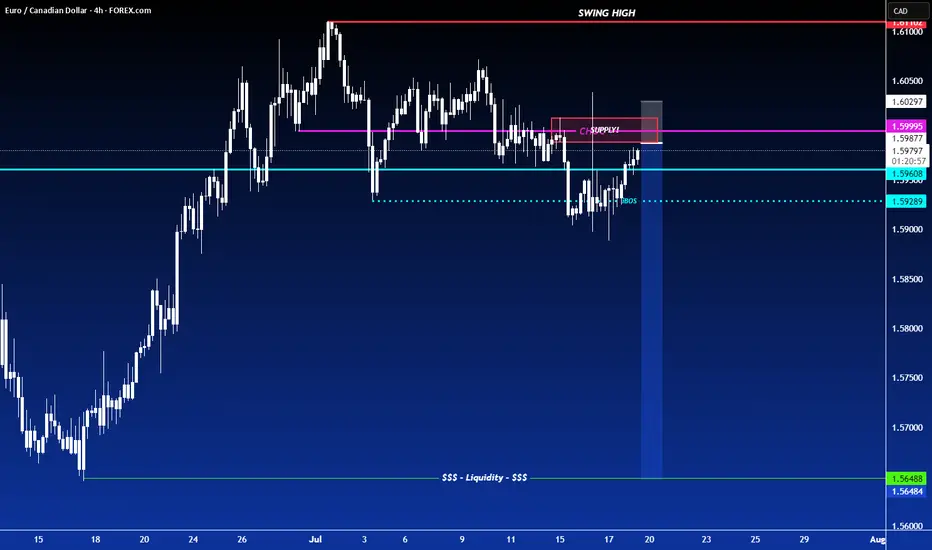
SHORT ON EUR/CADEUR/CAD has given us a nice CHOC (change of character) to the downside followed by a nice retest to supply.
I expect price to push up a little more into supply before dropping to the next support/demand level.
Looking to Catch 300-400 pips over the next few days.
Still looking to sell on rallies — nothing’s changedStill looking to sell on rallies — nothing’s changed. The level on the chart? That’s where buyers jumped in before. Makes sense to target it again.
So… why do we say there are "suffering buyers" at this level?
Let’s rewind a bit (see Chart #2) and imagine price at the point marked on the chart.
At that moment, price had clearly returned to a visible local level — 0.8123 — a zone that naturally attracted traders to jump in on the fly , or triggered limit orders .
But here’s what happened next:
Selling pressure overpowered buying interest — and price moved swiftly lower .
That’s when those buyers got caught.
That’s when the pain started.
🔍 What Makes This Level Special?
Broker data from open sources confirms that open positions are still sitting at this level — meaning a lot of traders are underwater, hoping for a recovery that may never come.
It’s not just technical structure.
It’s crowded sentiment , failed expectations , and trapped capital — all wrapped into one.
🧠 This is what we call a "suffering trader" zone — and it often becomes a magnet for future selling .
📌 Follow along for more breakdowns on flow, positioning, and market sentiment .

sideways in weekend downtrend⭐️GOLDEN INFORMATION:
Gold prices (XAU/USD) struggle to extend Thursday’s recovery from the $3,309 region—a one-week low—consolidating within a tight range during Friday’s Asian session. The US Dollar (USD) continues to retreat from its peak since June 23, pressured by dovish signals from Federal Reserve (Fed) Governor Christopher Waller.
Additionally, growing concerns over US President Donald Trump’s unpredictable trade policies and their potential consequences for global growth are keeping investors cautious, supporting demand for the safe-haven metal. These factors collectively help limit deeper losses in Gold, though the metal lacks clear bullish momentum for now.
⭐️Personal comments NOVA:
Gold price is moving sideways, accumulating in the downtrend line, not much fluctuation in weekend news
⭐️SET UP GOLD PRICE:
🔥SELL GOLD zone: 3381- 3379 SL 3386
TP1: $3370
TP2: $3360
TP3: $3350
🔥BUY GOLD zone: $3293-$3295 SL $3288
TP1: $3308
TP2: $3318
TP3: $3330
⭐️Technical analysis:
Based on technical indicators EMA 34, EMA89 and support resistance areas to set up a reasonable SELL order.
⭐️NOTE:
Note: Nova wishes traders to manage their capital well
- take the number of lots that match your capital
- Takeprofit equal to 4-6% of capital account
- Stoplose equal to 2-3% of capital account
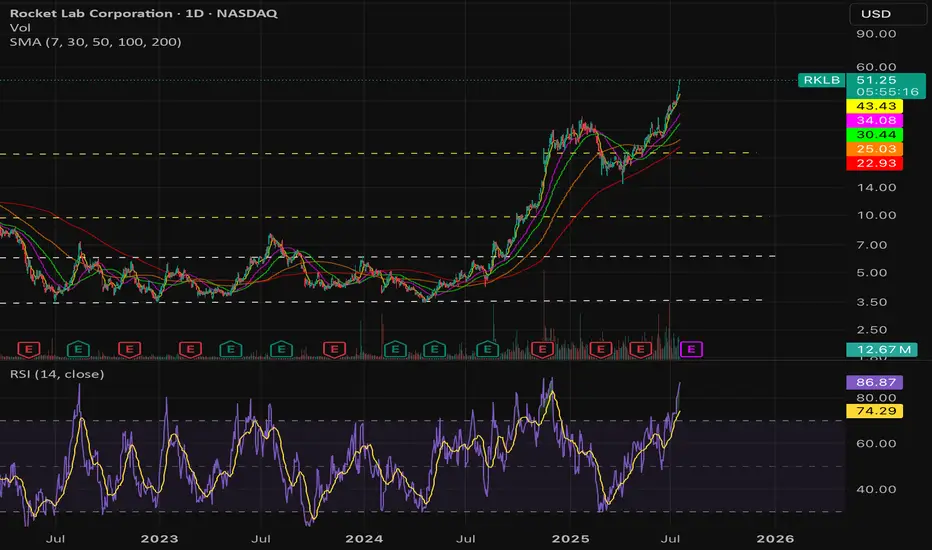
$RKLB Overvalued asf! - NASDAQ:RKLB is overvalued. I will either stay on the sidelines or short the heck out of this POS.
- Company sells hopium which doesn't have meaningful materialization as of now and not even in the distant future.
Fundamentally,
2025 | 2026 | 2027 | 2028
-0.32 | -0.08 | 0.17 | 0.47
Revenue:
576.83M | 905.01M | 1.21B | 1.69B
- Market cap of NASDAQ:RKLB currently sits at 24.61B as of July 17, 2025.
- People who are buying now are buying someone else bag and are in for a horrible ride.
- Consider buying it under $15 if you are super bullish
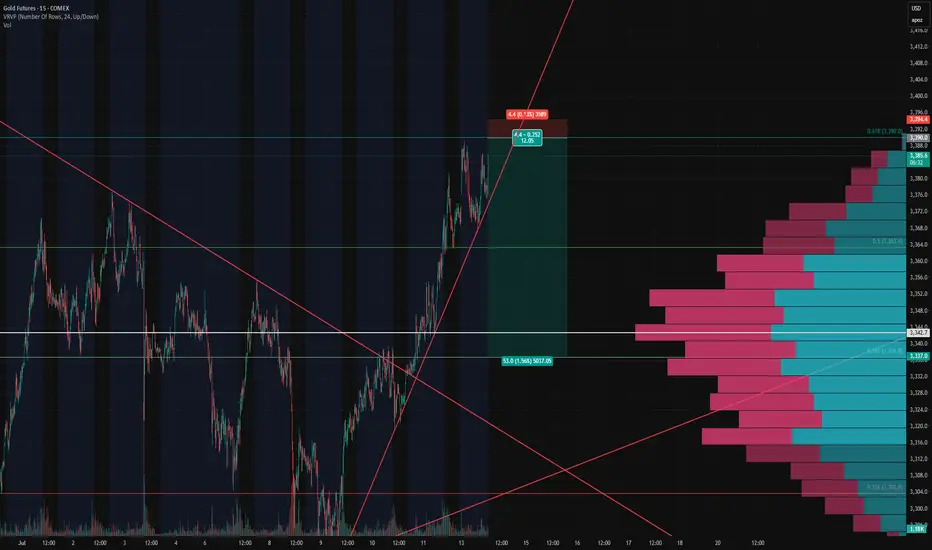
Gold Futures ($GC1!) — US Session Setup: Bearish Retest from 618🟡 Gold Futures ( COMEX:GC1! ) — US Session Setup: Bearish Retest from 0.618 Fib in Bullish Breakout Context
⏳ Pre-US Session Playbook
We're currently watching Gold Futures ( COMEX:GC1! ) for a potential short opportunity into the US session open. While the broader structure has broken bullish, we're anticipating a bearish retest scenario from a key Fibonacci level — aligning cleanly with last week’s breakout structure.
No positions have been taken yet — we are setting up for the US session — and are closely monitoring price action near the 0.618 retracement zone before committing.
📍 Setup Breakdown
• 0.618 Fib Retracement from the last bearish impulse aligns with:
○ Recent volume shelf resistance
○ Retest zone from prior breakout
○ An overextended local push into thin volume above 3380
• Bullish Context:
○ HTF breakout from descending wedge structure remains valid
○ Macro buyers still in control
○ Upside continuation risk is high if sellers don’t show up
• Short Bias Conditions:
○ Rejection or absorption in the 3385–3390 zone
○ Weak follow-through above 0.618 (failed breakout scenario)
○ Breakdown of LTF higher low structure post-test
🧠 Strategy Commentary
Although we’re in bullish breakout mode, this is a tactical short setup — a fade into prior structure with clear invalidation. We're not fighting trend, but looking to short into exhaustion at a defined level, with tight risk parameters.
Confluence Factors:
• 0.618 fib alignment
• VRVP volume shelf
• Prior breakout structure retest
• LTF divergence or absorption confirming the fade
🎯 Trade Parameters (Planned)
• Entry Zone: ~3385–3390
• Stop Loss: Tight, 3395–3400
• Target Zone: 3342–3337 (full structure retest)
📌 Patience is key — this remains a setup until confirmed. We'll post live if and when conditions are met.
Let the market come to you.
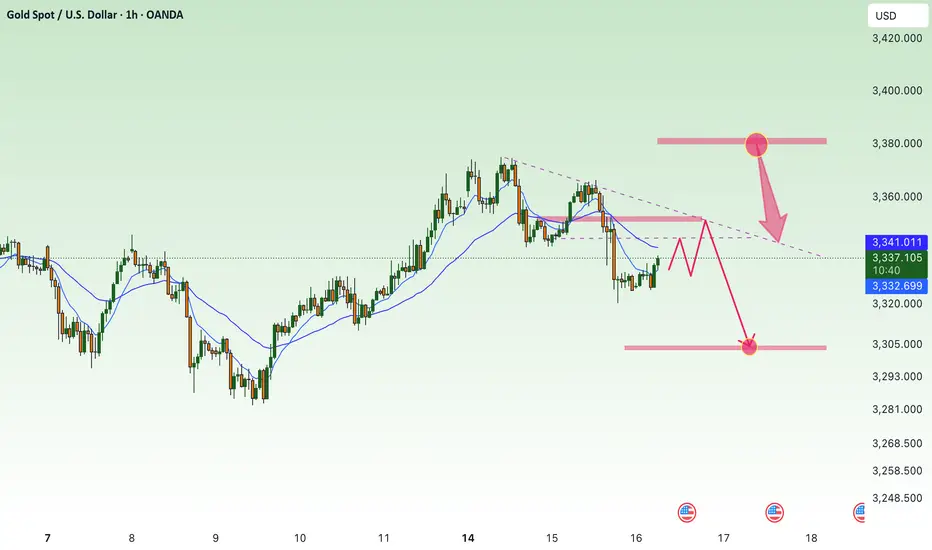
Gold Trading Idea: Short Opportunity on 15-Min Descending ChanneHello TradingView Community,
Following up on my Gold analysis from Monday, the price action has respected the levels I outlined (check my previous posts for the breakdown), delivering solid trade opportunities except yesterday's news-driven volatility. Today, we're eyeing a short setup on Gold based on the 15-minute timeframe.
Technical Analysis:
Gold is moving within a descending channel on the 15-min chart.
I've identified equal highs and a small FVG (Fair Value Gap) aligning with the 61.8% Fibonacci retracement of the channel's range.
This confluence zone is where I expect the price to react, potentially clearing liquidity above the channel before reversing.
Trade Plan:
Entry: Wait for the price to reach the confluence zone (equal highs + 61.8% Fib + FVG) and show a clear reaction (e.g., rejection or reversal pattern) before entering a short position.
Take Profit: Targeting 3310 level.
Risk Management: If the price fails to reach the zone and breaks lower, I'll stay out to avoid chasing trades. Patience is key here.
Stay disciplined, traders! Let the price come to our zone, and always manage your risk.
Follow for more setups, like this post if you found it helpful, and drop your thoughts in the comments below! Let’s discuss!
#Gold #XAUUSD #ShortSetup #TechnicalAnalysis

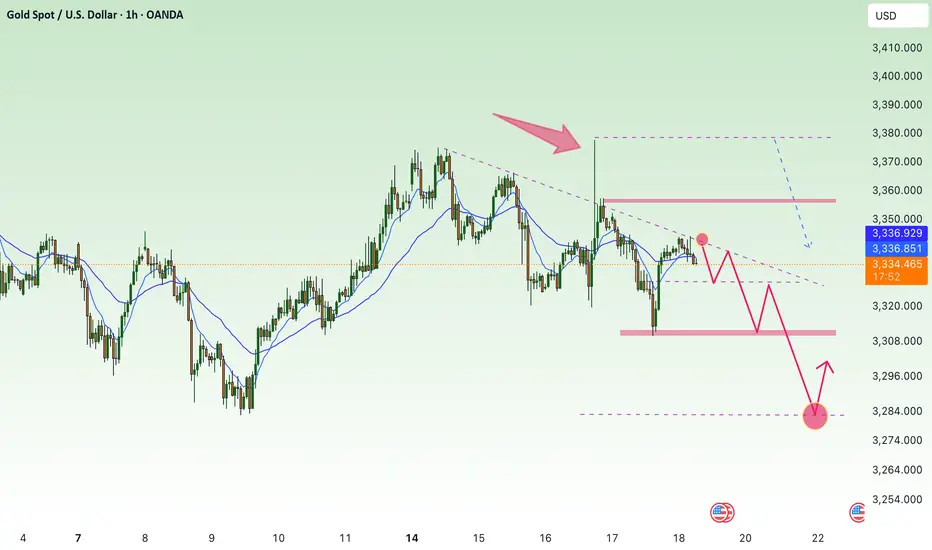
NordKern - XAUUSD InsightNordKern | Simplified Insight OANDA:XAUUSD Short Opportunity Ahead
Gold saw a sharp surge in price today, primarily driven by political headlines that temporarily shook market sentiment. To be specific:
📅 Jul 16, 2025 – 16:56 CET
CBS Reports: Trump asked Republican lawmakers whether he should fire Fed Chair Jerome Powell. This headline alone triggered an intraday spike of +$52/oz in gold as markets priced in increased macro and institutional risk.
As previously stated "Context Matters."
While the President cannot remove the Fed Chair without cause, even the suggestion introduces uncertainty and undermines confidence in the Fed’s independence especially ahead of a high-stakes election cycle.
However, further developments quickly followed: 📅 Jul 16, 2025 – 17:58 CET
Trump: “Firing Powell is highly unlikely.” 📅 Jul 16, 2025 – 18:06 CET
Trump: “Reports on me firing Powell are not true.” With this clarification, the initial rally appears overstretched and sentiment-driven, leaving room for a corrective pullback as the market digests the full picture.
Trade Setup - Short Bias
Parameters:
Entry: 3356.40
Stop Loss: 3690.30
Take Profit: 3322.00
Key Notes:
- The spike was headline-driven and not supported by policy shift or macro data.
- Trump’s denial removes much of the political risk premium that had been briefly priced in.
- Watch for momentum fading near resistance and confirmation via intraday structure.
This remains a tactically driven setup. Manage risk appropriately and stay alert for any renewed political developments.

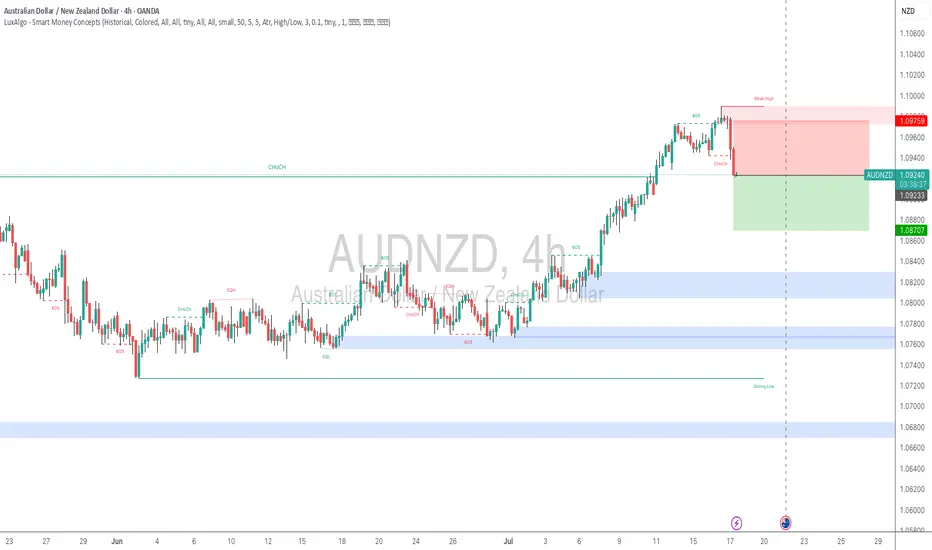
AUDNZD - Short-Term Pullback Expected from Key ResistanceAUDNZD - Short-Term Pullback Expected from Key Resistance
📈 Setup Overview:
AUDNZD has been trending bullish but has now reached a critical resistance level that aligns with the upper boundary of the ascending trendline. This confluence suggests a potential short-term pullback opportunity.
🔍 Analysis:
Strong bullish wave structure intact
Price testing key resistance + ascending trendline upper boundary
Expecting retracement toward trendline support
Overall bullish structure remains favorable for continuation after pullback
📊 Trade Details:
Entry: Sell Stop at 1.091745
Risk Management: 1:2 Risk-to-Reward Ratio
Bias: Short-term bearish pullback within larger bullish trend
⚠️ Risk Disclaimer: This is not financial advice. Trade at your own risk and always use proper position sizing.
XRP Hits $3.10 — Rising Wedge or Ready to Fly?XRP has been on a strong run over the past 24 days, rallying from $1.90 → $3.10 — a +62% price increase. But after hitting key resistance, is XRP about to correct, or will it break out further? Let’s dive into the technicals.
🧩 Market Structure
Rising Wedge Pattern:
The current market structure resembles a rising wedge, with XRP likely completing wave 5.
Rejection Zone Hit:
Price tapped the nPOC at $3.10 and rejected — providing a clean short opportunity.
📉 Key Support Levels & Confluences
Taking the full 24-day bullish move:
0.382 Fib Retracement: $2.6326 — aligns with liquidity pool below the $2.6596 swing low.
226-day Trading Range VAH: ~$2.62 (red dashed line) — adds confluence.
Daily Level: $2.60 — further support.
Anchored VWAP from $1.90 Low: ~$2.54 (rising over time).
✅ Conclusion: The $2.66–$2.60 zone is a critical support area and offers a solid long opportunity.
Trade Setups
🔴 Short Setup (After Breakdown Confirmation):
Wait for a sell-off & breakdown of the wedge.
Ideal entry: retest of the lower wedge edge, ideal short entry would be between 0.618–0.786 fib retracement.
🟢 Long Setup:
Entry Zone: $2.66–$2.60
SL: below VWAP line
Target: Fib 0.618 as TP
🧠 Educational Insight: Rising Wedges Explained
A rising wedge is a bearish pattern, often signalling weakening momentum as price climbs within narrowing highs and lows.
Key points:
➡️ Volume typically declines as the wedge matures.
➡️ Breakdown below the lower wedge edge often triggers stronger sell-offs.
➡️ Retests of the broken wedge support turn into ideal short entries.
Pro tip: Combine wedge patterns with fib retracement zones and VWAP levels for higher-confidence setups.
Watch for wedge breakdown confirmation before shorting.
_________________________________
💬 If you found this helpful, drop a like and comment!
Want breakdowns of other charts? Leave your requests below.

downtrend, back to 3300 gold price⭐️GOLDEN INFORMATION:
Gold prices (XAU/USD) inch higher in early Asian trading on Wednesday, recovering part of Tuesday’s sharp decline to multi-day lows, though follow-through buying remains limited. Lingering uncertainty surrounding US President Donald Trump’s trade tariffs, combined with expectations that the Federal Reserve (Fed) will maintain elevated interest rates, continues to dampen risk appetite. This weaker market mood is providing modest support to the safe-haven metal.
Meanwhile, the US Dollar (USD) eases slightly after Tuesday’s surge to its highest level since late June, which is helping gold stabilize. However, persistent speculation that the Fed may delay rate cuts, following a slight uptick in US inflation, continues to bolster the greenback and could cap further gains in gold. Traders remain cautious and await today’s US Producer Price Index (PPI) release for clearer direction.
⭐️Personal comments NOVA:
Selling pressure, break 3340 downtrend line continues. Economic news is helping DXY recover
⭐️SET UP GOLD PRICE:
🔥SELL GOLD zone: 3381- 3383 SL 3388
TP1: $3370
TP2: $3360
TP3: $3350
🔥BUY GOLD zone: $3306-$3304 SL $3299
TP1: $3318
TP2: $3330
TP3: $3343
⭐️Technical analysis:
Based on technical indicators EMA 34, EMA89 and support resistance areas to set up a reasonable SELL order.
⭐️NOTE:
Note: Nova wishes traders to manage their capital well
- take the number of lots that match your capital
- Takeprofit equal to 4-6% of capital account
- Stoplose equal to 2-3% of capital account
SHORT ON CHF/JPYCHF/JPY has given us a nice CHOC change of character to the downside after creating a new high.
I expect price to tap into supply before falling to the next demand zone. this is a SELL LIMIT order.
Looking to catch over 200 pips to the next demand zone.

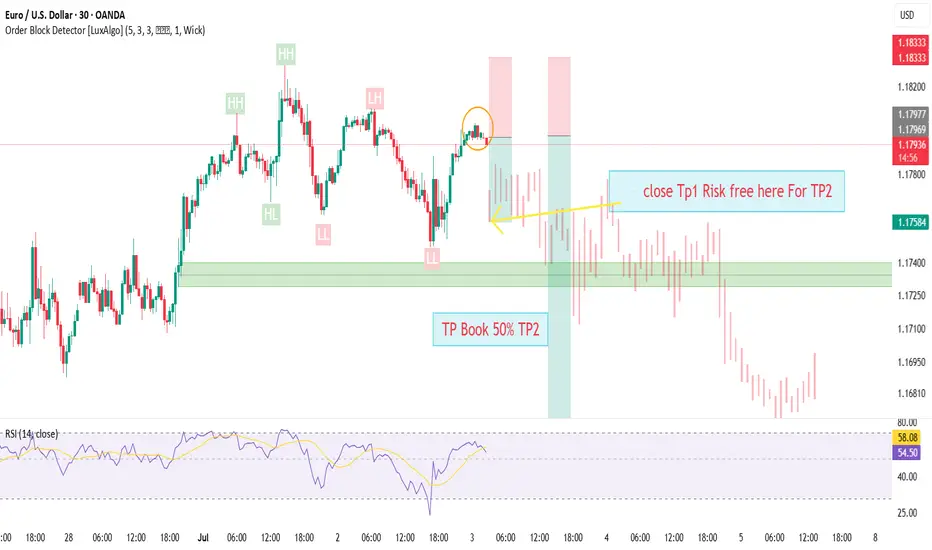
EURUSD📉 EURUSD – 30min Short Plan
📊 Structure: LLs & LHs forming – bearish trend confirmed
🕯️ Pattern: Bearish Engulfing at Lower High
🎯 Entry: instant
📌 Trade 1
– 🎯 TP1: 1:1
– ⚠️ Risk: 1%
📌 Trade 2
– 🎯 TP2: larger reward
🛠️ Execution:
– Place both trades at same entry
– Trail SL after TP1 hit
📎 Bias: Bearish
Big Week for Markets: U.S. CPI Tomorrow – What It Means for GoldThis week is packed with news, but the main focus is the U.S. CPI report dropping tomorrow.
🗓 Key Event: U.S. CPI Report
📍 July 15, 2025 | 12:30 p.m. UTC
The CPI report measures inflation and heavily influences the Fed’s rate decisions. Last month’s CPI came in at 2.4% vs. 2.5% expected, following 2.3% vs. 2.4% in April. While it seems inflation is rising, the bigger picture shows stable annual inflation in the 2.3%–3.0% range, keeping things under control—likely the reason Trump is pressuring Powell to cut rates.
Market expects June CPI to be 2.7%.
🤔 Possible Scenarios:
1️⃣ CPI > 2.7%: Bullish for DXY 📈. The stronger the print, the bigger the spike, but I see this scenario as less probable.
2️⃣ CPI < 2.7%: Bearish for DXY 📉. We may see a USD dump, though likely shallow since CPI could still be higher than previous months.
✨ What About Gold?
I don’t expect a major reaction in gold:
✅ Higher CPI? Gold often benefits as an inflation hedge.
✅ Lower CPI? Also supportive for gold as it weighs on the USD.
🔍 Technical Outlook:
Gold has been trading within a triangle since April 22, forming lower highs and higher lows. We may currently be in Wave D (Elliott Wave), aiming toward the triangle’s upper boundary slightly above $3,400 resistance. After that, Wave E may develop – but that’s a story for another post.

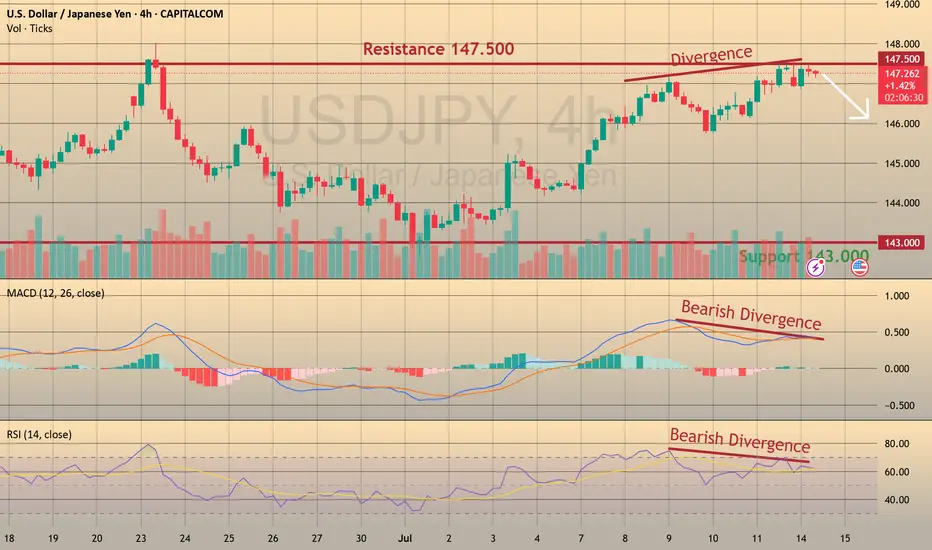
USDJPY: Bearish Divergence – Eyeing Shorts to 143 CAPITALCOM:USDJPY
We’re seeing strong bearish divergence in USDJPY near the 148 resistance zone, shifting our focus to short opportunities with a medium-term target at 142.
📈 Trading Plan:
🔻 SELL Stop: 147.040
❌ Stop Loss: 149.220
✅ Take Profit: 143.000
(Click 👉 Trade Now 👈 on your mobile to copy SL & TP easily)
🔍 Why am I short here?
✅ Technical: Clear bearish divergence on the H4 (RSI & MACD), indicating potential reversal signals.
✅ Resistance Zone: Price is testing the key 148 resistance, providing an ideal risk-reward location for shorts.
✅ Macro Event: Ahead of tomorrow’s US CPI release, a conservative trade structure is maintained to manage volatility risks.
📰 Fundamental Snapshot:
Japan’s economy shows signs of stabilization:
Core machinery orders fell only 0.6% MoM in May to ¥913.5B, much better than April’s -9.1% and forecasts of -1.5%.
Despite the headline decline, it indicates resilience in Japan’s capital spending, supporting the JPY’s medium-term outlook amid global trade and growth risks.
Trade cautiously!
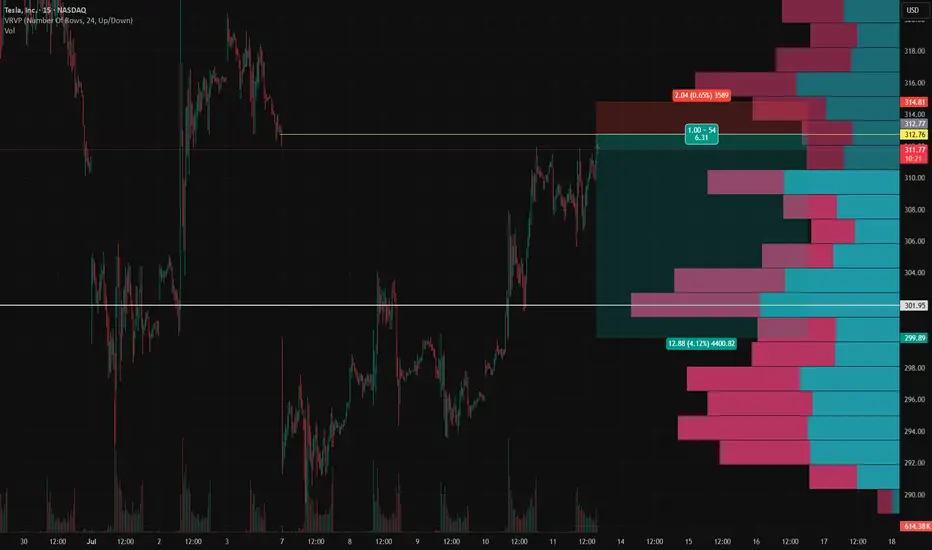
TSLA Short Setup – Fading the July 7 Gap FillTSLA Short Setup – Fading the July 7 Gap Fill 📉
This short idea on TSLA builds off a key gap fill from Monday, July 7 , combined with a strong local volume profile and risk-reward alignment on the 15-minute chart.
Entry: $312.76
Stop Loss: $314.81 (above gap resistance and local high)
Target: $299.89 (gap base and volume shelf)
RR: ~6.3R
Why I'm shorting here:
TSLA has just filled the July 7 gap , which often acts as a technical resistance zone on retest.
Price stalled right as it completed the fill — with visible hesitation and selling pressure stepping in.
VRVP shows low liquidity above, suggesting diminished reward for upside continuation.
Below, there's a clean volume shelf around $294–$300 that could attract price if weakness confirms.
Trade Logic:
This is a classic fade-the-gap-fill setup, targeting the lower edge of the volume cluster for a potential bounce or reversal zone.
As always: size accordingly, stick to the stop, and don’t chase if the entry’s already gone.
Thoughts? Anyone else watching this gap level?
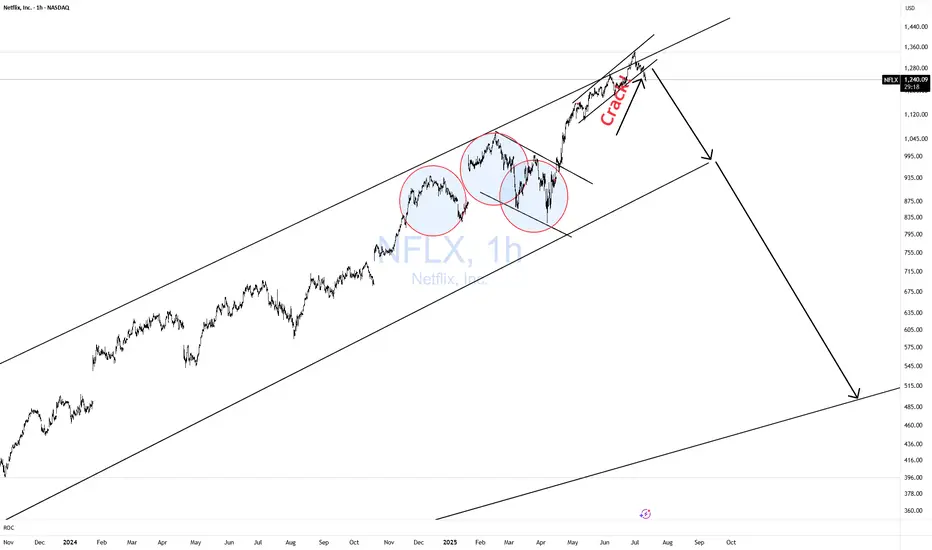
NFLX CRACK!!Classic breakdown move from a rising F flag!
Massive Head and shoulders formed, that head test followed through, taking out stops, and now failing off the top of the channel.
Screaming CAUTION to the bulls!
Nice simple short setup for bears.
Click boost, follow, and subscribe. Let's get to 5,000 followers. ))
Rejection from Supply Zone, Bearish Continuation Toward PDLAfter failing to break out with strength and confirm the demand zone, EUR/USD is showing signs of a bearish continuation. The price was rejected from the Demand Zone near the NY High, indicating a possible shift in momentum.
This setup suggests the pair may continue its downward trend, aiming for the Previous Day Low (PDL) around 1.16620. With a favorable risk-to-reward ratio of 1:5, this move could present a clean and high-probability short opportunity as long as bearish structure holds.

SOLUSDSell SOLUSD Candle Stick Pattern
SL TP EP All In Charts Prolong your targets but risk free and book partially your trade
Lets see how it goes

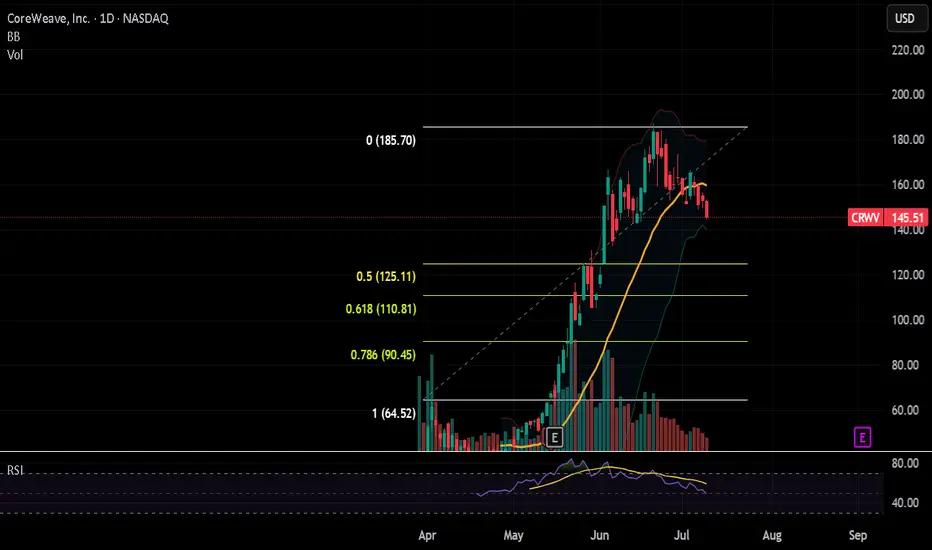
CRWV is crash this weeklast 3 days closed below 21 ema. under 50 on daily RSI. head/shoulders below 145 may breach 140 this week? looks like it. i'm gonna make the play.
148 SL