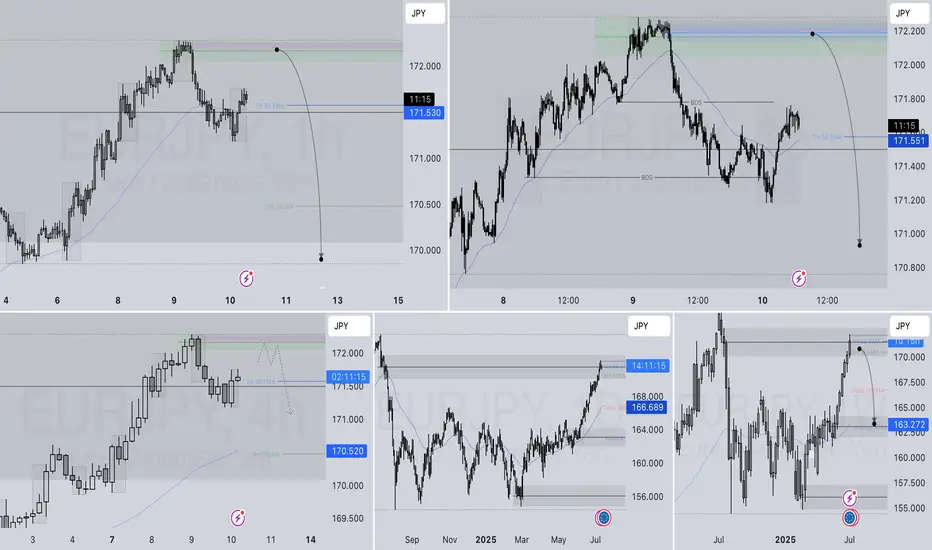
EURJPY SHORT DAILY FORECAST Q3 D10 W28 Y25EURJPY SHORT DAILY FORECAST Q3 D10 W28 Y25
Professional Risk Managers👋
Welcome back to another FRGNT chart update📈
Diving into some Forex setups using predominantly higher time frame order blocks alongside confirmation breaks of structure.
Let’s see what price action is telling us today! 👀
💡Here are some trade confluences📝
✅Daily Order block identified
✅4H Order Block identified
✅1H Order Block identified
🔑 Remember, to participate in trading comes always with a degree of risk, therefore as professional risk managers it remains vital that we stick to our risk management plan as well as our trading strategies.
📈The rest, we leave to the balance of probabilities.
💡Fail to plan. Plan to fail.
🏆It has always been that simple.
❤️Good luck with your trading journey, I shall see you at the very top.
🎯Trade consistent, FRGNT X
Shortsetup
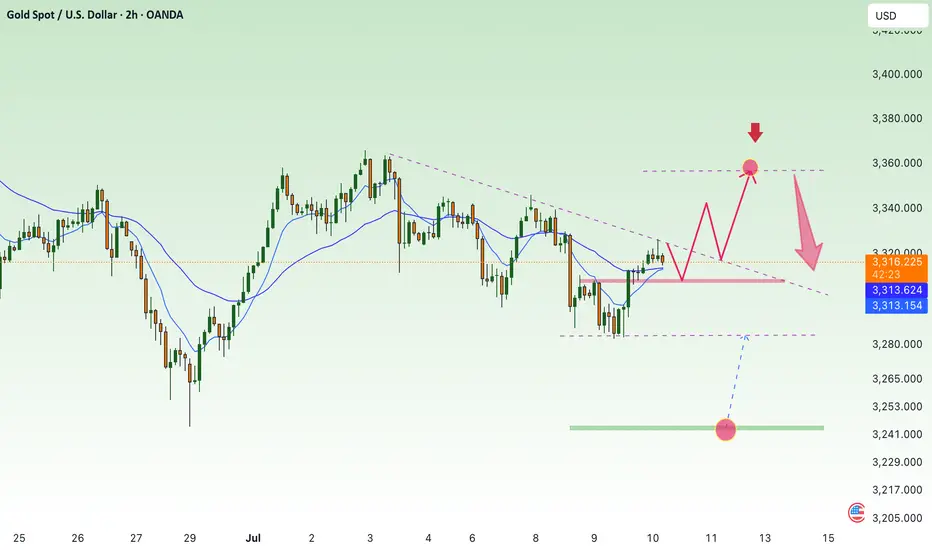
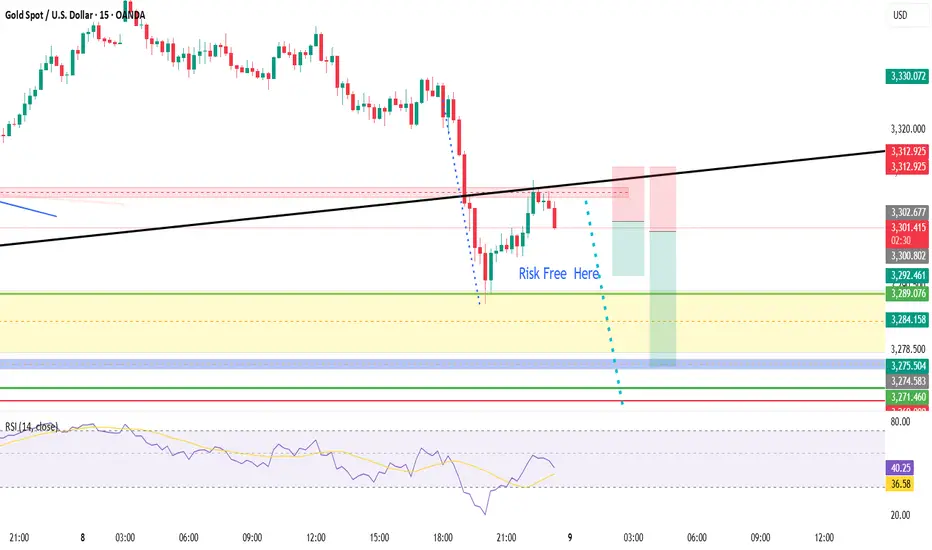
Accumulated above 3300, market is sideways⭐️GOLDEN INFORMATION:
Gold prices posted modest gains on Wednesday, supported by a pullback in US Treasury yields, even as the US Dollar remained firm against major currencies. Market sentiment continued to be driven by trade developments, while the Federal Reserve’s latest meeting minutes revealed that policymakers are still leaning toward a rate cut in 2025. At the time of writing, XAU/USD is trading at $3,312, up 0.31%.
The FOMC minutes indicated that the majority of Fed officials believe a rate cut this year would be appropriate, with a few members open to the possibility of initiating a reduction as early as July—provided the economic data continues to align with expectations.
⭐️Personal comments NOVA:
Gold price recovered to 3320, mainly still accumulating, waiting psychology on current tariff situation of countries
⭐️SET UP GOLD PRICE:
🔥SELL GOLD zone: 3358- 3360 SL 3365
TP1: $3345
TP2: $3332
TP3: $3320
🔥BUY GOLD zone: $3245-$3247 SL $3240
TP1: $3256
TP2: $3269
TP3: $3280
⭐️Technical analysis:
Based on technical indicators EMA 34, EMA89 and support resistance areas to set up a reasonable BUY order.
⭐️NOTE:
Note: Nova wishes traders to manage their capital well
- take the number of lots that match your capital
- Takeprofit equal to 4-6% of capital account
- Stoplose equal to 2-3% of capital account
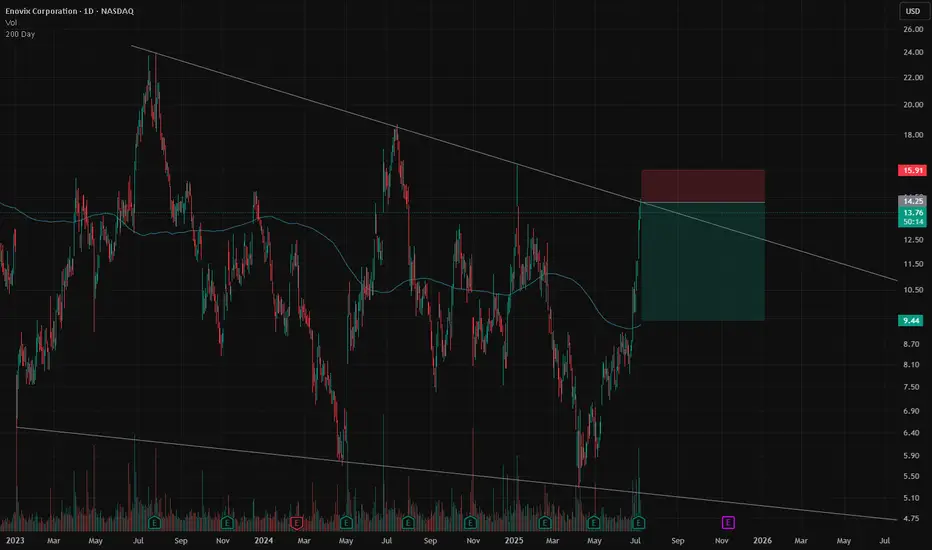
ENVX TradeENVX is the poster child of the 2021 SPAC/IPO bubble. It's shares have essentially been in a downtrend since going public.~35% short interest on the name, no need to go in depth on the fundamentals (or lack there of).
Technical play here, shares are grinding up on the long-term trend resistance line. Expecting a move back toward the 200 day SMA in the next couple months. Stop out at 16 if there's a squeeze, or things get memey.
Near term target - $9.50. Long term target - zero.
I like 5+ month expirations OTM puts here.
Good Luck! This is not financial advice
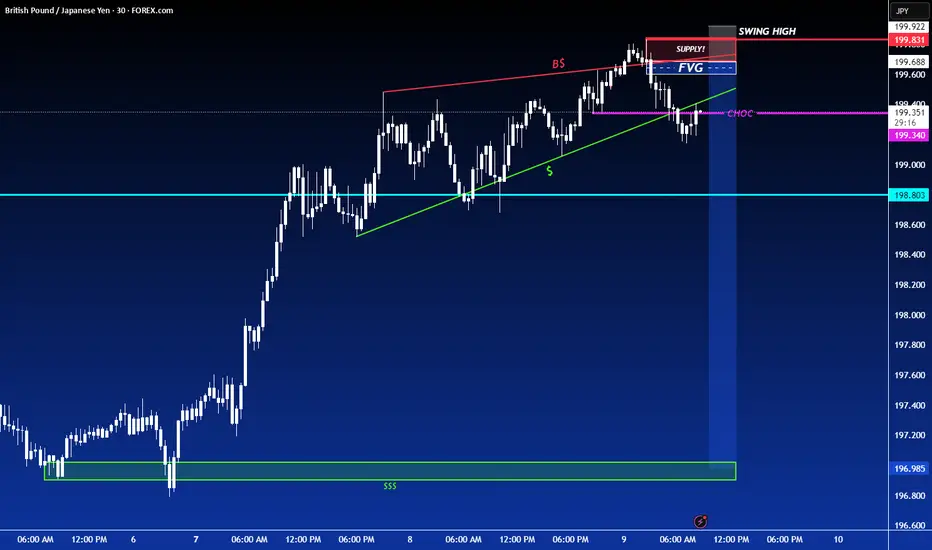
SHORT ON GBP/JPYGJ currently has broken a strong low of a rising wedge pattern (which is a bearish reversal pattern.
I am waiting for price to hit the supply zone before entering for a sell.
So a sell limit order will need to placed at the supply zone to take advantage of this opportunity.
Gold Setup for longs and shorts This video covers gold on the local range whereby I expect price to eventually complete the move to the downside and clear the equal lows from MAy and June as well as take care of the poor lows and fill Quart Pivots .
I talk also about the Tradingview session volume profile chart and how this feature can really be a simple yet powerful guide for taking scalp trades off of specific levels and I show a couple of examples of the respect PA has for hitting those daily POC .
I Welcome any questions you may have

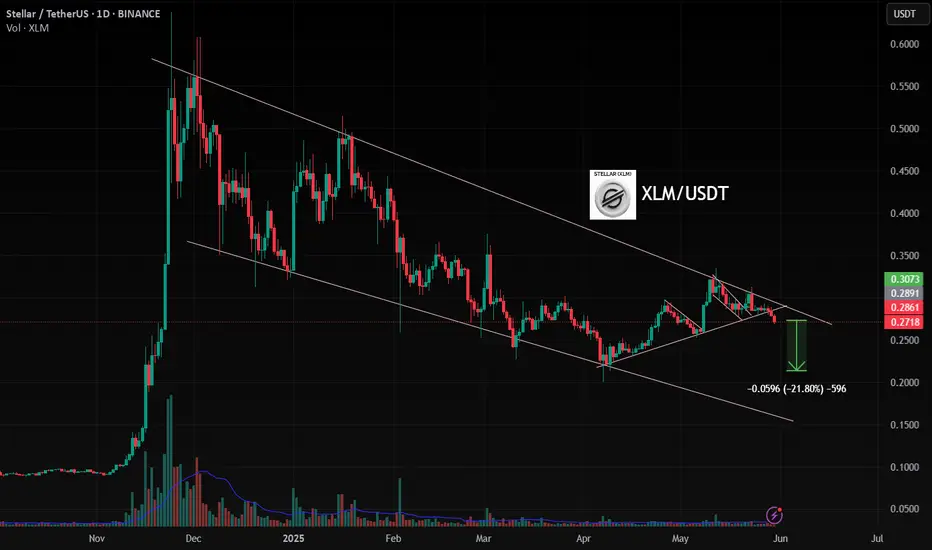
XLM ,1DAs BTC is Falling And BTC is given Breakout of Pattern in 4Hr , then Remaining coins will also fall drastically .
in 1D pattern of XLMUSDT , it is Breaking Down as BTC is also given Break Down of Pattern
Follow for More Ideas like This
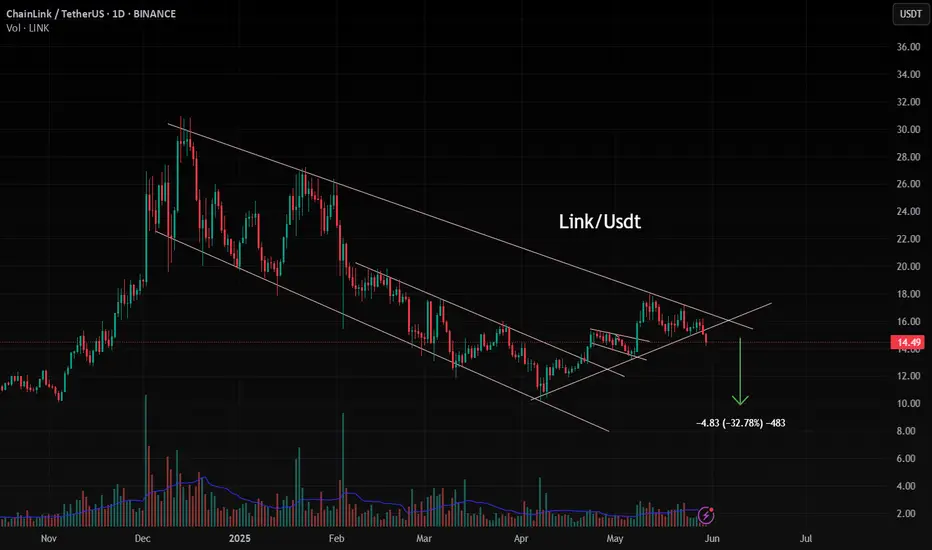
Link, 1DAs BTC is Falling And BTC is given Breakout of Pattern in 4Hr , then Remaining coins will also fall drastically .
in 1D pattern of ADA USDT , it is Breaking Down as BTC is also given Break Down of Pattern
Follow for More Ideas like This
BTC , 4hr , BearishBTC is Forming a Pattern and it is at the top of the Another Pattern and It is facing rejection 3 Times from Above and now it is forming another pattern inside and Ready for Break Down of the Pattern , if it breaks the Pattern Down then it will be bearish almost 90% it will move to down side , if it has not given Breakdown and moving inside the small pattern then wait patiently and observe carefully .
Then it may also give Breakout for up side .
Follow Risk Management Properly
Follow for More Swing Ideas Like this .
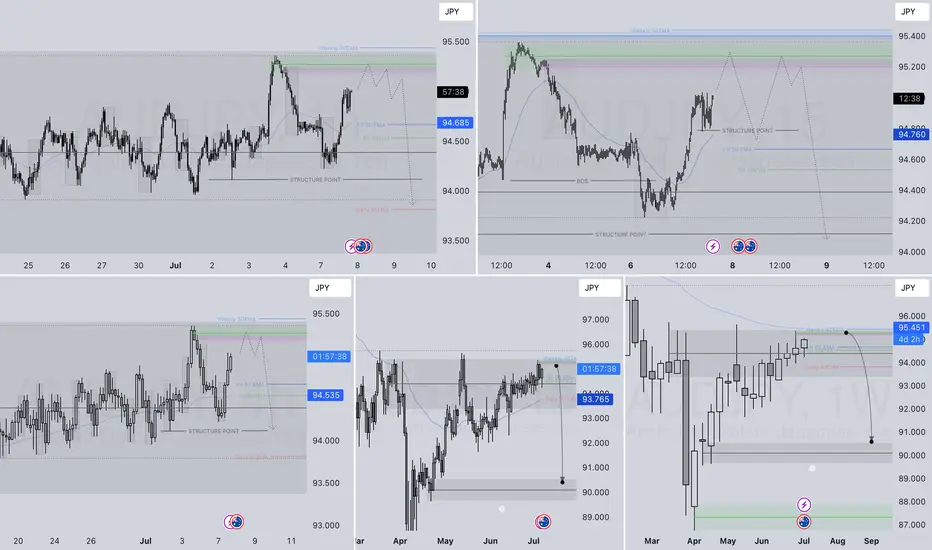
AUDJPY SHORT FORECAST Q3 W28 Y25AUDJPY SHORT FORECAST Q3 W28 Y25
Professional Risk Managers👋
Welcome back to another FRGNT chart update📈
Diving into some Forex setups using predominantly higher time frame order blocks alongside confirmation breaks of structure.
Let’s see what price action is telling us today! 👀
💡Here are some trade confluences📝
✅Weekly Order Block Identified
✅Daily Order block identified
✅4H Order Block identified
✅15' Order block identified
🔑 Remember, to participate in trading comes always with a degree of risk, therefore as professional risk managers it remains vital that we stick to our risk management plan as well as our trading strategies.
📈The rest, we leave to the balance of probabilities.
💡Fail to plan. Plan to fail.
🏆It has always been that simple.
❤️Good luck with your trading journey, I shall see you at the very top.
🎯Trade consistent, FRGNT X
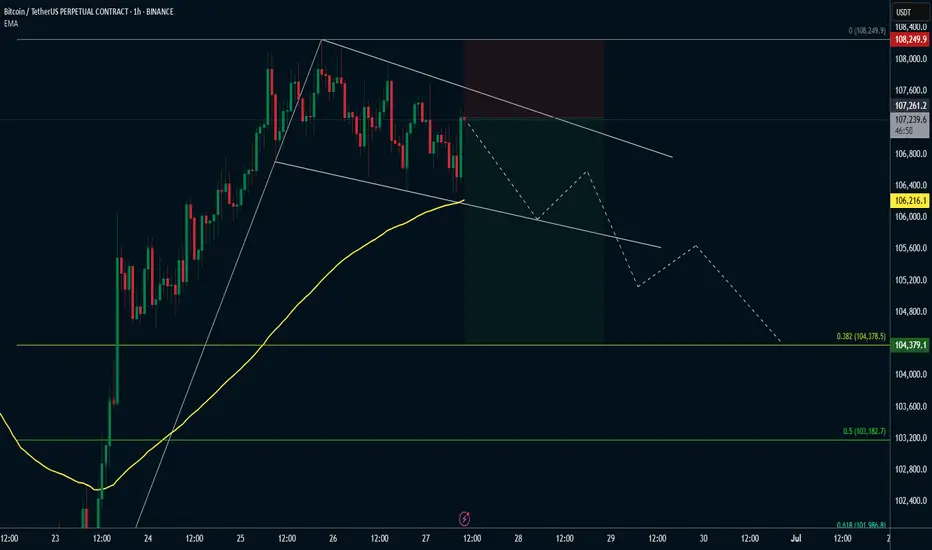
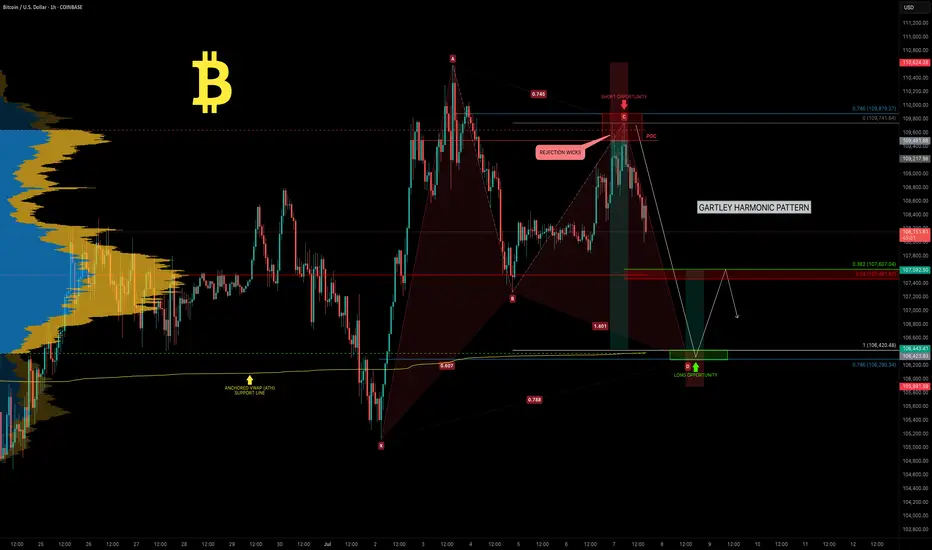
BTC — Weekend Pump Fades.. All Eyes on the Gartley Reversal ZoneBitcoin has been consolidating in a tight range between $110K and $105K over the past two weeks. This weekend’s attempted breakout stalled out quickly! BTC was rejected at the Point of Control (POC) of the previous range and came close to the 0.786 retracement of the recent drop.
🧠 Reminder: Weekend pumps are notorious for being unreliable, especially without strong volume.
Now, the charts point toward something much more structured — a potential Gartley harmonic pattern forming, with multiple levels of confluence suggesting the next key decision zone is just around the corner.
🧩 Gartley Completion Zone: $106,290–$106,400
This price zone is loaded with confluence:
✅ 0.786 Fib retracement of the XA leg sits at $106,290
✅ 1.0 trend-based Fib extension of the BC leg is at $106,370
✅ Anchored VWAP from all-time high aligns precisely at $106,370
✅ VAL (Value Area Low) sits at the same level
✅ Imbalance (Fair Value Gap) from earlier price inefficiency lies in this exact region
All of this stacks up into a high-probability reaction zone.
🎓 Educational Insight: How to Trade a Gartley Harmonic
The Gartley pattern is one of the most powerful harmonic setups — a structured form of retracement and extension that captures exhaustion before reversals. Here's how it works:
🔹 XA: Impulse leg
🔹 AB: Retracement of 61.8% of XA
🔹 BC: Retraces 38.2%–88.6% of AB
🔹 CD: Extends to 78.6% retracement of XA and aligns with a 1.0–1.272 Fib extension of BC
🟢 Point D is the entry zone — your reversal opportunity.
📉 Stop-loss sits just below invalidation (Point X).
💰 Targets usually lie at 0.382 and 0.618 of the CD leg.
🔎 Why It Works: It traps late traders and captures price exhaustion at natural Fibonacci ratios. Combined with other tools — like VWAP, liquidity zones, and order flow — it becomes a high-conviction strategy. These patterns are most effective on higher timeframes like 4H or daily.
_________________________________
💬 If you found this helpful, drop a like and comment!
Want breakdowns of other charts? Leave your requests below.
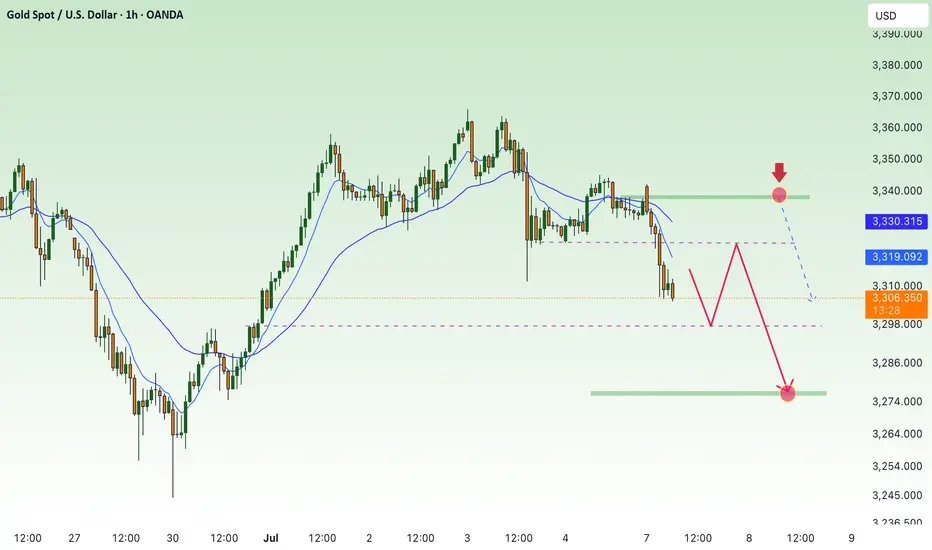
Bears pressure early week below 3300⭐️GOLDEN INFORMATION:
Gold prices (XAU/USD) face renewed selling pressure, dipping toward the $3,320 level during the early Asian session on Monday. The pullback comes as June’s stronger-than-expected US Nonfarm Payrolls (NFP) report has reshaped market expectations around the Federal Reserve’s (Fed) policy path. Investors now turn their attention to the upcoming release of the FOMC Minutes on Wednesday for further guidance.
The US economy added 147,000 jobs in June, beating expectations and slightly up from May’s revised figure of 144,000. Meanwhile, the Unemployment Rate held steady at 4.1%. These figures reinforced the view that the labor market remains resilient, thereby lowering the odds of an imminent Fed rate cut. As a result, the US Dollar has strengthened, weighing on non-yielding assets such as Gold.
⭐️Personal comments NOVA:
Downtrend at the beginning of the week, gold price returns to accumulate below 3300
⭐️SET UP GOLD PRICE:
🔥SELL GOLD zone: 3337- 3339 SL 3344
TP1: $3328
TP2: $3312
TP3: $3300
🔥BUY GOLD zone: $3297-$3295 SL $3290
TP1: $3308
TP2: $3320
TP3: $3330
⭐️Technical analysis:
Based on technical indicators EMA 34, EMA89 and support resistance areas to set up a reasonable SELL order.
⭐️NOTE:
Note: Nova wishes traders to manage their capital well
- take the number of lots that match your capital
- Takeprofit equal to 4-6% of capital account
- Stoplose equal to 2-3% of capital account
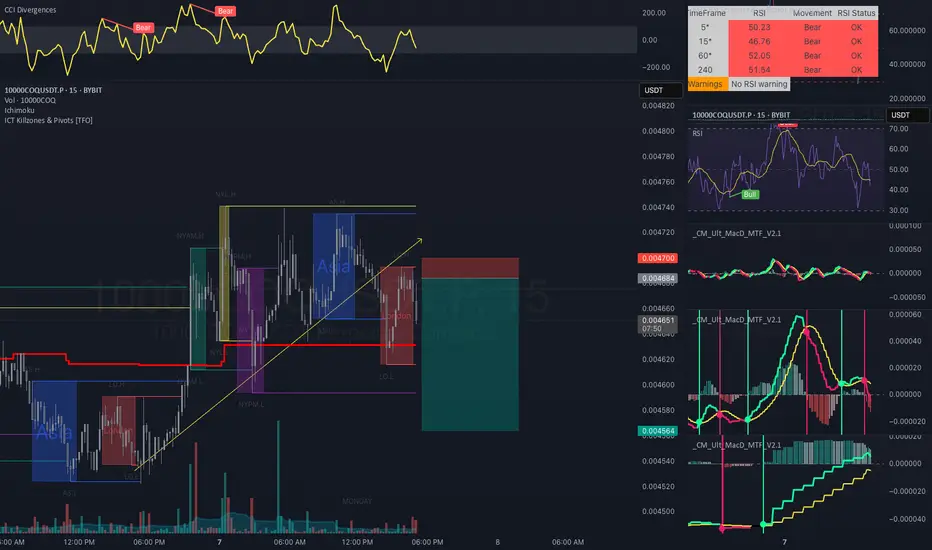
Shorting COQ HereI see multiple wicks around my MA resistance(red) so i'm eyeing around 0.004564. let see if it will play well.
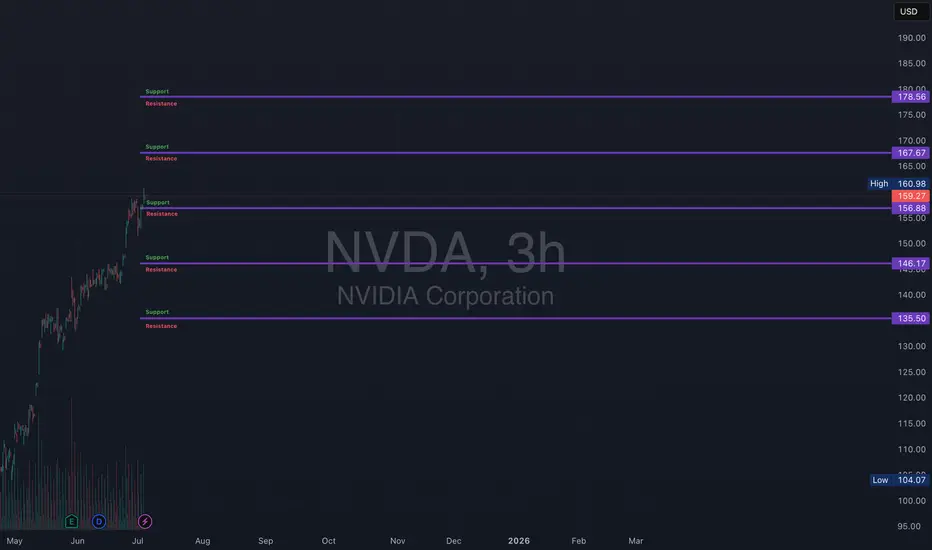
NVDA Support and Resistance Lines Valid from July 1 to 31st 2025Overview:
These purple lines act as Support and resistance lines when the price moves into these lines from the bottom or the top direction. Based on the direction of the price movement, one can take long or short entries.
Trading Timeframes
I usually use 30min candlesticks to swing trade options by holding 2-3 days max. Anyone can also use 3hr or 4hrs to do 2 weeks max swing trades for massive up or down movements.
I post these 1st week of every month and they are valid till the end of the month.
Bitcoin Euro is €82,000 nextIn this video I go through an idea that may take bitcoin down to the €82,000 region .
I cover the current price action and run through a scenario of bitcoin coming down to the Newley spawned quarterly pivots and faking out at the value area low before coming back up into the range .
The tools I used in the video are quarterly pivots , anchored vwap , Fibonacci, fixed range volume profile and a tpo chart .
Appreciate your following and Good luck with your trading !

SHORT ON EUR/USDEU has given a nice bearish setup with a rising channel.
I will be selling EU to the next demand level looking to catch 200-300 pips.
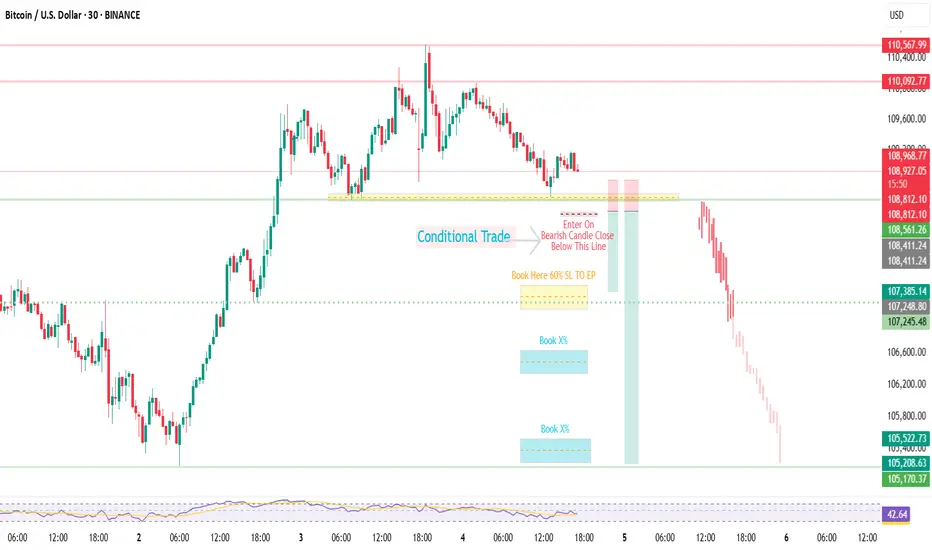
BTCUSDBTCUSD | Quiet Market Play – Conditional | Trade Based On Bearish Candle Closure
After a sharp upward move, price is now losing momentum and consolidating.
Currently entering a short position after breaking the resistance
Trade includes full risk management, marked on chart. 🔴📉
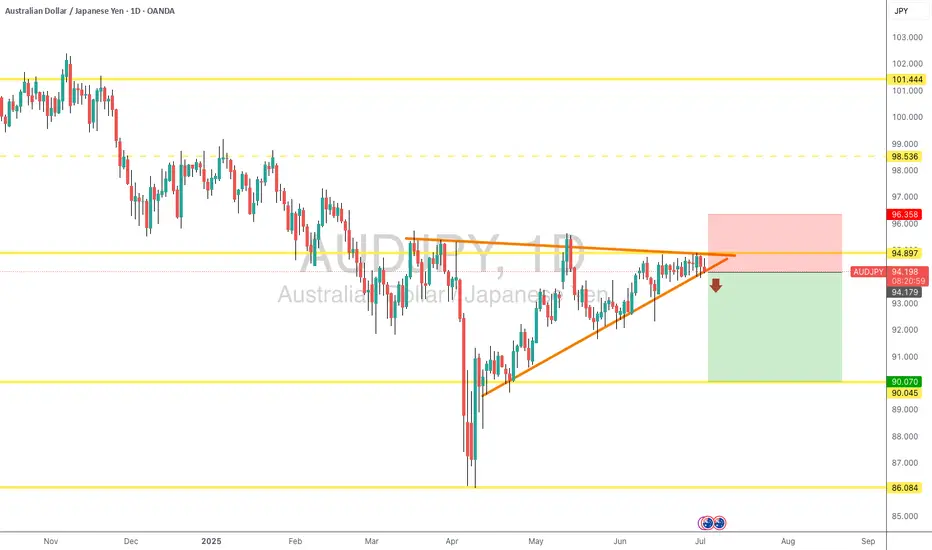
AUD/JPY# AUD/JPY: Two High-Probability Bearish Setups 🎯
## Overview
AUD/JPY continues to respect its macro downtrend structure, offering two compelling bearish opportunities as price approaches critical resistance levels. Currently trading at 94.398, the pair sits at an inflection point between key support and resistance zones.
---
## 📊 Setup 1: Resistance Zone Rejection (Primary)
### Key Level: 95.289 (Major Resistance)
This level has proven its significance multiple times:
- ✅ Strong resistance throughout recent months
- ✅ Clear seller dominance at this zone
- ✅ Confluence with descending channel structure
### Entry Strategy:
1. **Wait** for price to approach 95.289
2. **Identify** bearish rejection patterns:
- Pin bars / Shooting stars
- Bearish engulfing candles
- Multiple wick rejections
3. **Enter** short on confirmed rejection
4. **Stop Loss**: 95.50-95.60 (above resistance)
5. **Targets**:
- TP1: 93.240 (1:2 RR)
- TP2: 92.271 (1:3.5 RR)
---
## 📊 Setup 2: Rising Wedge Breakdown (Secondary)
### Pattern Recognition:
A textbook rising wedge has formed since the May lows - a bearish reversal pattern within the larger downtrend context.
### Entry Strategy:
1. **Monitor** the lower wedge trendline
2. **Wait** for decisive breakdown with volume
3. **Enter** short on retest of broken support
4. **Stop Loss**: Above recent swing high
5. **Target**: 93.240 support zone
---
## 📈 Market Structure Analysis
### Macro Trend: BEARISH 📉
- Consistent lower highs and lower lows from 102+ levels
- Currently in corrective bounce phase
- Respecting descending channel boundaries
### Current Position:
Price trapped between:
- **Resistance**: 95.289
- **Support**: 93.240
- **Deep Support**: 92.271
---
## ⚠️ Risk Management
**Patience is key!** Current price offers poor risk/reward. Wait for:
1. **Scenario A**: Test of 95.289 resistance → Short opportunity
2. **Scenario B**: Break below wedge support → Short opportunity
3. **Scenario C**: Break above 95.289 → Invalidation, stay flat
### Position Sizing:
- Risk per trade: 1-2% of account
- Adjust position size based on stop distance
---
## 🎯 Trade Summary
**Bias**: BEARISH 🐻
**Preferred Setup**: Resistance rejection at 95.289
**Risk/Reward**: Minimum 1:2
**Timeframe**: Daily
---
*Remember: The best trades come to those who wait. Let price come to your levels, don't chase!*
**What's your view? Drop a comment below! 👇**
*Disclaimer: This is not financial advice. Always do your own research and manage risk appropriately.*
---
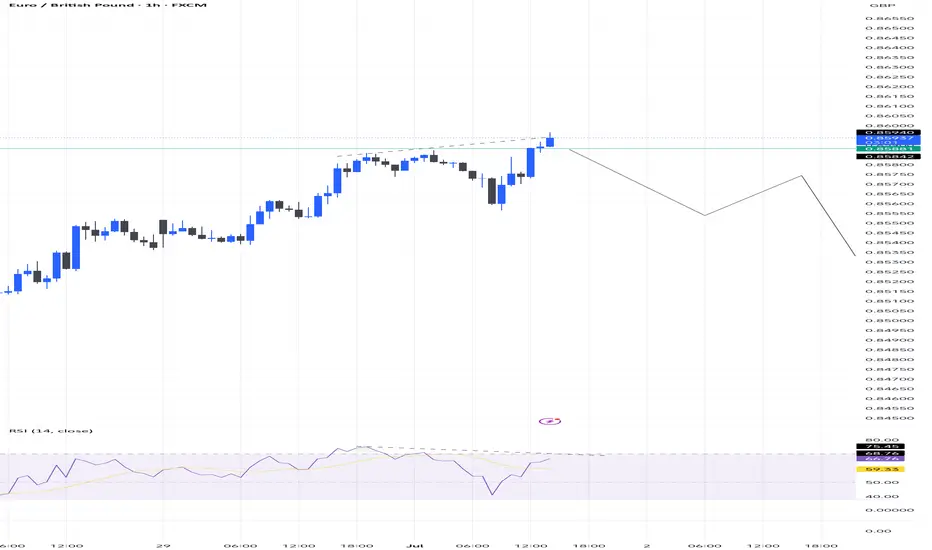
EURGBP short trade Idea with divergence 💶 EURGBP SHORT SETUP – Clean Supply Rejection 📉🔥
Looking at a fresh opportunity to short EURGBP based on recent price action and structure:
🔹 Market Context:
Price recently pushed into a key supply zone or resistance around 0.84800–0.85000.
Multiple rejections spotted at that level – suggesting weak bullish momentum and engineered liquidity.
🔹 Setup Bias: Bearish
We’re anticipating a short-term correction or continuation to the downside, targeting recent demand zones or imbalances.
🔹 Trade Setup (Example):
Entry: ~0.84800
Stop Loss: ~0.85100 (above supply wick)
Take Profit: ~0.84100 (demand/imbalance fill area)
Risk to Reward: ~1:3 potential
🔹 Confluences:
Rejection candle at supply
Divergence
Price broke structure (BOS) to the downside earlier
Overbought signals (if using RSI/Stoch)
Clean imbalance zone below
📊 Execution Tip:
Wait for confirmation (M15 bearish engulfing / lower high break) to avoid early entries.
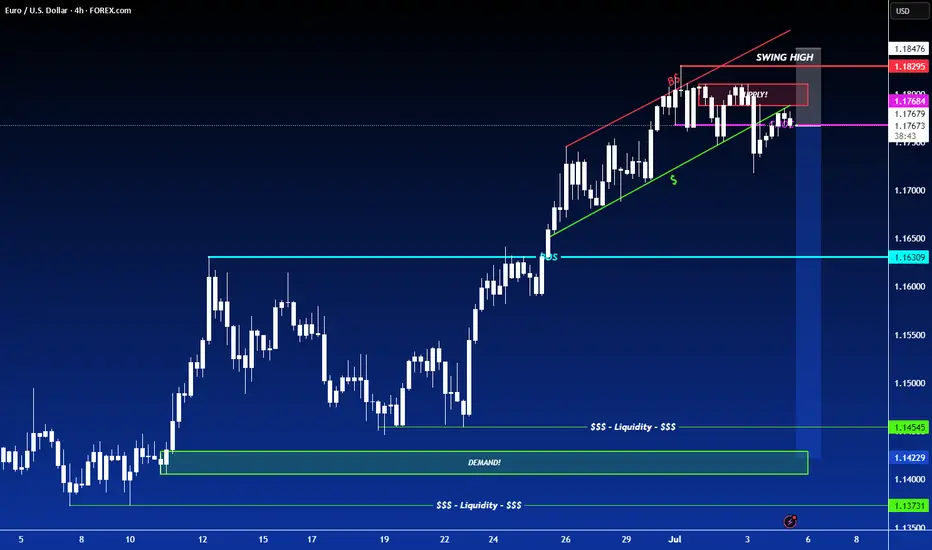
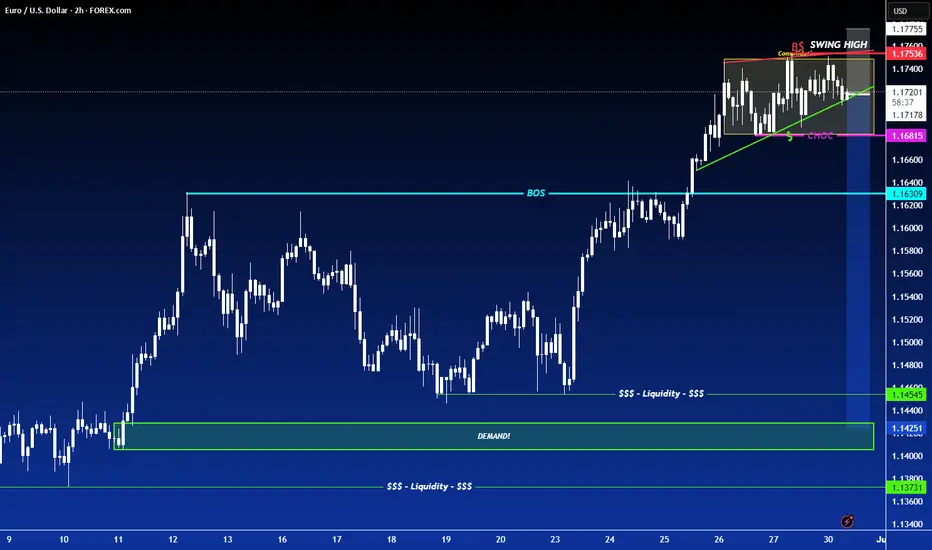
SHORT ON EUR/USDEUR/USD has a rising wedge within a consolidation zone.
The dollar looks like it will rise which will cause this pair to fall.
I will be selling EU looking to catch 150-300 pips this week.
BTCUSD📉 The Setup: Bearish Divergence on BTCUSD (1H/15m/30m)
🔍 Observation:
On the 1 Hour chart, Bitcoin
🧠 Meaning: The Buying pressure is weakening, and a breakdown might be near!
Entry SL TP shared in chart
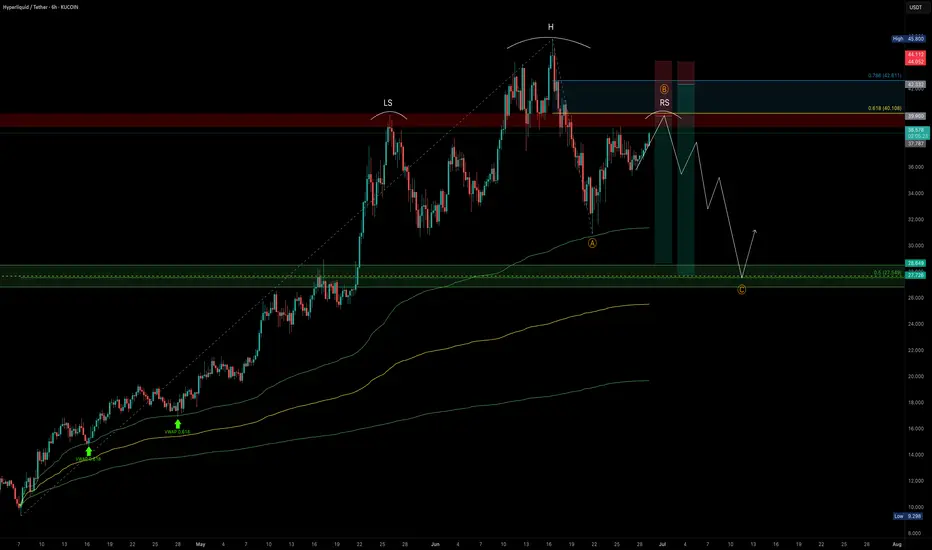
HYPE — How to Combine Fibonacci, VWAP and Market StructureAfter an explosive +392% rally in just 70 days — from $9.298 to a peak of $45.8 — HYPE has entered a consolidation range as expected. Structurally, this appears to be a 5-wave impulse now transitioning into a corrective ABC pattern. Based on current structure, we may now be forming wave B.
What’s Unfolding Now?
A potential Head & Shoulders pattern is developing, with price currently working on the right shoulder. The $40 mark stands out as a key resistance — both technically and psychologically:
0.618 Fibonacci retracement of the down move sits at $40.108
Structural resistance from prior highs
Ideal area for a short rejection
🎯 Short Setup:
Entry: Laddered short between 0.618 ($40.108) and 0.786 ($42.611)
Stop-Loss: Above $44 (after rejection adjust to entry)
Target: $28–$27 zone
R:R potential: 1:3 up to 1:9 depending on entry quality
📍 Why $28–$27 Is Key Support:
0.5 Fibonacci retracement of entire +392% rally sits at $27.549
Anchored VWAP from the rally origin ($9.298) aligns around this zone
Weekly & Monthly S/R convergence
VAH (Value Area High)
0.618 Fibonacci Speed Fan also aligns as dynamic support
Fair Value Gap (FVG) lies in this region
Weekly 21 EMA at $28.05/Weekly 21 SMA at $24.10 — both key moving averages providing layered support and trend structure
📐 Bonus Confluence Insight:
If this is indeed wave B, then projecting a 0.786/1.0 Trend-Based Fib Extension from wave A aligns well with the 0.5 fib retracement at $27.5.
📚 Educational Insight:
Stacking confluences such as Fibonacci retracements, anchored VWAPs, volume zones, EMA/SMA levels, and harmonic structures helps identify high-probability zones where smart money is likely to act. These levels become even more powerful when they align across multiple tools and timeframes. Always confirm with price action.
_________________________________
💬 If you found this helpful, drop a like and comment!
Want breakdowns of other charts? Leave your requests below.
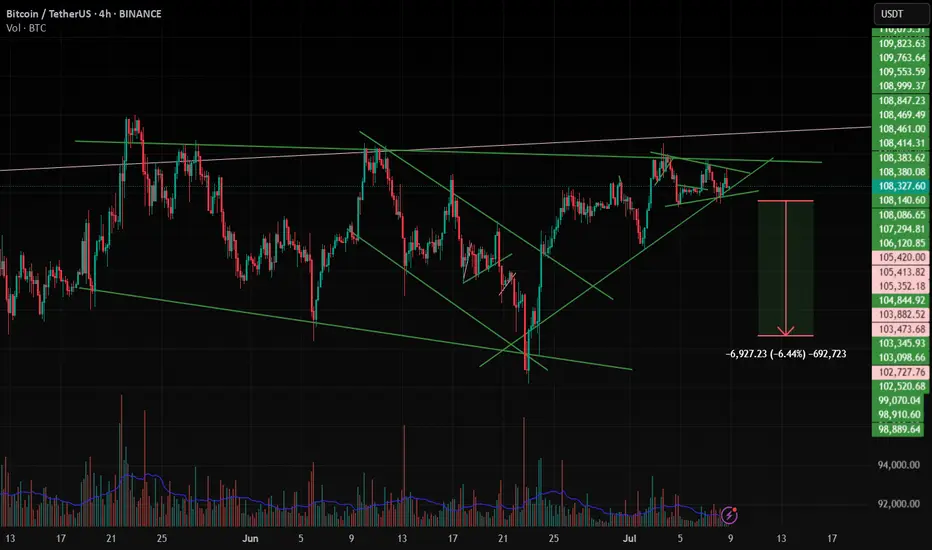
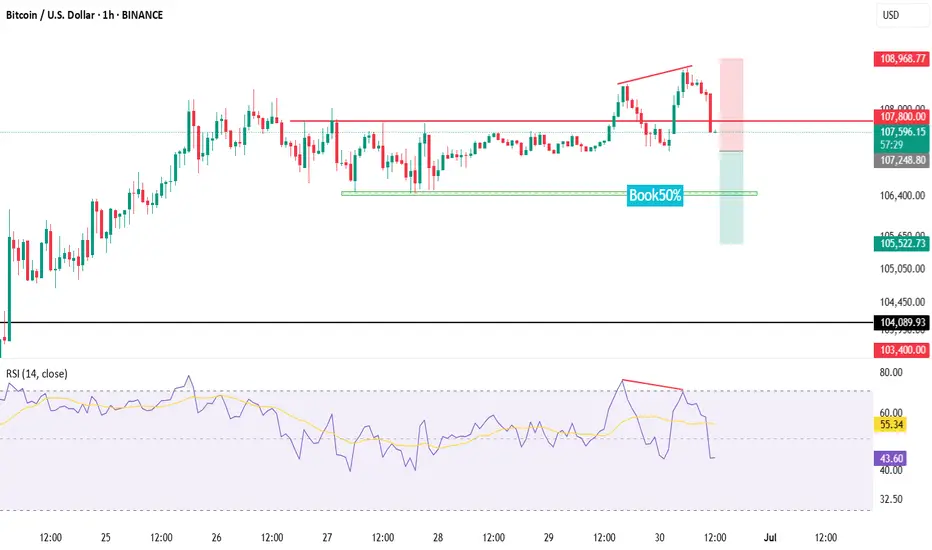
BITCOIN - SHORT OPPORTUNITY AND LACK OF MOMENTUMBINANCE:BTCUSDT has been lacking momentum in the last few days. It looks to me that "Good News" is almost "No News" in regards to the Iran war or any crypto legislation. Summer is looking a lot like sideways movement, and due to the previous explosion in momentum and volume, I think the lack of it will bring the price down in the following days or weeks.