USDCAD SHORT FORECAST Q2 W24 D12 Y25USDCAD SHORT FORECAST Q2 W24 D12 Y25
Professional Risk Managers👋
Welcome back to another FRGNT chart update📈
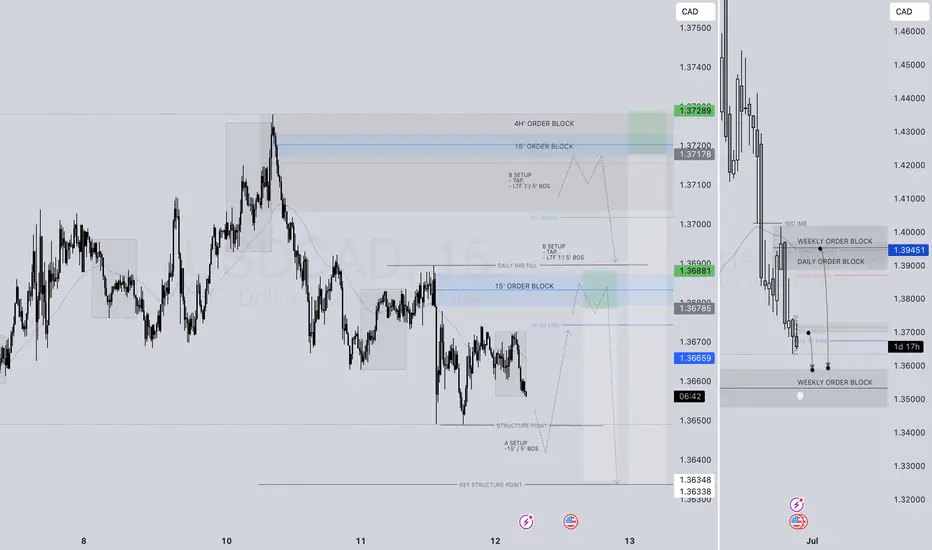
Diving into some Forex setups using predominantly higher time frame order blocks alongside confirmation breaks of structure.
💡Here are some trade confluences📝
✅4H order block rejection
✅HTF 50 EMA
✅Intraday bearish breaks of structure to be identified
✅15’ order block identified
🔑 Remember, to participate in trading comes always with a degree of risk, therefore as professional risk managers it remains vital that we stick to our risk management plan as well as our trading strategies.
📈The rest, we leave to the balance of probabilities.
💡Fail to plan. Plan to fail.
🏆It has always been that simple.
❤️Good luck with your trading journey, I shall see you at the very top.
🎯Trade consistent, FRGNT X
Shortsetup
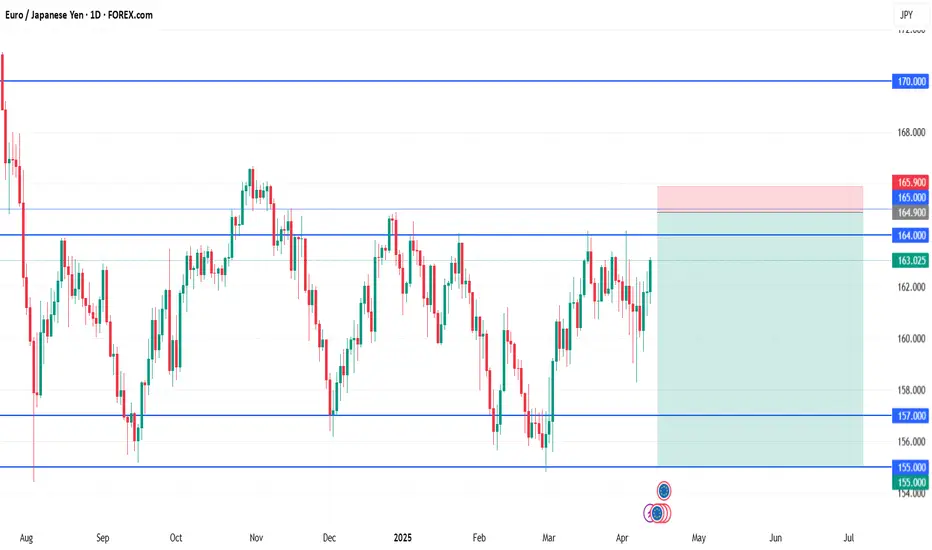
EUR/JPY Short🎯 Trade Setup Plan
👇 Aggressive Entry (Riskier)
Sell Limit: 164.90
SL: 165.90
TP1: 160.00
TP2: 157.00
TP3 (optional): 155.00
Use this only if you want to catch the wick, but recognize the higher chance of being swept.
✅ Conservative Entry (Recommended)
Wait for a daily candle close under 162.00 after touching 164. That confirms rejection.
Entry: On next day’s minor retest (e.g., 162.50–163.00)
SL: 165.50 (above recent highs)
TP1: 160.00
TP2: 157.00
TP3: 155.00
Risk: 1–2% depending on confirmation strength
📌 Optional Breakout Plan (In case resistance breaks cleanly)
Buy Stop: 165.60
SL: 164.30
TP: 170.00 (weekly resistance)
Use only if a strong daily close above 165 confirms breakout.
CPI, US inflation, gold price waiting to decrease⭐️GOLDEN INFORMATION:
Gold (XAU/USD) drew fresh bids in Wednesday’s Asian trading, reclaiming the $3,340 level and edging back toward this week’s high. A U.S. federal appeals court decision allowing President Donald Trump’s broad tariffs to remain in force—for now—added a fresh layer of trade uncertainty and stoked safe-haven demand. Heightened geopolitical tensions and growing expectations that the Federal Reserve will cut rates in September further bolstered the non-yielding metal. Even so, optimism surrounding ongoing U.S.–China talks has lifted broader risk sentiment, while a mildly stronger U.S. Dollar is helping keep gold’s upside in check.
⭐️Personal comments NOVA:
Gold price recovered, buying power increased gradually in Asian session, approaching resistance zone 3348
⭐️SET UP GOLD PRICE:
🔥SELL GOLD zone : 3373- 3375 SL 3380
TP1: $3360
TP2: $3350
TP3: $3340
🔥BUY GOLD zone: $3278- $3280 SL $3273
TP1: $3290
TP2: $3300
TP3: $3314
⭐️Technical analysis:
Based on technical indicators EMA 34, EMA89 and support resistance areas to set up a reasonable sell order.
⭐️NOTE:
Note: Nova wishes traders to manage their capital well
- take the number of lots that match your capital
- Takeprofit equal to 4-6% of capital account
- Stoplose equal to 2-3% of capital account
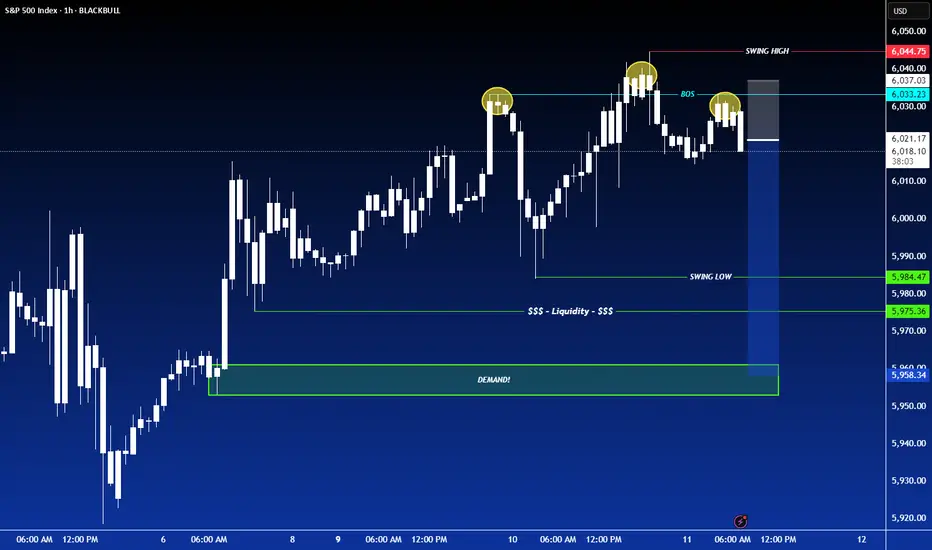
SHORT ON SPY (SPX/USD)SPY has failed to create higher highs and given us a head and shoulders pattern.
I will be selling spy to the next level of demand looking to catch 50-60 points.
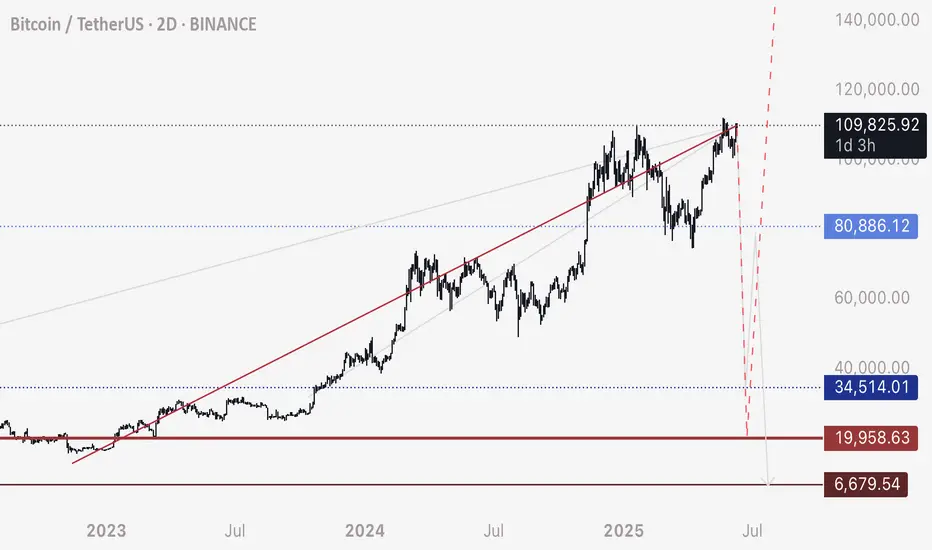
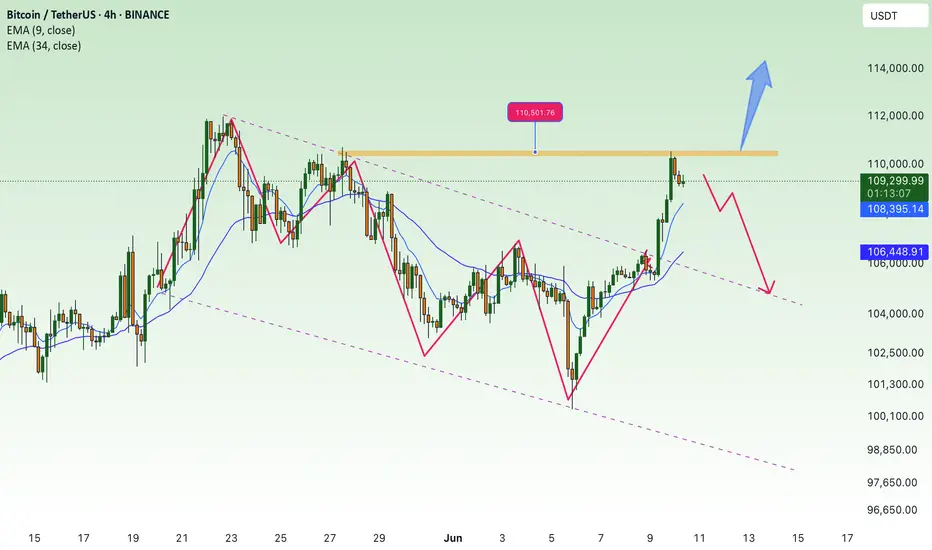
BTC - Be mindful of resistance around 109,800 to 110,000Per my second last post about this red trendline - be mindful that there is a resistance located 109,800 to 110,000 zone.
Although Bitcoin can break above, that doesn’t mean the resistance is invalid. Price will weave above and below until it sticks and plays out.
Personally I watch these levels for sudden fast movement and confirmation that it’s holding as resistance.
If you see a fast drop initiate from these levels, be mindful that this could be indicative of intention to hit the lows around 20,000.
For more information see my previous posts.
Happy trading
Selling pressure, bears active⭐️GOLDEN INFORMATION:
Gold prices (XAU/USD) edge higher toward $3,325 during the early Asian session on Tuesday, supported by a softer US Dollar as markets turn cautious ahead of key developments in US-China trade negotiations.
Delegations from the United States and China are set to continue discussions for a second consecutive day in London. President Donald Trump expressed optimism, stating the talks “should go very well.” According to US officials, discussions may lead to Washington lifting certain tech export restrictions in exchange for Beijing easing controls on rare earth exports — materials vital to sectors ranging from energy and defense to advanced technology. The outcome of these negotiations could provide fresh direction for the precious metal.
⭐️Personal comments NOVA:
The market is mainly sideways and accumulating, under selling pressure below 3300 due to the US-China trade negotiations taking place today.
⭐️SET UP GOLD PRICE:
🔥SELL GOLD zone : 3350- 3352 SL 3357
TP1: $3340
TP2: $3330
TP3: $3320
🔥BUY GOLD zone: $3276- $3274 SL $3269
TP1: $3285
TP2: $3300
TP3: $3312
⭐️Technical analysis:
Based on technical indicators EMA 34, EMA89 and support resistance areas to set up a reasonable sell order.
⭐️NOTE:
Note: Nova wishes traders to manage their capital well
- take the number of lots that match your capital
- Takeprofit equal to 4-6% of capital account
- Stoplose equal to 2-3% of capital account
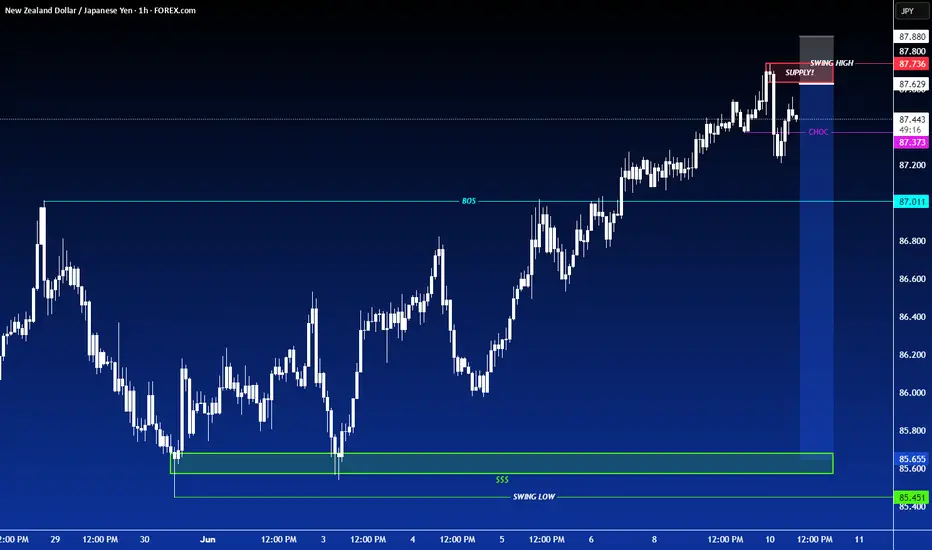
SHORT ON NZD/JPYNZD/JPY has given us a CHOC (change or character) to the downside breaking a previous low.
I will be looking for NZD/JPY to retouch the supply area before dropping.
Aiming for 100-200 pips easy!
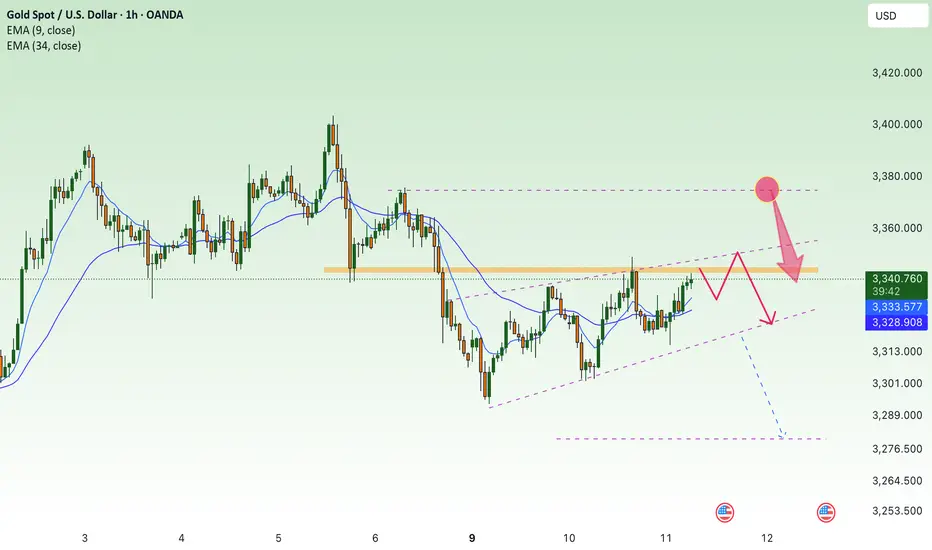
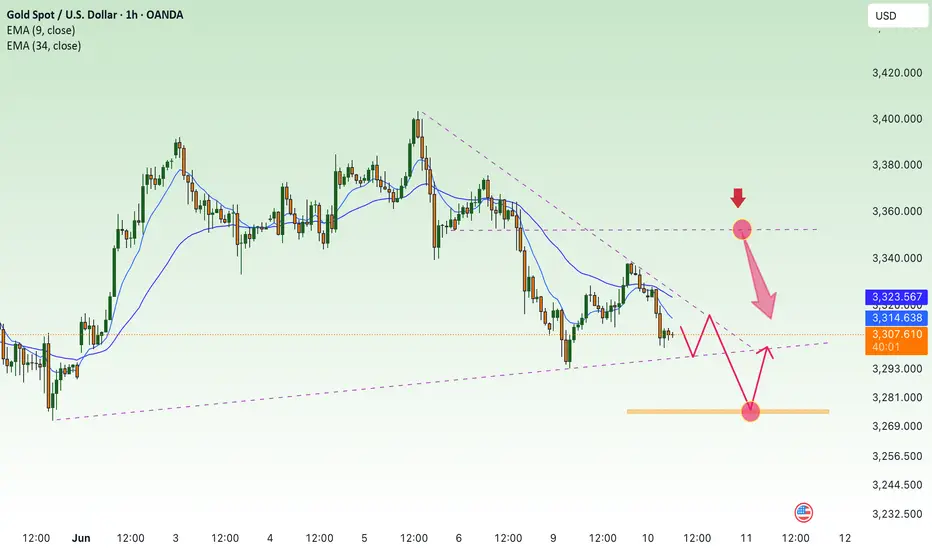
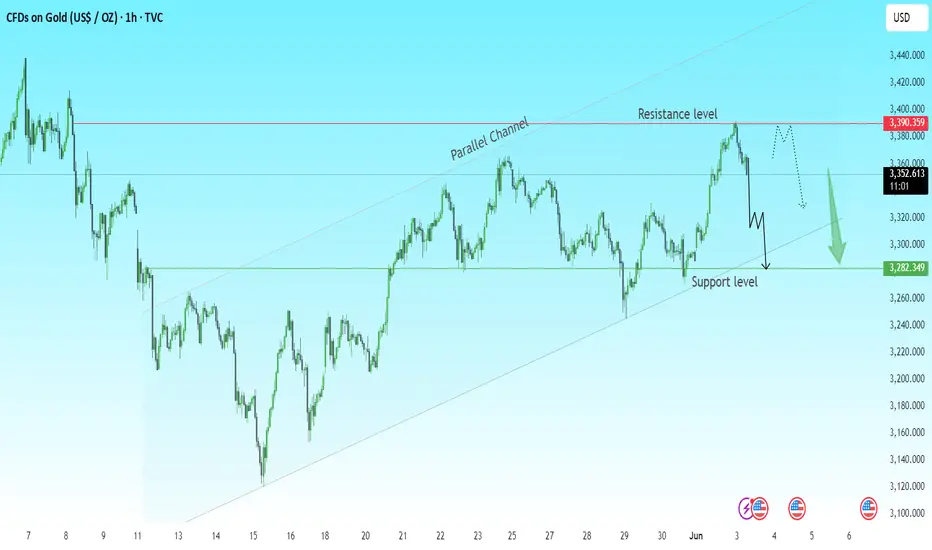
Gold Bearish Outlook | Short Opportunity AheadGold has just tested a major resistance zone at $3,390–$3,400 and faced a sharp rejection, forming a possible double top. The price is still respecting the parallel ascending channel, but current momentum suggests a bearish move could be underway.
🔍 Key Technical Levels:
Resistance: $3,390 – $3,400 (strong rejection zone)
Support: $3,282 (watch for reaction here)
Channel Structure: Price is still within an ascending channel
📉 Possible Scenarios:
1. Bearish Scenario:
If the price breaks below $3,340 and sustains momentum, we could see a drop to $3,282 support — a key level to watch for a potential bounce or further breakdown.
2. Bullish Scenario (less likely short-term):
If bulls regain control, watch for a breakout above $3,400, confirming upside continuation.
💡 Trading Idea:
Currently leaning bearish unless we see a confirmed breakout above resistance. Short setups could be considered on lower timeframes with targets near the support level.
💬 Let me know what you think — will gold break down or bounce back? 👇
👍 Like & follow for more trade ideas and updates!
#XAUUSD #Gold #TechnicalAnalysis #PriceAction #TradingView #Forex #Commodities
BTC Returns to Highest ATH💎 Update Plan BTC (June 10)
BlackRock’s spot Bitcoin ETF has made history, becoming the fastest-growing exchange-traded fund (ETF) ever by surpassing $70 billion in assets under management (AUM).
The iShares Bitcoin Trust (IBIT), launched in January 2024, has achieved this milestone in record time, reflecting surging demand for Bitcoin exposure through regulated, mainstream investment vehicles. IBIT’s exceptional growth trajectory has outpaced all previous ETFs, eclipsing even established funds like the SPDR Gold Shares (GLD) in terms of asset accumulation speed.
The ETF recently returned to net inflows — posting a $274 million single-day increase — following a brief period of outflows during a broader market pullback. This rebound signals renewed investor confidence, with capital flowing in from both institutional players and retail investors alike, underscoring Bitcoin’s growing role in diversified portfolios.
Technical analysis angle
Congratulations to investors when the Plan transaction has detected the bottom of 100k and is currently the highest at 110.5k. It is a prosperous signal for investors who are holding this power currency
Another good news is that the organizers have breaked out of the decrease price channel to confirm the trend of increasing and confidence in the price increase continues to be enhanced by the Buyer.
Currently, the BTC price area is slowed by the resistance level with Fibo 0.786 around the 110k price area. We expect the adjustment of the investors to collect goods before the price area goes further around 111.5k even 115k
At this time, whether new or old, should spend more time to practice, load more knowledge about the PTKT, as well as find knowledge posts at the channel ..., to strengthen the solid foundation, as well as avoid losing money at this time offline
==> Comments for trend reference. Wishing investors successfully trading
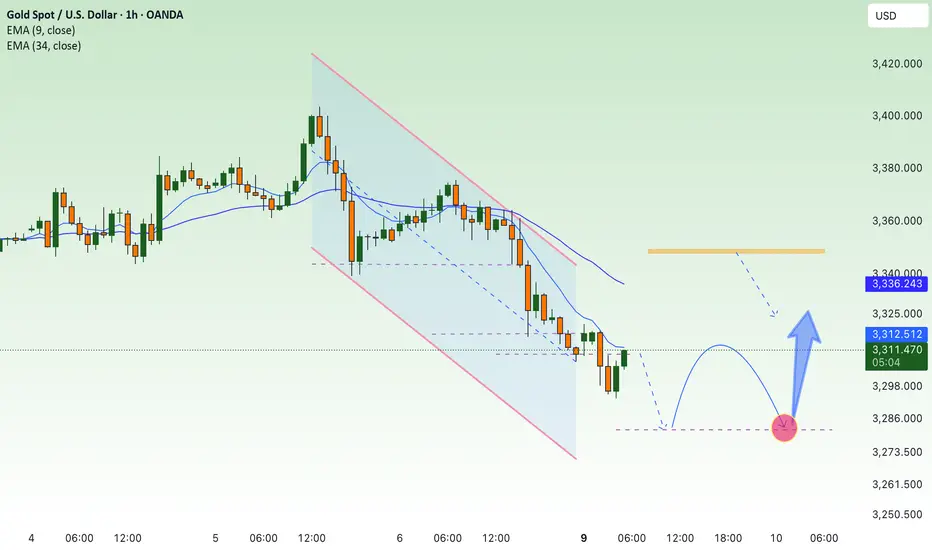
GOLD (XAU/USD) – 30M Trade Setup – June 9, 2025Bias: Short (Bearish Pullback Continuation Under $3,320)
SELL SETUP
Entry:
Below $3,309 (break of minor local support and confirmation of bearish continuation)
Stop-Loss (SL):
$3,324 (above recent local high and structure resistance)
Take-Profit 1 (TP1):
$3,290 (early June low – first demand area)
Take-Profit 2 (TP2):
$3,270 (stronger support + 1.618 extension zone)
Technical Confluence
MACD:
Bearish crossover active
Histogram turning red again after a short relief push
RSI:
Hovering around 47, rejected from the neutral 50–55 zone
Still in a bearish regime under the midline
Price Action:
Lower highs and lower lows forming
Last bullish candle rejected near $3,320
Bearish momentum holding after brief retrace
Risk Rating: Medium
Structure is clean, but risk of chop increases if price holds above $3,310
Watch for reaction at $3,309 — potential fakeout zone

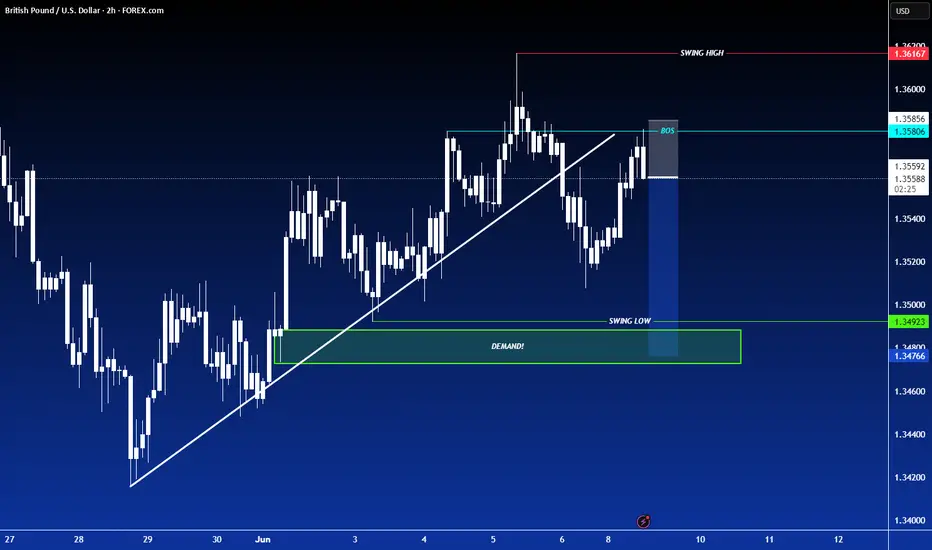
SHORT ON GBP/USDGBP/USD has just broken a uptrend line and has given us a nice break and retest to that same trendline.
The bearish have shown up and the dollar is currently looking bullish
I will be selling GBP/USD to the next level of demand for 50-80 pips
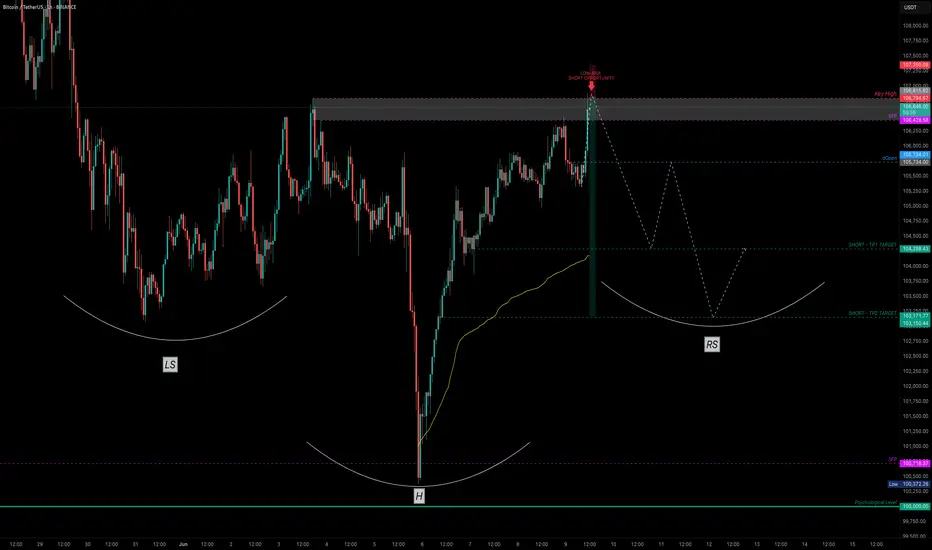
Bitcoin — Breakout or Bull Trap? SFP Setup ExplainedAfter a clean drop that nearly tagged the psychological $100K level, Bitcoin printed a Swing Failure Pattern (SFP) — sweeping the lows and snapping back with strength. That bounce wasn’t just a reaction — it was a liquidity reclaim.
Now, price structure is shaping into a potential Inverted Head & Shoulders — a classic reversal pattern often forming before a bullish continuation.
🔍 Key Level to Watch:
$106,694.63 — This recent key high was just taken out. If we see rejection here (SFP), it could set up a high-probability low-risk short opportunity.
🎯 Short Trade Idea (Only on SFP confirmation):
Entry: After price sweeps $106,694.63 and shows rejection
Stop-Loss: Above wick high (e.g., ~$107.4K)
TP Zones: $103.5K and $101.7K
R:R: ~1:7
✅ Cleaner setup with confluence from structure and liquidity — high probability if confirmed.
📚 Educational Insight: Why SFPs Work So Well
SFPs (Swing Failure Patterns) are some of the most powerful setups in trading because they:
Trap breakout traders
Sweep liquidity and reverse quickly
Offer clear invalidation (wick high/low)
Allow for tight stop-loss and high R:R setups
Using SFPs in conjunction with key highs/lows, volume, and structure dramatically increases your edge.
📈 Why Order Flow Is Crucial for SFPs
1. See the Trap Form in Real Time
SFPs are essentially traps — price sweeps a key level, sucks in breakout traders, and then reverses. Order flow tools let you see this happen:
A spike in market buys above resistance
Followed by a lack of follow-through (no new buyers)
And then an aggressive absorption or reversal (selling pressure hits)
Without order flow, this is all hidden in the candles.
2. Confirm Liquidity Sweeps with Delta & CVD
Watch for a delta spike or Cumulative Volume Delta (CVD) divergence — a clear sign that aggressive buyers are getting absorbed.
This gives you confirmation that the sweep failed, not just a random wick.
3. Tight Entries with Confidence
When you see actual trapped volume or liquidation clusters at the SFP level, you can enter tighter with conviction — because you're not guessing, you’re reacting to actual intent and failure in the market.
4. Early Warning System for Reversal or Continuation
If the SFP fails to trigger a reversal (e.g. buyers step back in with strength), you’ll see it early in the flow — and can quickly reassess.
🧠 Bottom Line:
Order flow lets you stop guessing and start seeing the actual fight between buyers and sellers. Combine it with SFPs, and you're not just trading price — you're trading intent. That edge is huge.
_________________________________
💬 If you found this helpful, drop a like and comment!
Want breakdowns of other charts? Leave your requests below.
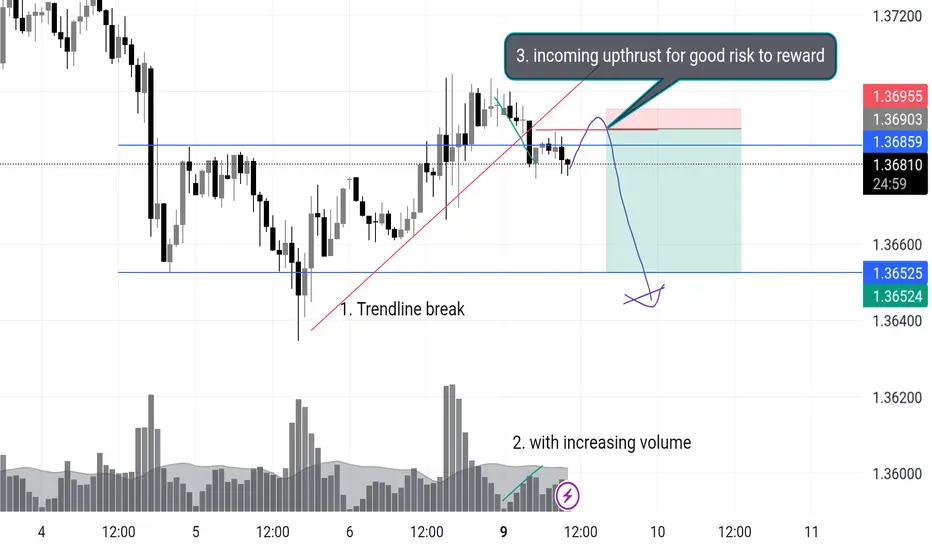
USDCAD Short Opportunity Description :
USDCAD is setting up for a potential short — I’m watching closely for an upthrust into the highlighted zone to initiate the position. Here’s my current read:
🔍 Technical Breakdown:
1. Trendline Break
Previous bullish trendline broken with conviction. Market structure now vulnerable to bearish continuation.
2. Volume Spike with Selling Pressure
Notable increase in volume on bearish candles — suggests smart money exiting or early sellers stepping in.
3. Anticipating an Upthrust
Watching for price to sweep the highs around 1.3695–1.3700, fail to sustain, and drop back inside range.
This would provide a low-risk entry with tight stops above the highs and 5r+ down to 1.3652, possibly even lower.
📌 Trade Plan:
Entry Zone: 1.3695–1.3700 (after upthrust confirmation)
Stop: Above 1.3710
TP1: 1.3652 (structure low)
TP2: 1.3600 (extended target if momentum builds)
---
🧠 Why This Setup?
This aligns with key principles I trade:
Trendline breaks often lead to retests followed by continuation.
Rising volume on the break is confirmation, not noise.
A failed breakout (upthrust) into previous supply zones is often the "last push" before price collapses.
Let me know if you're seeing something different. This is how I’m planning to attack the chart today.
Gold price recovers, accumulates new week⭐️GOLDEN INFORMATION:
Gold prices (XAU/USD) hold steady near $3,310 during the early Asian trading hours on Monday, with the precious metal struggling to gain traction amid renewed strength in the US Dollar (USD). While a firmer Greenback poses headwinds for gold, lingering uncertainty surrounding President Donald Trump’s tariff strategy continues to offer some support.
On Friday, upbeat labor market data bolstered the dollar, pressuring dollar-denominated assets like gold. The US Bureau of Labor Statistics (BLS) reported that Nonfarm Payrolls rose by 139,000 in May, outpacing expectations of 130,000 and surpassing the previous month's downwardly revised figure of 147,000 (from 177,000). The stronger-than-expected jobs report has dampened hopes of near-term Fed rate cuts, weighing on bullion’s appeal.
⭐️Personal comments NOVA:
Gold price takes liquidity 3294, below 3300 GAP zone last week. Accumulate and react at lower support zones
⭐️SET UP GOLD PRICE:
🔥SELL GOLD zone : 3348- 3350 SL 3355
TP1: $3340
TP2: $3330
TP3: $3320
🔥BUY GOLD zone: $3281- $3279 SL $3274
TP1: $3292
TP2: $3300
TP3: $3315
⭐️Technical analysis:
Based on technical indicators EMA 34, EMA89 and support resistance areas to set up a reasonable sell order.
⭐️NOTE:
Note: Nova wishes traders to manage their capital well
- take the number of lots that match your capital
- Takeprofit equal to 4-6% of capital account
- Stoplose equal to 2-3% of capital account
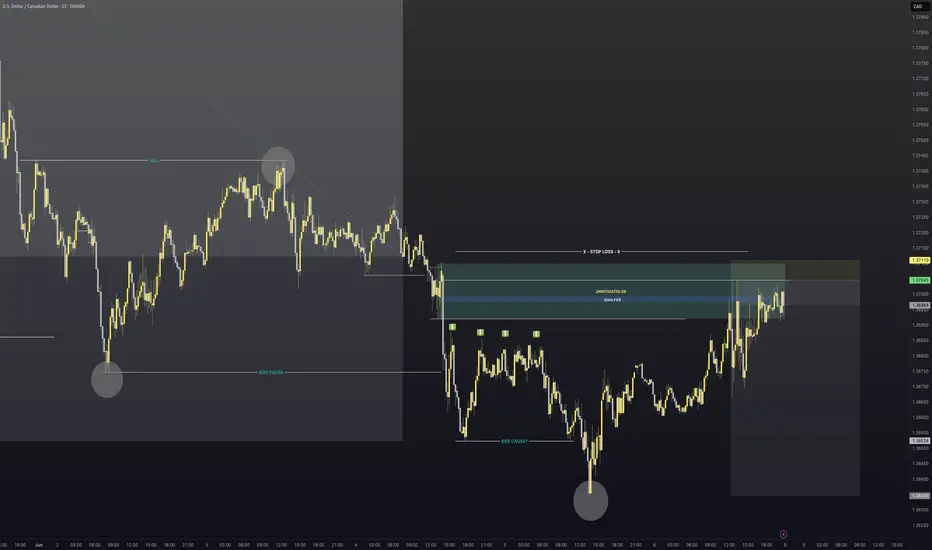
USDCAD - Short trade continuationWas triggered in to this on Friday
As we can see we had a pool of liquidity to the left. We then had the news release of NFP.
We were tagged in and then now we are looking to take price to the previous structure lows.
As you can also see we took a lovely trade last week on USDCAD to the downside.
I am still holding 0.5% of that position alongside the current one we have just been tagged into. Very nice potential for continuation to the downside.
If you have any questions for me give me a message
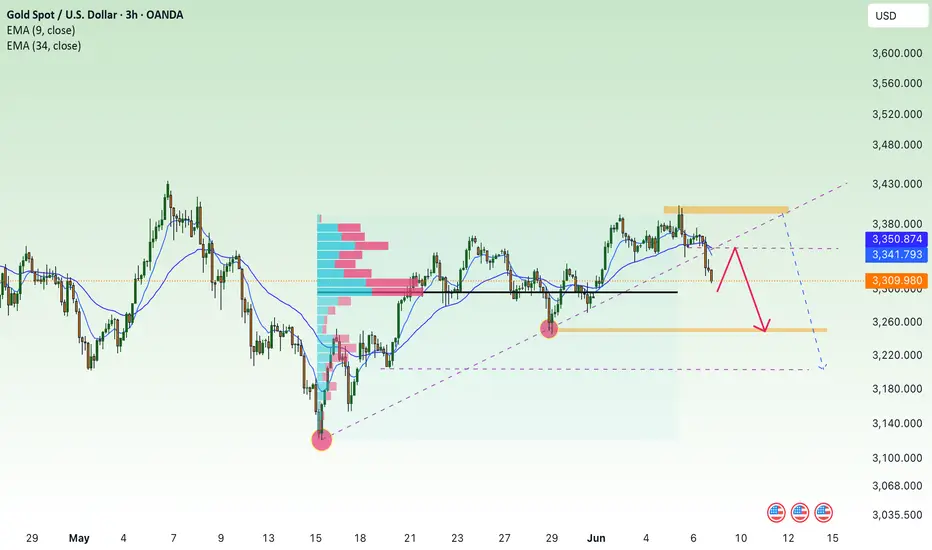
Breaking the big frame, gold price returns to accumulation✍️ NOVA hello everyone, Let's comment on gold price next week from 06/09/2025 - 06/13/2025
🔥 World situation:
Gold prices declined for a second straight session on Friday, yet remain on track to close the week with a gain of over 1.30%, as traders recalibrate expectations for Federal Reserve policy easing following a stronger-than-expected U.S. Nonfarm Payrolls report. At the time of writing, XAU/USD is trading at $3,322, marking a 0.84% daily decline.
The U.S. Bureau of Labor Statistics (BLS) reported that the labor market continues to show resilience, with the unemployment rate holding steady from April. Meanwhile, Wall Street staged a modest rebound from Thursday’s losses, despite political tensions flaring between President Donald Trump and Tesla CEO Elon Musk, following the House's approval of a bill to raise the U.S. debt ceiling.
🔥 Identify:
Gold prices reacted lower after the release of good May employment data. Breaking the H4 uptrend line, gold prices continued to accumulate.
🔥 Technically:
Based on the resistance and support areas of the gold price according to the H4 frame, NOVA identifies the important key areas as follows:
Resistance: $3348, $3400
Support: $3251, $3202
🔥 NOTE:
Note: Nova wishes traders to manage their capital well
- take the number of lots that match your capital
- Takeprofit equal to 4-6% of capital account
- Stoplose equal to 2-3% of capital account
- The winner is the one who sticks with the market the longest
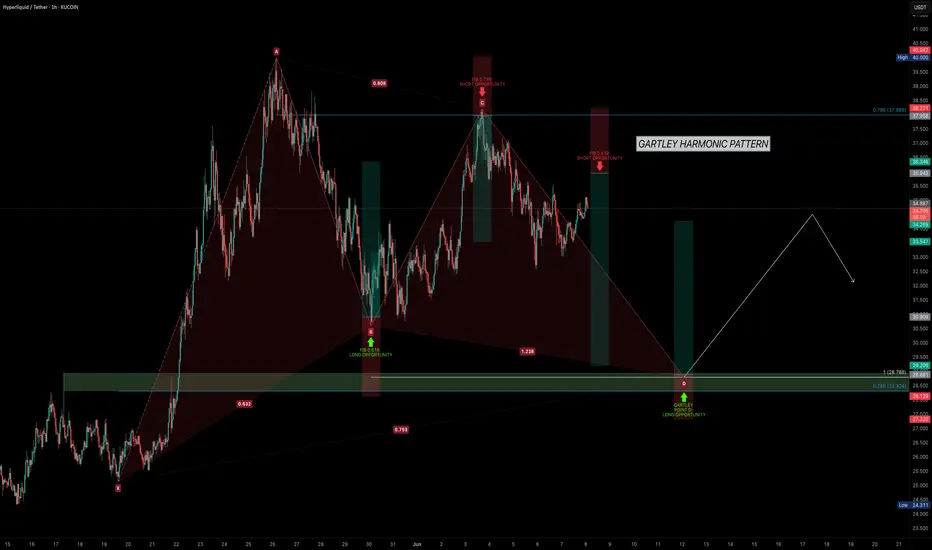
HYPE Precision Trading — Pattern, Patience, ProfitHYPE has shown strong performance since early April, maintaining a clear uptrend. Currently, the market is consolidating in a range between $30 and $40 and it’s setting up for something interesting. Let’s break it down and map the next high-probability trade setup.
Potential Gartley Harmonic Pattern Forming
A valid Gartley pattern may be developing, with point D potentially forming around the $29 level. This zone offers solid confluence for a high-probability long setup.
🟢 Long Setup – Gartley Harmonic Pattern Completion at around $29
Confluences around $29–$28.3:
0.786 Fib retracement of XA
Trend-based Fib Extension 1:1
Negative -0.618 Fib as take-profit level for prior short
Anchored VWAP (0.666 band multiplier) acting as dynamic support
200/233 EMA/SMA support on the 4H TF
FVG + liquidity pool resting just below $30
Setup Details:
Entry Zone: Trend-based Fib Extension 1:1 or laddered between $30–$28.3
Stop Loss: Below $27.5 (adjust depending on where point D forms)
Target: 0.618 of CD leg ≈ $34.4
R:R ≈ 1:3.5
🔴 Short Setup – look for rejection at $36
0.618 Fib retracement from previous move (ideal short entry)
Invalidation: Break above $38.2 (above point C)
Take Profit: $30-$29
R:R ≈ 1:3
🧠 Educational Insight:
Harmonic patterns offer precise entries and targets by aligning Fibonacci levels with market structure. When combined with tools like Anchored VWAP and liquidity analysis, they become powerful tools for swing trading.
Summary:
HYPE continues to respect structure beautifully, offering repeated swing setups in the 10%–20% range. With clear fib symmetry and predictable behaviour, it remains one of the more technically sound altcoins.
Stay patient. Wait for the pattern to complete. As always — don’t chase. Let the trade come to you.
_________________________________
If you found this helpful, leave a like and comment below! Got requests for the next technical analysis? Let me know.
Gold liquidity run short setup Update 2This video is an update on the Gold setup that was posted on the 4/06/25
I cover the price action and discuss what I think will be occurring from this point onwards as
part of the original trading plan .

BTC Under Major Resistance HereBitcoin has shown strength towards playing out these ideas, as unrealistic as it may seem.
The interactions at specific levels have shown these trendlines to be valid.
I see two scenarios if BTC holds below its resistance at 104,550 to 105,000
104,600 to 35,000
35,000 retrace to 75,000
75,000 to 7,000
Alternatively:
104,600 to 20,000
Up from 20,000
While these seem like macro projections, per my previous posts and explanations - it’s possible to see this occur in a very small period of time. IE flash crash, stop hunt, etc.
Happy trading.

Tesla Update Longs and shorts At the start of the video I recap my previous video and then bring us up to date with the present price action .
In this video I cover Tesla from the higher time frame and breakdown both a long term bullish scenario as well as a local bearish scenario .
Both of these scenarios present longs and short entries for day trade opportunities and swing positions .
Tools used Fibs , TR pocket , Volume profile , Pivots , and vwap .
Any questions ask in the comments
Safe trading and Good luck

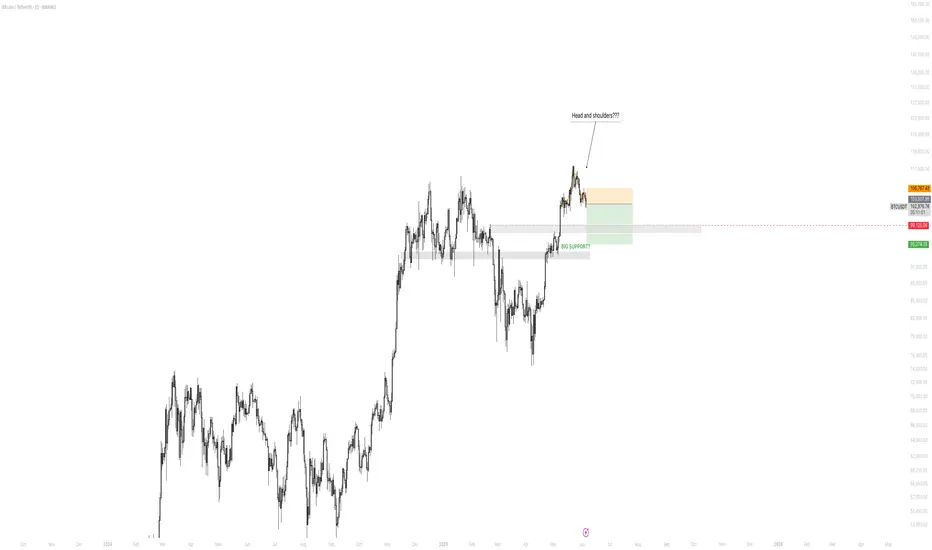
BTC PATo me it seems that the BTC chart is printing a traditional head and shoulders pattern, which would indicate probable lows at least in the short term.
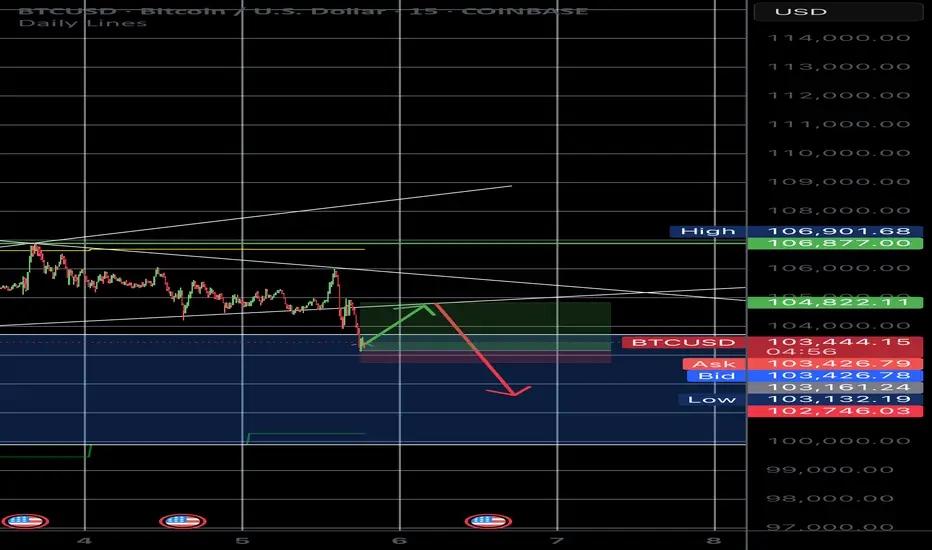
Short trade BTC/USD to 105k A retest of a crucial support is currently underway. If the support cannot be broken expect bitcoin to retest 105,000k and then retest the crucial support once again at 103,000k. If the support is broken we will drop to a range of 99,600k to 101,600k.
Entry 103,100
TP1 104,000
TP2 105,000
SL 102,750
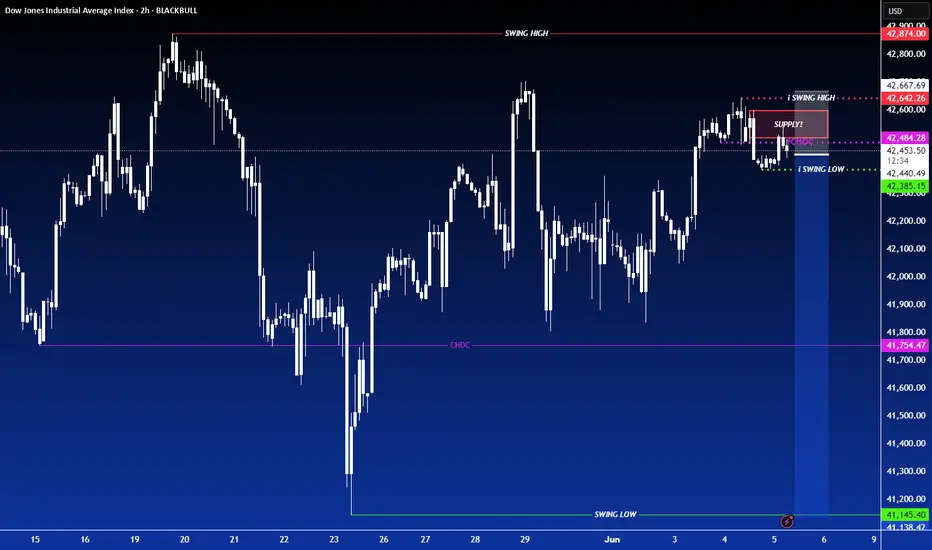
SHORT ON US30US30 Has given us a change of character to the downside with a nice retest creating a lower high.
I will be selling us30 to the next demand zone looking to catch 500-1000 points.