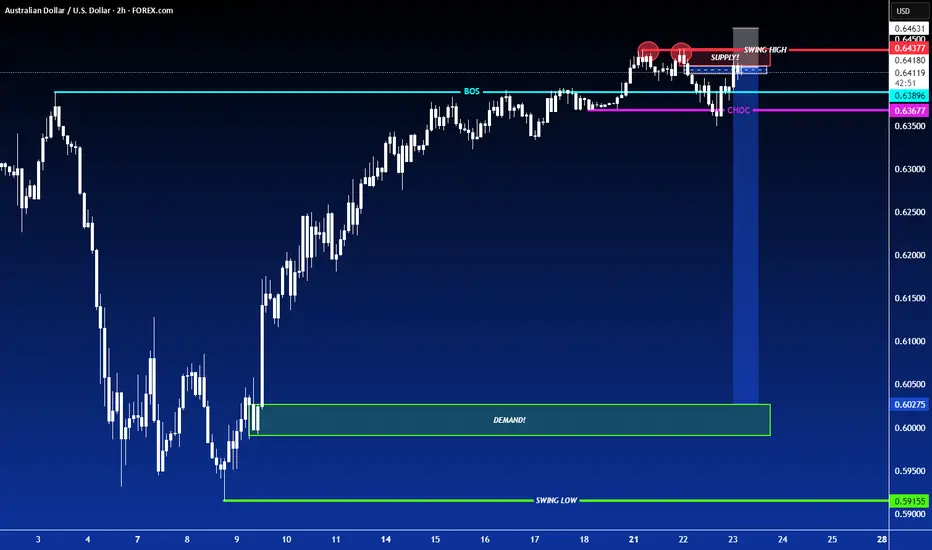
SHORT ON AUD/USDAUD/USD has given us a double top at a major resistance area/zone.
It has currently formed a lower high after giving us a change of character (choc) to the downside.
I expect price to drop to the next demand level for 200-300 pips.
Dxy News for the rest of the week should help fuel the move if positive for the dollar.
Shortsignal
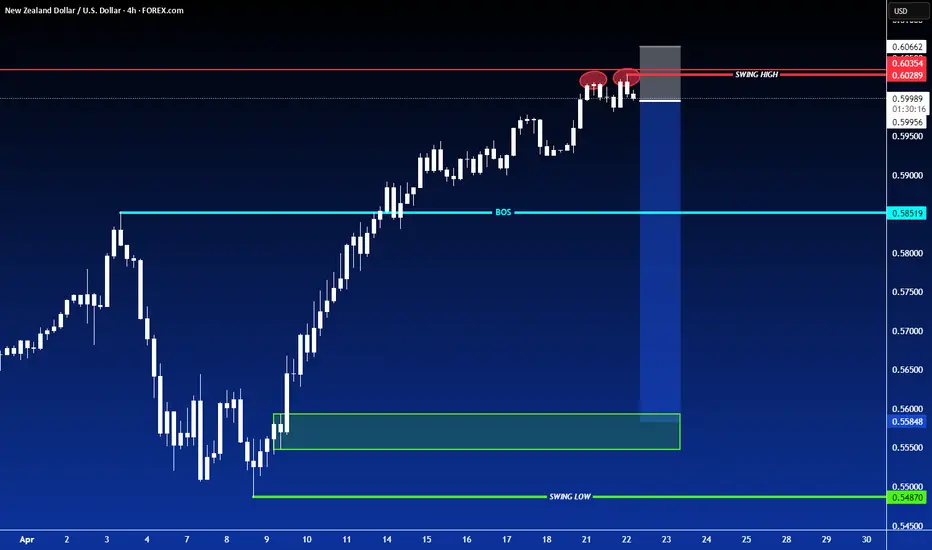
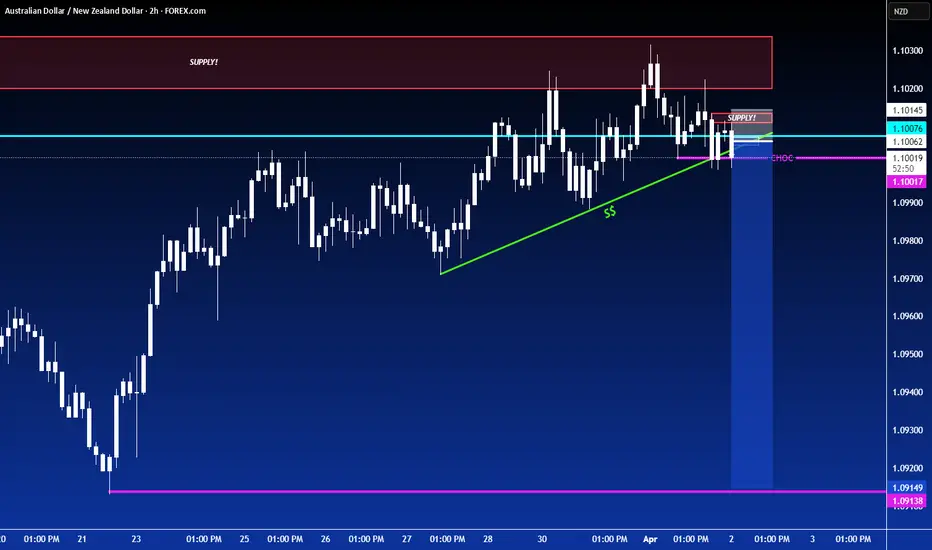
SHORT ON NZD/USDNZD/USD Is currently at a major resistance level/zone and has created a double top or equal highs.
Price has started to fall a bit, but I do believe price will rise to take out the equal highs in a "Liquidity hunt"
Overall I am taking a market execution sell on NZD/USD to the next demand level looking to catch over 300+ pips.
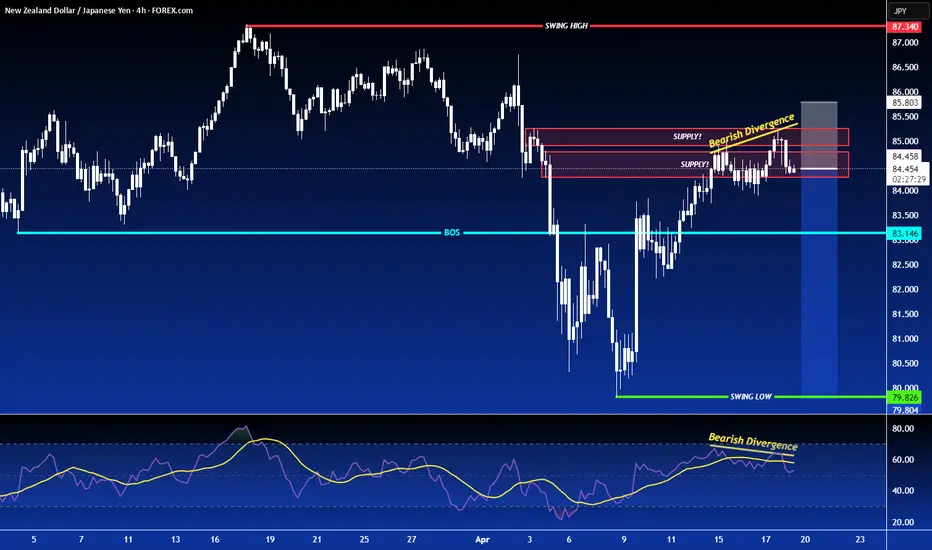
SHORT ON NZD/JPYNZD/JPY is in a overall downtrend.
Price has completed its pullback phase to a key supply area and has created bearish divergence.
I expect price to drop to the next support level which was the previous low it created. (green line).
I am aiming to make 300-400 pips
SHORT ON NZD/USDPrice is in a overall uptrend but has started its pullback phase from the high.
Got a choc (change of character) to the downside as well as equal highs/ double top forming.
Dollar news just came out positive and there is a good chance this pair could fall 200-300 pips by the end of the week.

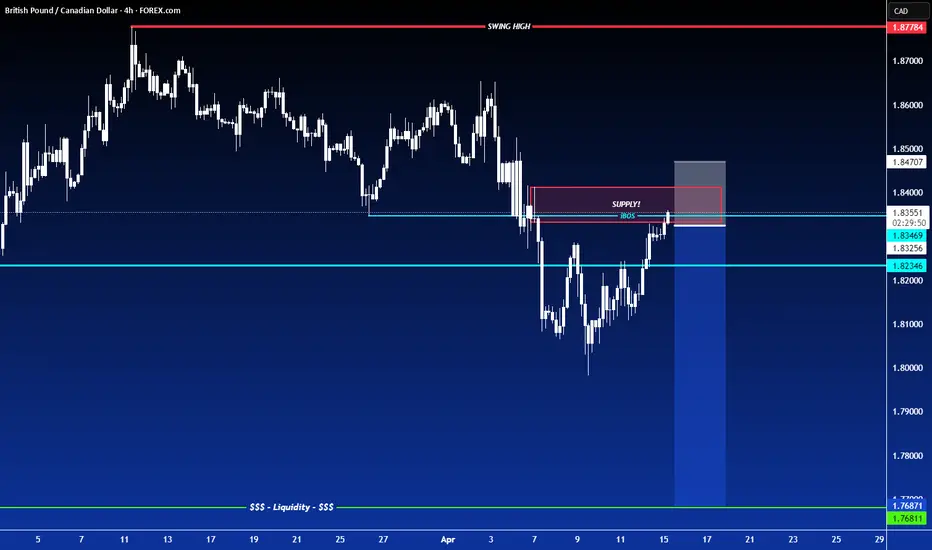
SHORT ON GBP/CADGBP/CAD is currently in the pullback phase of its overall uptrend.
Its has given a perfect BOS (break of structure) to the downside followed by a perfect retest of the supply area that created the BOS.
I will be selling GBP/CAD to the next demand level for a 500-600 pip move.
Bulls recover, gold prices grow OLD ATH ⭐️GOLDEN INFORMATION:
Gold price (XAU/USD) climbs modestly toward the $3,080 mark during early Asian trading on Wednesday, buoyed by renewed safe-haven demand as trade tensions between the United States and China intensify.
In a fresh move, US President Donald Trump announced a 90-day delay on new tariffs—set at 10%—for most US trading partners to allow space for negotiations. However, he simultaneously escalated trade friction with Beijing, raising tariffs on Chinese imports to a staggering 125% “effective immediately,” citing China's "lack of respect for global markets."
⭐️Personal comments NOVA:
The rapid recovery and large fluctuations of gold prices show that the impact of Trump's 90-day tariff postponement news is very strong. The price zone of 3135 and 3167 will be under great selling pressure. There is not much momentum for gold prices to create new ATHs.
⭐️SET UP GOLD PRICE:
🔥SELL GOLD zone : 3164- 3167 SL 3171
TP1: $3150
TP2: $3140
TP3: $3130
🔥BUY GOLD zone: $3074 - $3076 SL $3069
TP1: $3090
TP2: $3105
TP3: $3123
⭐️Technical analysis:
Based on technical indicators EMA 34, EMA89 and support resistance areas to set up a reasonable SELL order.
⭐️NOTE:
Note: Nova wishes traders to manage their capital well
- take the number of lots that match your capital
- Takeprofit equal to 4-6% of capital account
- Stoplose equal to 2-3% of capital account
Gold price accumulates below 3038, waiting for FOMC information⭐️GOLDEN INFORMATION:
Gold prices break a three-day losing streak but remain capped below the key $3,000 level, as rising US Treasury yields dampen the appeal of the non-interest-bearing metal. Despite optimism surrounding potential trade agreements among global partners, lingering tensions in the ongoing US–China trade conflict continue to keep investors on edge. At the time of writing, XAU/USD is trading flat around $2,980 per troy ounce.
⭐️Personal comments NOVA:
Gold price moves with large amplitude, in a downward correction phase. Continues to trade below 3040 waiting for the FED's move on interest rates and agreements on tariff levels of countries around the world.
⭐️SET UP GOLD PRICE:
🔥SELL GOLD zone : 3038 - 3040 SL 3045
TP1: $3028
TP2: $3015
TP3: $3000
🔥BUY GOLD zone: $2958 - $2960 SL $2953
TP1: $2975
TP2: $2990
TP3: $3010
⭐️Technical analysis:
Based on technical indicators EMA 34, EMA89 and support resistance areas to set up a reasonable SELL order.
⭐️NOTE:
Note: Nova wishes traders to manage their capital well
- take the number of lots that match your capital
- Takeprofit equal to 4-6% of capital account
- Stoplose equal to 2-3% of capital account

Gold begins to stabilize, trading around 2990⭐️GOLDEN INFORMATION:
Gold price (XAU/USD) finds renewed upward momentum during Tuesday’s Asian session, appearing to end a three-day losing streak after dipping to a nearly four-week low around the $2,957–2,956 region on Monday. Investor sentiment remains fragile amid lingering concerns over a potential global trade war, triggered by US President Donald Trump’s sweeping reciprocal tariffs announced last week. Fears of a recession and heightened uncertainty continue to fuel safe-haven demand, helping bullion stabilize after its sharp pullback from last Thursday’s all-time high.
⭐️Personal comments NOVA:
Gold price is in a correction downtrend, will continue sideways around 2950 - 3040
⭐️SET UP GOLD PRICE:
🔥SELL GOLD zone : 3036 - 3038 SL 3043
TP1: $3020
TP2: $3005
TP3: $2990
🔥BUY GOLD zone: $2962 - $2964 SL $2957
TP1: $2975
TP2: $2990
TP3: $3010
⭐️Technical analysis:
Based on technical indicators EMA 34, EMA89 and support resistance areas to set up a reasonable SELL order.
⭐️NOTE:
Note: Nova wishes traders to manage their capital well
- take the number of lots that match your capital
- Takeprofit equal to 4-6% of capital account
- Stoplose equal to 2-3% of capital account
Selling pressure remains, gold price adjusts down⭐️GOLDEN INFORMATION:
Suki Cooper, an analyst at Standard Chartered, noted, “Gold is often seen as a liquid asset that investors turn to when they need to meet margin calls in other areas, so it's not uncommon for gold to decline following a risk event, considering its function within a diversified portfolio.”
On the data front, the US economic calendar showed a solid employment report, with private sector employers adding more than 200,000 jobs in March. Although the Unemployment Rate ticked up slightly, Bloomberg suggested this was “largely due to rounding.”
According to figures from Prime Market Terminal, money market participants have already priced in more than 1% worth of rate cuts from the Federal Reserve by 2025.
⭐️Personal comments NOVA:
Short-term downtrend, disputed price zone 3054 - 2975. Gold price continues to adjust down at the beginning of the week.
⭐️SET UP GOLD PRICE:
🔥SELL GOLD zone : 3084 - 3086 SL 3091
TP1: $3070
TP2: $3055
TP3: $3040
🔥BUY GOLD zone: $2973 - $2971 SL $2966
TP1: $2980
TP2: $2990
TP3: $3000
⭐️Technical analysis:
Based on technical indicators EMA 34, EMA89 and support resistance areas to set up a reasonable SELL order.
⭐️NOTE:
Note: Nova wishes traders to manage their capital well
- take the number of lots that match your capital
- Takeprofit equal to 4-6% of capital account
- Stoplose equal to 2-3% of capital account
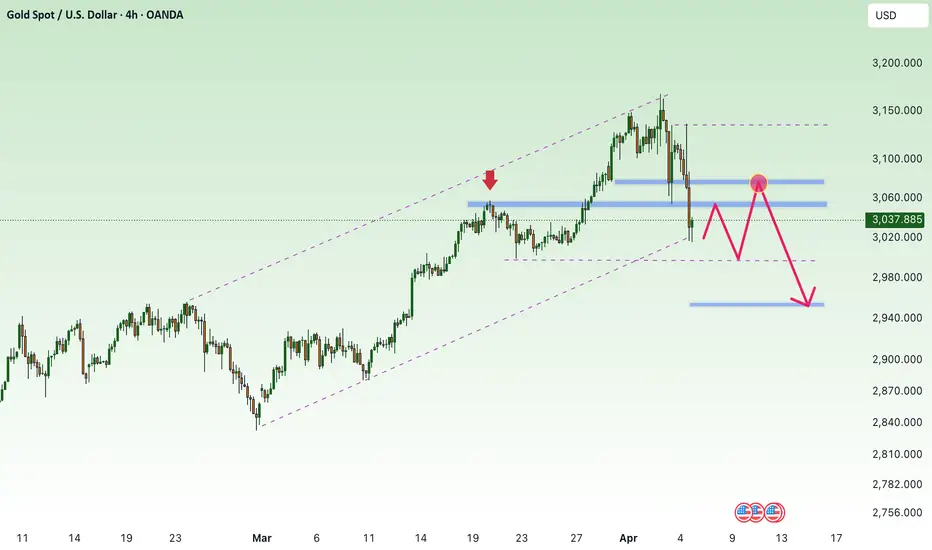
Gold prices start to cool down - back to 3000✍️ NOVA hello everyone, Let's comment on gold price next week from 04/07/2025 - 04/11/2025
🔥 World situation:
Gold (XAU) prices deepened their decline on Friday, sliding to a seven-day low of $3,015 before rebounding slightly, after remarks from Federal Reserve (Fed) Chair Jerome Powell suggested that inflation may accelerate again due to the impact of tariffs. At the time of writing, XAU/USD is trading at $3,029, representing a 2.70% drop.
Market volatility persisted as tensions escalated in the ongoing trade conflict between the United States (US) and China. In addition, Powell dampened hopes for imminent Fed rate cuts, stating that tariffs are expected to affect the US economy by slowing growth and pushing inflation higher.
According to a Financial Times (FT) report, hedge funds faced their largest margin calls since the Covid-19 pandemic, triggered by President Trump’s Liberation Day announcement.
🔥 Identify:
The FOMO increase in gold prices is starting to show signs of stopping due to concerns about economic recession. Gold prices will continue to decline back to the price range below 3000, stabilizing the market again.
🔥 Technically:
Based on the resistance and support areas of the gold price according to the H4 frame, NOVA identifies the important key areas as follows:
Resistance: $3054, $3076, $3105, $3135
Support : $2998, $2953
🔥 NOTE:
Note: Nova wishes traders to manage their capital well
- take the number of lots that match your capital
- Takeprofit equal to 4-6% of capital account
- Stoplose equal to 2-3% of capital account
- The winner is the one who sticks with the market the longest
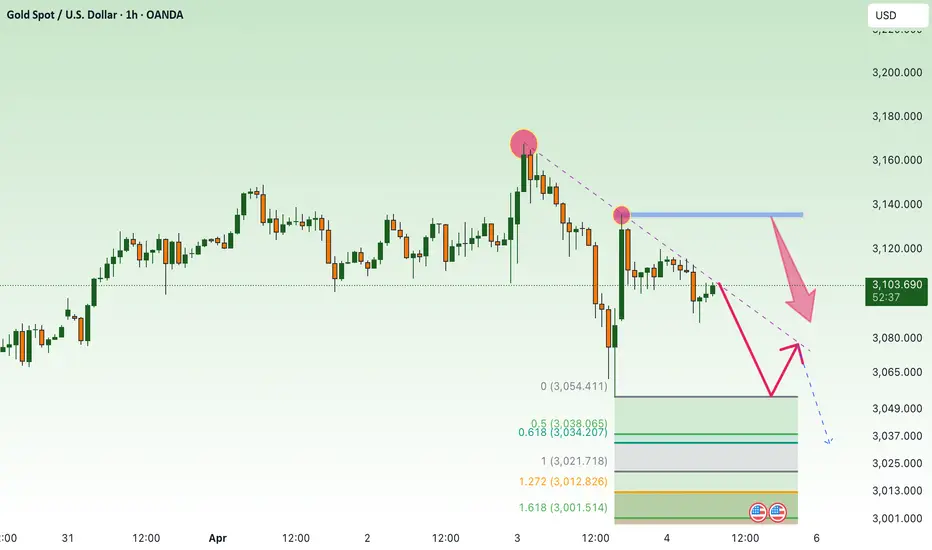
NF - Will gold prices continue to fall?⭐️GOLDEN INFORMATION:
Gold price (XAU/USD) finds it difficult to build on Thursday’s late recovery from the $3,054 region—its lowest level in a week—and comes under renewed selling pressure during Friday’s Asian session. The metal has dipped back below the $3,100 threshold in recent trading; however, the broader market backdrop still suggests caution is warranted before anticipating any significant correction from the record high reached just a day earlier.
⭐️Personal comments NOVA:
Waiting for gold price to react to decrease at trendline H1, still a downward trend, fear of trade crisis, world economy
⭐️SET UP GOLD PRICE:
🔥 SELL 3134 - 3136 SL 3141
TP1: $3125
TP2: $3110
TP3: $3090
🔥BUY GOLD zone: $3033 - $3035 SL $3028
TP1: $3045
TP2: $3060
TP3: $3075
⭐️Technical analysis:
Based on technical indicators EMA 34, EMA89 and support resistance areas to set up a reasonable SELL order.
⭐️NOTE:
Note: Nova wishes traders to manage their capital well
- take the number of lots that match your capital
- Takeprofit equal to 4-6% of capital account
- Stoplose equal to 2-3% of capital account
SHORT ON AUD/NZDAUD/NZD has given a perfect setup for a sell.
I has bearish divergence as well as a rising channel/wedge into a Major Supply Area from the Higher TF.
We have also change structure from Up to Down on the Lower Timeframe.
I will be selling AUD/NZD to the pervious swing low / demand area for about 100 pips. OANDA:AUDNZD
ALPHA - Nice Signal/TA.Those Levels played out beautifully.
i expected 2 %
7,5 % 🎯 👌
after that clear rejection, should let it run ....
Retracement to Golden Pocket and then BOOOOM ...🎯 👌
Here the original Signal/TA :
Follow for more ideas/Signals. 💲
Look at my other ideas 😉
Just donate some of your profit to Animal rights and rescue or other charity :)✌️
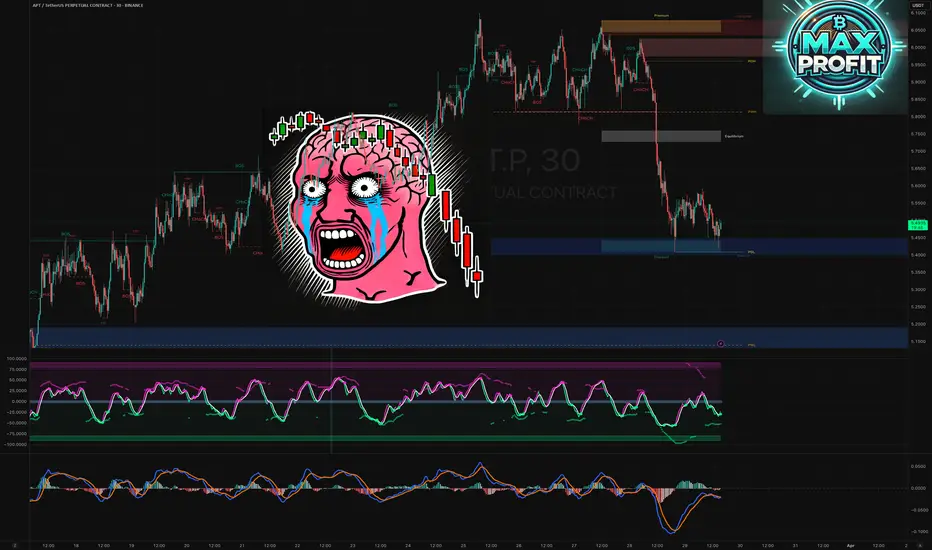
Will APTUSDT Bounce or Break? Last Chance for the Bulls?BINANCE:APTUSDT.P
🚨 APTUSDT is sitting at a crucial level. After multiple CHoCH and BoS signals, price has dumped into the key Demand Zone (PDL) . Now it’s either a spring up or a deeper dump to the next liquidity zone.
📌 Technical Outlook:
CHoCH → BoS → Liquidity Grab: Clear bearish structure.
Equilibrium broken: Bulls failed to hold control.
Now: Price is testing the blue Demand Zone (PDL) with big orders possibly resting.
🎯 Trade Plan:
Scenario 1: Long from support zone
Entry: bounce from 5.45–5.50 USDT
Stop-Loss: under wick low at <5.38 USDT
Take-Profits:
TP1: 5.70 USDT
TP2: 5.90 USDT (Equilibrium zone)
TP3: 6.00–6.15 USDT (Imbalance + Premium zone)
Scenario 2: Short after PDL breakdown
Entry: break and retest below 5.45 USDT
Stop-Loss: above 5.55 USDT
Targets:
TP1: 5.20 USDT
TP2: 5.00 USDT
📊 Confluence Factors:
Volume spike = buyer activity
Local CHoCH inside zone = reversal signal
Strong impulse down may sweep liquidity
💬 Final Thought:
APT is at a pressure point — it’s spring or capitulation. Clear setup, no tilt.
ENA - Beautiful Easy Signal/TA.signal was given hours ago to my group.
Easy instant money 3.5% 🎯 👌
The new blue marked daily level is another level.
If it breaks (volume TA too), then Short the sht out of it ...
Follow for more ideas/Signals. 💲
Look at my other ideas 😉
Just donate some of your profit to Animal rights and rescue or other charity :)✌️

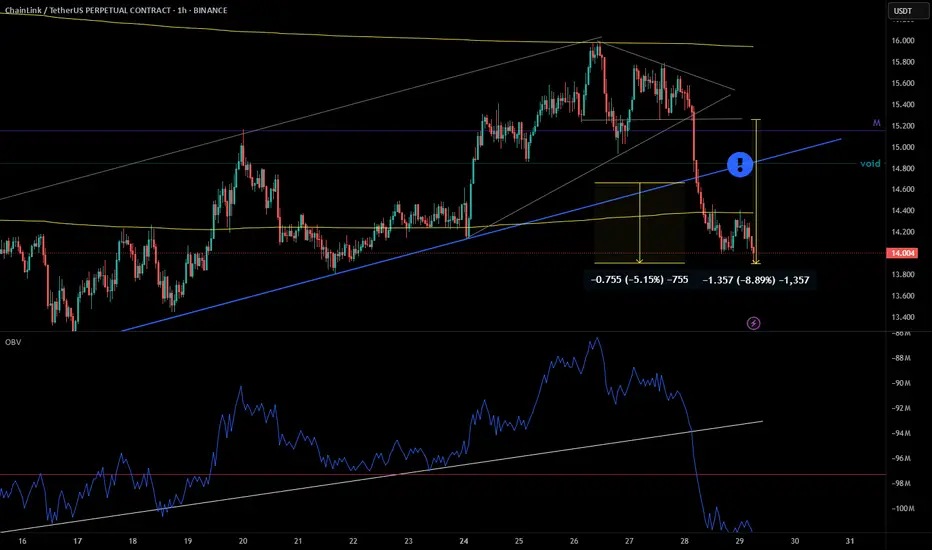
LINK - Excellent Signal yesterday.Look at what i wrote about OBV line in previous TA.
OBV Broke the line and jumped in short.
Almost 9% till now 🎯 👌
BOOOOOM ... !
Look at original Signal from yesterday :
Follow for more ideas/Signals. 💲
Look at my other ideas 😉
Just donate some of your profit to Animal rights and rescue or other charity :)✌️
AAVE - Amazing PERFECT Signal/TA YesterdayBOOM. 9 % 👌 🎯
Original TA from yesterday :https://tradingview.sweetlogin.com/chart/AAVEUSDT.P/M3HGP1df-AAVE-Possible-Good-Short/
Follow for more ideas/Signals. 💲
Look at my other ideas 😉
Just donate some of your profit to Animal rights and rescue or other charity :)✌️

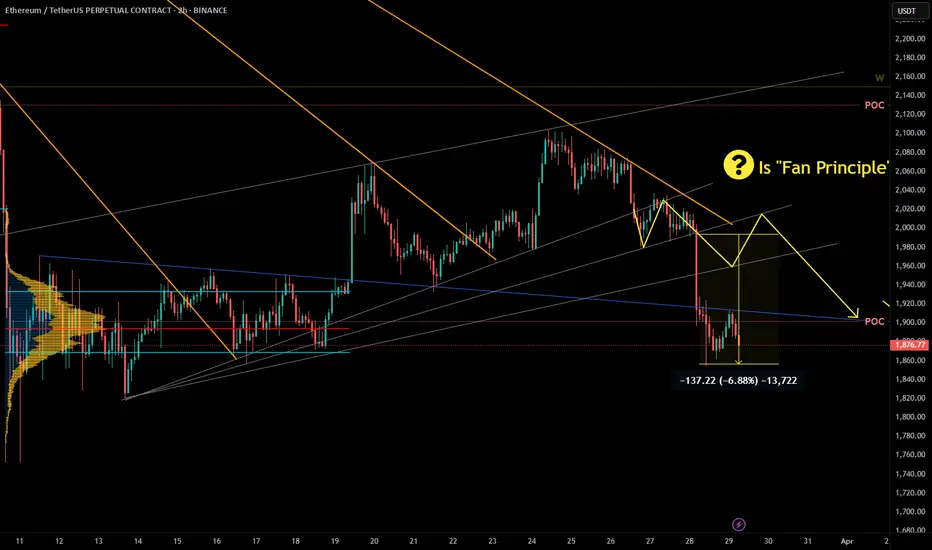
ETH - Nice Prediction I was expecting a drop. The drop was forming as "3 Fan Principle". The perfect FP didn't happen but the drop was expected. BOOM the drop.
Almost 7% an going on ... 🎯 👌
Original TA here:
Follow for more ideas/Signals. 💲
Look at my other ideas 😉
Just donate some of your profit to Animal rights and rescue or other charity :)✌️
BTC - Wonderful Prediction. What a Signal/TA :)my Last Words : " A break out downward from grey lines would be more natural regarding Volume."
That natural move happened :)
What a nice prediction.
Even retested the grey line and blue box.
Original TA here:https://tradingview.sweetlogin.com/chart/BTCUSDT.P/UGWDDY3U-BTC-New-Local-TA/
Follow for more ideas/Signals. 💲
Look at my other ideas 😉
Just donate some of your profit to Animal rights and rescue or other charity :)✌️

XRP - Excellent Signal/TA days ago. Look at Now.I gave the TA/Signal 3days ago.
Wrote "Short the sht out of it" .
Now : 13 % 🎯 👌 until now an ongoing.
Original TA here:https://tradingview.sweetlogin.com/chart/XRPUSDT.P/V6Skh0wm-XRP-Looks-Bearish/
Follow for more ideas/Signals. 💲
Look at my other ideas 😉
Just donate some of your profit to Animal rights and rescue or other charity :)✌️

LINK - Nice Levels for Short Soon !OBV :
i wanna see a nice break out from white line or even better from pink line and retest.
Often OBV breaks out before price, which is a nice indication.
Chart:
I wanna see a nice break out from that void line (which is the previous POC too) and from blue trend line.
EYES ON ....
Follow for more ideas/Signals. 💲
Look at my other ideas 😉
Just donate some of your profit to Animal rights and rescue or other charity :)✌️

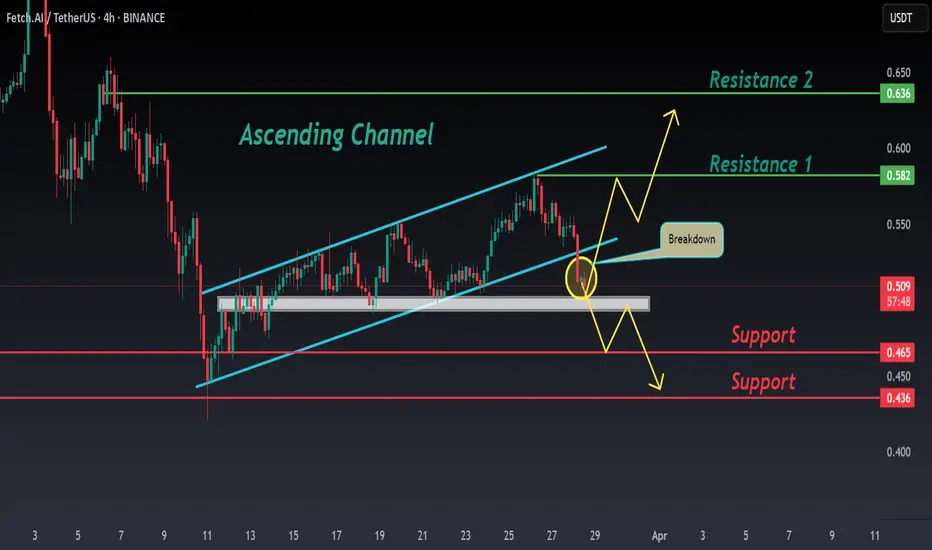
FET ANALYSIS🔆 #FET Analysis : Breakdown
📊As we can see that #FET is following ascending channel on 4hr time frame. There is a breakdown in #FET and if it sustain this breakdown then we would see a dump first then a pump.
⁉️ What to do?
- Keep your eyes on the chart, observe trading volume and stay accustom to market moves.🚀💸
#FET #Cryptocurrency #ChartPattern #DYOR
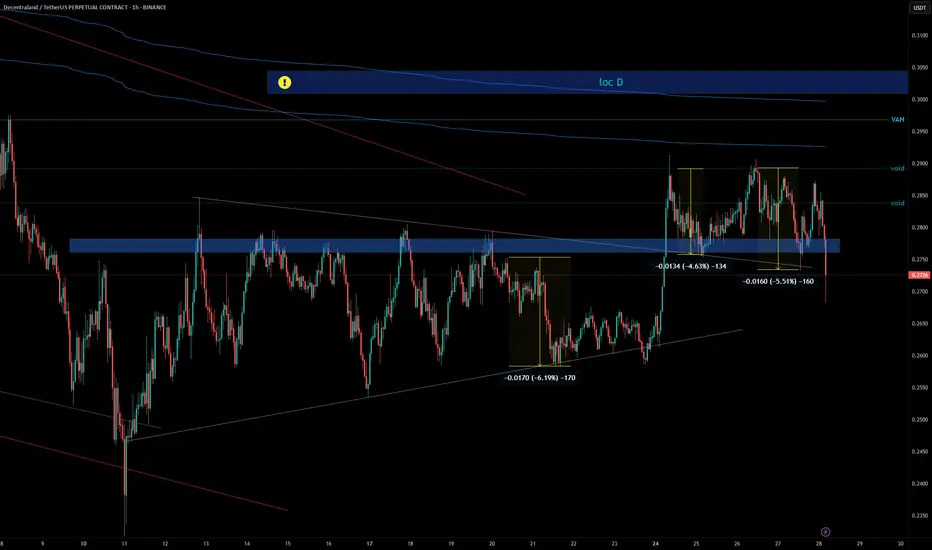
MANA - PERFECT SIGNAL. OMG! That level was magical.1- I gave a blue box on 16th March and i wrote :
" There are some bullish divergences in Volume in 2h+.
Even daily Volume is really bullish.
We may have missed a Long opportunity. But a Short at those marked Levels are reasonable! "
We were waiting for that level .
That Level gave us really nice 7 Shorts.
2- Original Signal was here 16th March:https://tradingview.sweetlogin.com/chart/MANAUSDT.P/adttA7xG-MANA-it-looks-bullish-regarding-Volume/
3- Days Later these nice 4 Shorts happened:https://tradingview.sweetlogin.com/chart/MANAUSDT.P/7BnxvY62-MANA-Beautiful-Signal-4-Trades/
4- On 20th March i gave 2 new Levels (void lines).
OMG ! To The Fcking Point. Sniped
Look how that upper grey trend line played out too.
6 % 👌 🎯
4.6 % 👌 🎯
5.5 % 👌 🎯
Follow for more ideas/Signals. 💲
Look at my other ideas 😉
Just donate some of your profit to Animal rights and rescue or other charity :)✌️