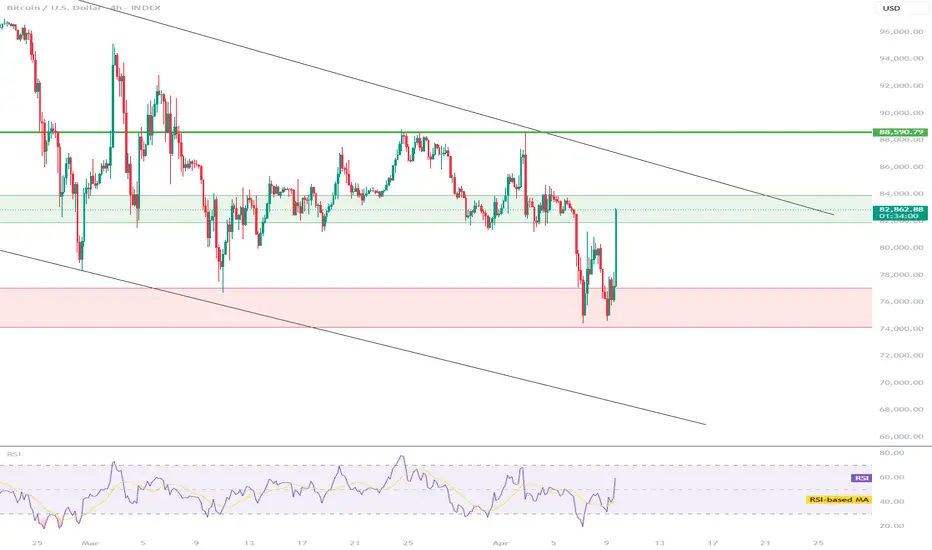
Will BTC emerge from the resistance zone on top?BTC bounced off an important support zone at $74,154 - $77,050 and we are currently seeing a very strong upward movement at the 10% level. It is also clear that the price drop created a higher low and the upward impulse gave a higher high, which is positive in the short term for continued growth.
However, you need to be careful here because the BTC price has entered a strong resistance zone from $81,900 to $83,900, only breaking out of this zone on top will open the way towards $89,000.
It is worth paying attention to the RSI indicator, which confirms the dynamic movement, but considering the 4H interval, there is still room for the price to overcome the zone on top.
Shortterm
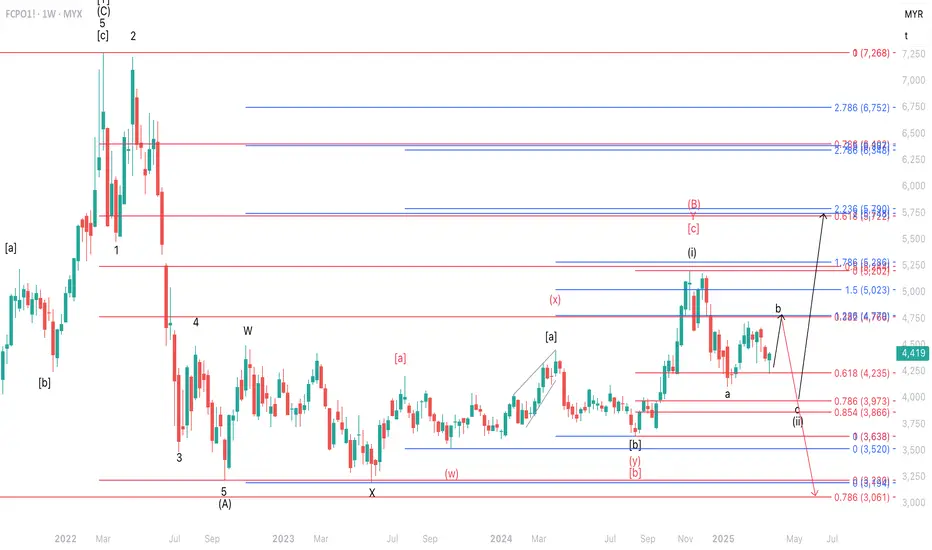
Short-Term Upside Potential in Palm OilPalm Oil (FCPO1!) is expected to strengthen in the short term as part of wave b of wave (ii), with a potential test of the 4,525–4,771. However, caution is advised for a possible reversal toward the 4,235–3,973 range to complete wave c of (ii), as indicated by the black labels.
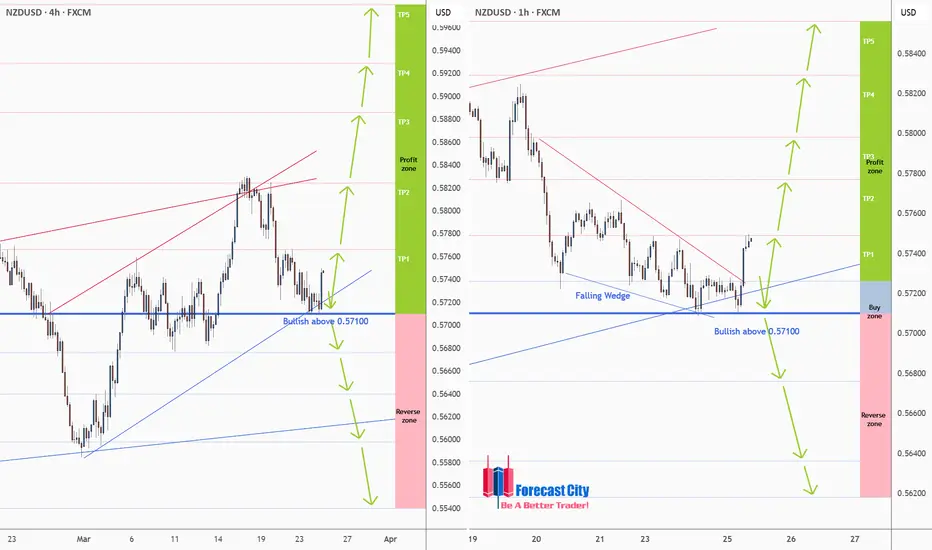
NZDUSD - H4, H1 Forecast - Technical Analysis & Trading IdeasTechnical analysis is on the chart!
No description needed!
OANDA:NZDUSD
__________________________________________________________________
❤️ If you find this helpful and want more FREE forecasts in TradingView,
. . . . . . . . Hit the 'BOOST' button 👍
. . . . . . . . . . . Drop some feedback in the comments below! (e.g., What did you find most useful? How can we improve?)
🙏 Your support is appreciated!
Now, it's your turn!
Be sure to leave a comment; let us know how you see this opportunity and forecast.
Have a successful week,
ForecastCity Support Team
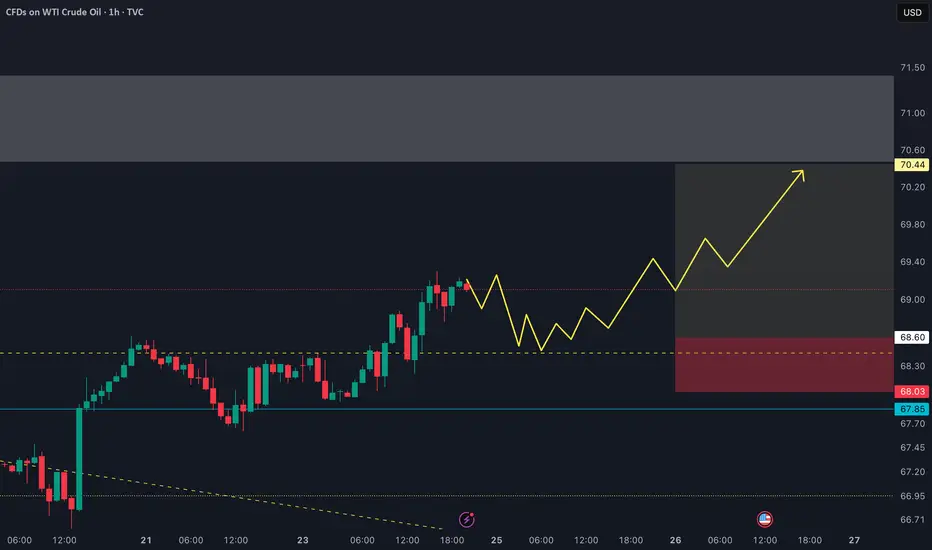
USOIL To Retest $70.5I'm watching TVC:USOIL for a strong push towards at least the $70.5 level, though this area presents significant resistance.
A confirmed break of the bearish trend could fuel strong buying momentum, but patience is key.
Ideally, I’d like to see a solid rejection off the $68.5 level as confirmation before a move higher.
If we get a decisive breakout above $70.5 with sustained bullish momentum, my next target would be the major resistance around $75.
GOLD(XAUUSD) -Weekly Forecast,Technical Analysis & Trading Ideas💡 OANDA:XAUUSD Daily Timeframe:
As forecasted by 4CastMachine AI last week, gold started its decline when it hit the red channel line.
This decline will continue, but the support area of 2955 could trigger a rebound.
At the support area of 2955, the up trend line will also prevent further declines.
If this area is broken, the price will decline to the support area of 2789.95.
This area, which was previously a major resistance, will become a major support, creating a good buying opportunity.
So, given the long-term uptrend, we can use this area as a long-term BUY ZONE.
💡 TVC:GOLD H4 Timeframe:
The price is in a Corrective wave.
Given the break of the ascending trend line in the RSI, the corrective wave is expected to continue to a depth of 2955.
💡 H1 Timeframe:
A Head and Shoulder Reversal Pattern has formed and the neckline has also been broken. Price is touching the neckline again. It is very likely that the downward wave will start from this area.
3027.83 support is broken now. It will act as a Resistance now!
Forecast:
Correction wave toward the Sell Zone
Another Downward Impulse wave toward Lower TPs
__________________________________________________________________
❤️ If you find this helpful and want more FREE forecasts in TradingView,
. . . . . . . . Hit the 'BOOST' button 👍
. . . . . . . . . . . Drop some feedback in the comments below! (e.g., What did you find most useful? How can we improve?)
🙏 Your support is appreciated!
Now, it's your turn!
Be sure to leave a comment; let us know how you see this opportunity and forecast.
Have a successful week,
ForecastCity Support Team

MSTR - MicroStrategy : Long Strategy
This stock Microstrategy Inc is showing some good recovery price action here on the 1Hr chart. It is a triple bottom and this is strong market structure, typical of a reversal sequence
The neckline is about 314 which will soon be taken. The chart has a very popular indicator FBB, Fibonacci Bollinger Bands. The middle line is derived from volume moving averages.
It is also bullish on the daily and weekly.
Fundamentals are good, I did hear they burnt through stacks of cash but this was for inventories. Future is bright for this techy and its these companies, Nvidia, Apple, Google etc that lead the markets bullish out of corrections.

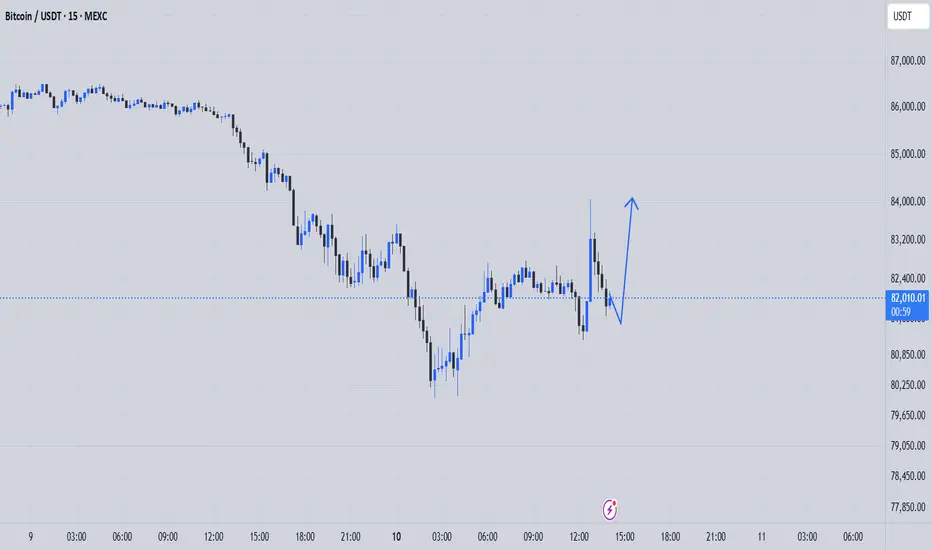
btc buy shortterm"🌟 Welcome to Golden Candle! 🌟
We're a team of 📈 passionate traders 📉 who love sharing our 🔍 technical analysis insights 🔎 with the TradingView community. 🌎
Our goal is to provide 💡 valuable perspectives 💡 on market trends and patterns, but 🚫 please note that our analyses are not intended as buy or sell recommendations. 🚫
Instead, they reflect our own 💭 personal attitudes and thoughts. 💭
Follow along and 📚 learn 📚 from our analyses! 📊💡"
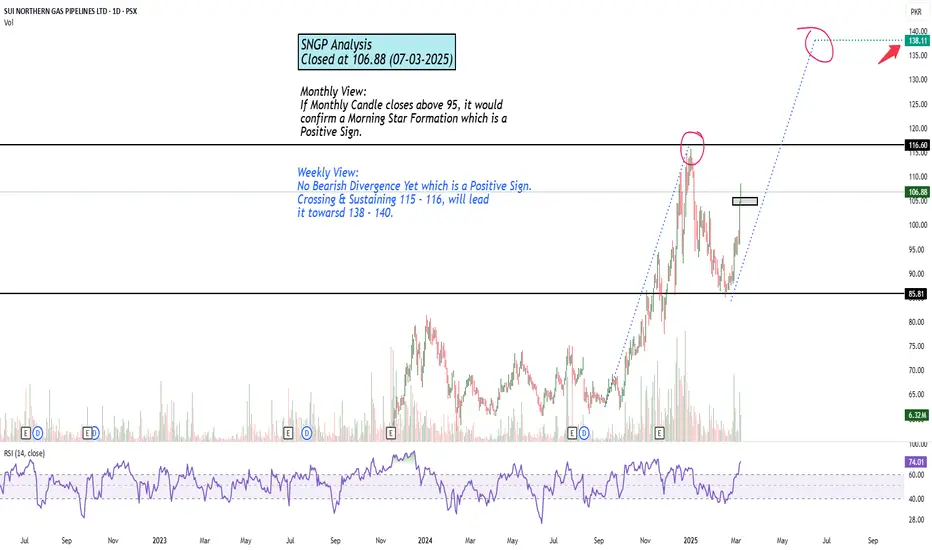
Monthly + Weekly View
If Monthly Candle closes above 95, it would
confirm a Morning Star Formation which is a
Positive Sign.
SWING IDEA - SAILSAIL Stock Technical Analysis
Steel Authority of India Limited ( NSE:SAIL ) has been consolidating around the 95 resistance level for over a year. After multiple attempts, the stock finally broke out above this level in January 2024, turning it into a strong support zone.
Following the breakout, SAIL surged to a peak of 175, marking an 85% gain. However, the stock then saw a sharp retracement, correcting by nearly 47% and revisiting the rising trendline support around the 100-105 range. This level, which previously acted as resistance, has now become a critical demand zone.
Currently, SAIL is showing signs of renewed bullish momentum, bouncing off its trendline support and forming a potential reversal. The weekly MACD crossover, observed in the chart, further reinforces a trend reversal signal. Additionally, a short-term upside target of 12% is indicated, while a long-term potential target of 76% upside is visible in the chart, aligning with the previous swing high.
The chart also highlights three take-profit targets:
Target 1: The first profit-taking zone, offering an initial opportunity to secure gains.
Target 2: A mid-level profit-taking zone, aligning with previous consolidation areas.
Target 3: The final take-profit level around 175, marking the prior high and a potential full exit point for long-term investors.
KEY OBSERVATIONS:
One-year resistance of 95 was decisively broken in January 2024
Stock surged 85% to a high of 175 before correcting 47%
100-105 level now acts as a strong rising trendline support
Weekly MACD crossover signals a bullish momentum shift
Three take-profit targets identified, with the final target at 175
Potential upside target of 76% from support levels, aligning with previous highs
RECOMMENDATION:
Based on this technical analysis, holding SAIL for the long term could be a strong strategy. The potential returns include:
12% upside in the short term
76% upside from current levels, targeting previous highs around 175
This analysis presents a compelling buying opportunity in SAIL, fueled by its breakout, support validation, and momentum reversal.
IMPORTANT NOTE:
Investors should be aware that there is a chance the stock may retest the 100-105 support level before resuming its upward trajectory. This potential pullback should be carefully monitored, and investment strategies should be adjusted accordingly.
DISCLAIMER: This analysis is for educational and informational purposes only and should not be considered as financial advice. Technical indicators and historical data are not guarantees of future performance. Investors should conduct thorough research, assess risk tolerance, and consult a financial advisor before making any investment decisions.

Buy on DipsShort to Medium Term ULTIMATE TARGETS CAN BE 25 - 26
& Then 40 -45
Best Buying Price would be around 11 - 12 (if it comes).

GOLD Daily, H4, H1 Forecasts, Technical Analysis & Trading IdeasDaily Timeframe:
TVC:GOLD has been rising rapidly recently but has almost stopped since February 11, when it hit its uptrend channel line.
With the RSI hitting resistance at 77 and showing signs of falling, there is a high probability that a corrective wave is about to begin.
Four-hour Timeframe:
A rising wedge pattern has formed in the price.
As long as the price does not break the resistance at 2955 and the red line of the rising wedge continues upwards, a downward wave is expected to begin.
A strong bearish divergence has also formed in the RSI.
One-hour Timeframe:
A head and shoulders pattern is forming.
If the price can break the neckline downward and the blue trend line of the rising wedge is also broken, the probability of a downward wave will be very high.

USDJPY Signal - 5 months support test 24.2.25148.60 to 152.70 range
Currently trading at 149.70
Support of 148.60-149.80 range is holding strong for the past 5 months.
Standard correction 300 pips up towards 152.70 makes sense following the expanding wedge pattern highlighted on the chart.
100 pip downside compared to 300 pip upside swing trade.
Make logical, timed, calculated action sticking to a plan and managing risk as top priorities.
GOOD LUCK!

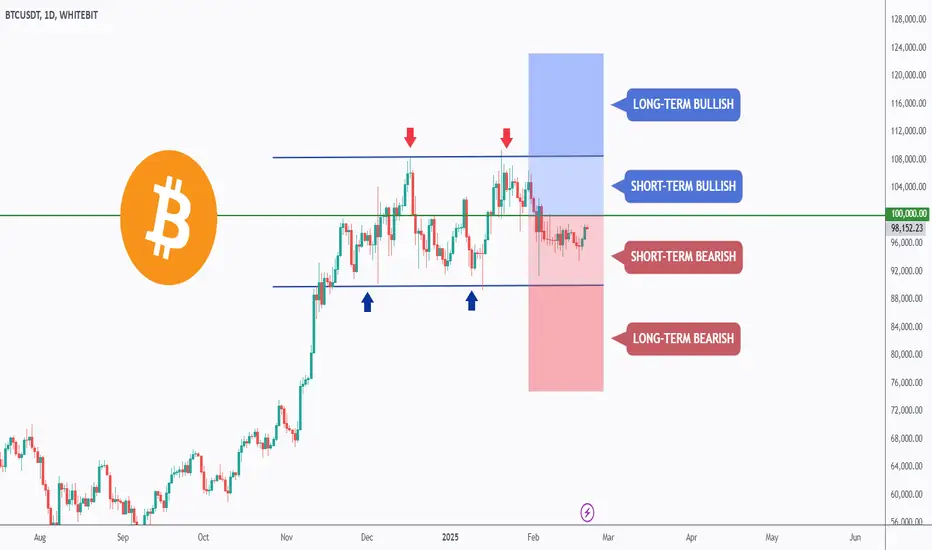
BTC - Are You Ready?Hello TradingView Family / Fellow Traders. This is Richard, also known as theSignalyst.
BTC has been stagnant for a while, trading within a short-term bearish range!
But the wait is almost over, as BTC is now approaching the $100,000 mark, which represents the upper boundary of the bearish zone.
📈 Short-Term Bullish:
If BTC breaks above the $100,000 level, it is expected to enter a short-term bullish phase, potentially retesting its previous all-time high of $109,000.
However, as long as BTC remains below $100,000, the overall bias will stay bearish.
📚 Always follow your trading plan regarding entry, risk management, and trade management.
Good luck!
All Strategies Are Good; If Managed Properly!
~Rich
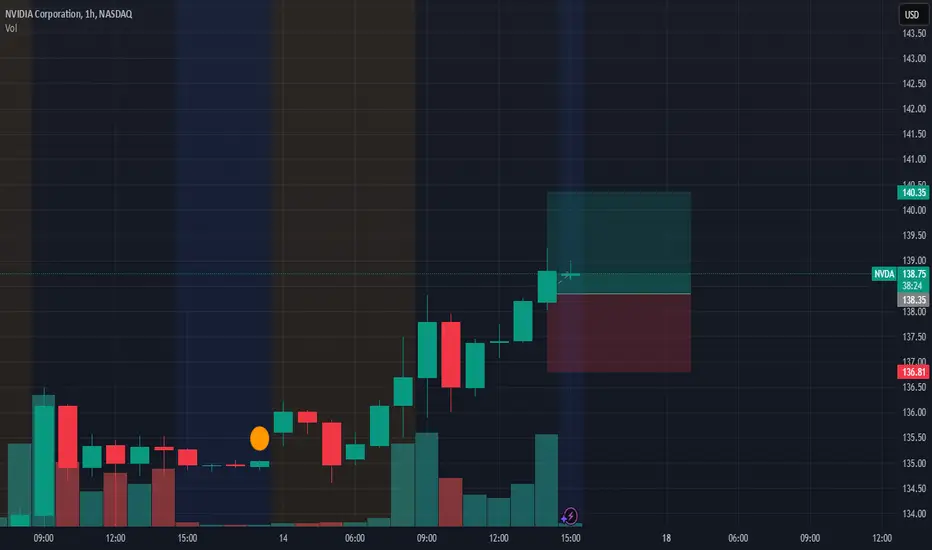
Still long $NVDAThe NASDAQ:NVDA Blackwell architecture is a game-changer, powering next-gen AI chips that giants like NASDAQ:MSFT and NASDAQ:META are scrambling to acquire. The upcoming RTX 50 series (including the RTX 5090) will bring AI-powered capabilities to gamers and creators in 2025. While some analysts project an average price target of 17.86, we're taking more cautious short-term view with a 140 target, following the stock's recent 12% dip.
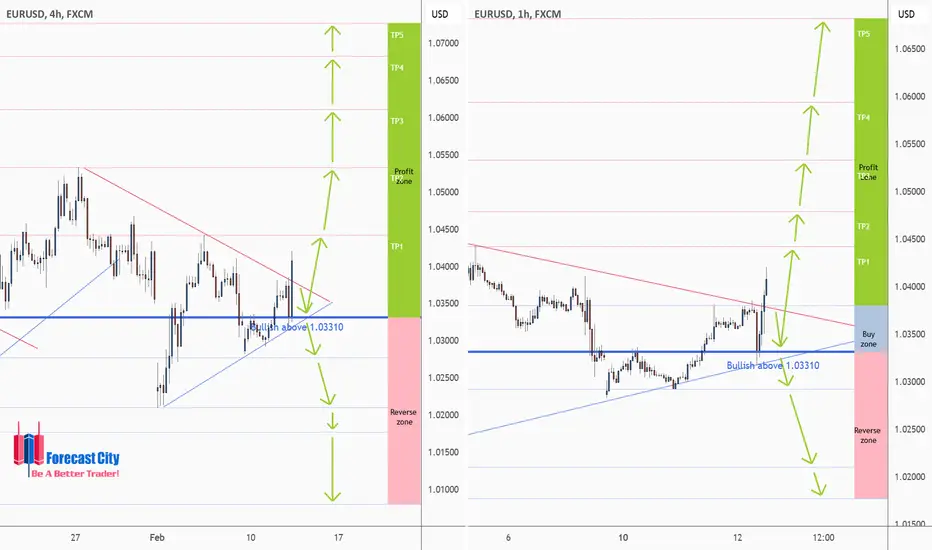
EURUSD - H4, H1 forecasts, Technical Analysis & Trading IdeasIntraday forecast
The downtrend is broken, and the price is in an impulse wave.
Forecast:
1- Correction wave toward the Buy Zone
2- Another Upward Impulse wave toward Higher TPs
SL: Below 1.0331
________________________________
❤️ If you find this helpful and want more FREE forecasts in TradingView,
. . . . . Please show your support back,
. . . . . . . . Hit the 👍 BOOST button,
. . . . . . . . . . . Drop some feedback below in the comment!
🙏 Your Support is appreciated!
Let us know how you see this opportunity and forecast.
Have a successful week,
ForecastCity Support Team
NZDCHF - Trend-Following TA signals short!NZDCHF overall bearish, looking for trend-following shorts on lower timeframes.
📚 Always follow your trading plan regarding entry, risk management, and trade management.
Good luck!
All Strategies Are Good; If Managed Properly!
~Rich
Disclosure: I am part of Trade Nation's Influencer program and receive a monthly fee for using their TradingView charts in my analysis.

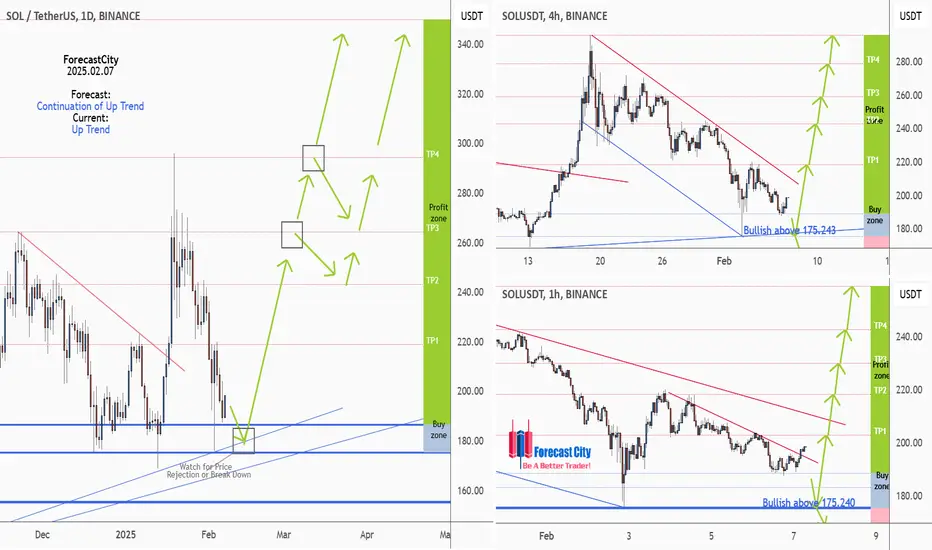
SOLUSD - Weekly forecast, Technical Analysis & Trading IdeasMidterm forecast:
155.100 is a major support, while this level is not broken, the Midterm wave will be uptrend.
Technical analysis:
A peak is formed in daily chart at 295.850 on 01/19/2025, so more losses to support(s) 186.409, 175.250 and minimum to Major Support (155.100) is expected.
Take Profits:
218.928
243.197
264.400
294.450
350.000
__________________________________________
❤️ If you find this helpful and want more FREE forecasts in TradingView,
. . . . . Please show your support back,
. . . . . . . . Hit the 👍 BOOST button,
. . . . . . . . . . . Drop some feedback below in the comment!
🙏 Your Support is appreciated!
Let us know how you see this opportunity and forecast.
Have a successful week,
ForecastCity Support Team
USDCHF - Weekly forecast, Technical Analysis & Trading IdeasMidterm forecast:
0.89147 is a major support, while this level is not broken, the Midterm wave will be uptrend.
We will close our open trades, if the Midterm level 0.89147 is broken.
Technical analysis:
A trough is formed in daily chart at 0.89645 on 01/27/2025, so more gains to resistance(s) 0.91497, 0.92218, 0.94400 and more heights is expected.
Take Profits:
0.85510
0.86286
0.87474
0.88195
0.89147
0.90367
0.91497
0.92218
0.94400
0.96000
0.99200
1.01453
__________________________________________
❤️ If you find this helpful and want more FREE forecasts in TradingView,
. . . . . Please show your support back,
. . . . . . . . Hit the 👍 BOOST button,
. . . . . . . . . . . Drop some feedback below in the comment!
🙏 Your Support is appreciated!
Let us know how you see this opportunity and forecast.
Have a successful week,
ForecastCity Support Team

GBPJPY - Weekly forecast, Technical Analysis & Trading IdeasMidterm forecast:
While the price is below the resistance 199.790, resumption of downtrend is expected.
We make sure when the support at 182.782 breaks.
If the resistance at 199.790 is broken, the short-term forecast -resumption of downtrend- will be invalid.
Technical analysis:
The descending flag taking shape suggests we will soon see another leg lower.
A peak is formed in daily chart at 198.945 on 12/30/2024, so more losses to support(s) 191.884, 189.477, 186.231 and minimum to Major Support (182.782) is expected.
Take Profits:
196.006
193.510
191.884
189.477
186.231
182.782
178.409
Total Profit: 3204 pip
Closed trade(s): 1584 pip Profit
Open trade(s): 1620 pip Profit
Trade Setup:
We opened 8 SELL trades @ 196.68 based on 'Peak' entry method at 2024-12-30, signaled by DTO.
Closed Profit:
TP1 @ 196.006 touched at 2024-12-31 with 67 pip Profit.
TP2 @ 193.510 touched at 2025-01-09 with 317 pip Profit.
TP3 @ 191.884 touched at 2025-01-13 with 480 pip Profit.
TP4 @ 189.477 touched at 2025-01-17 with 720 pip Profit.
67 + 317 + 480 + 720 = 1584 pip
Open Profit:
Profit for one SELL trade is 196.68(open price) - 192.632(current price) = 405 pip
4 trade(s) still open, therefore total profit for open trade(s) is 405 x 4 = 1620 pip
__________________________________________________________________
❤️ If you find this helpful and want more FREE forecasts in TradingView,
. . . . . Please show your support back,
. . . . . . . . Hit the 👍 BOOST button,
. . . . . . . . . . . Drop some feedback below in the comment!
🙏 Your Support is appreciated!
Let us know how you see this opportunity and forecast.
Have a successful week,
ForecastCity Support Team

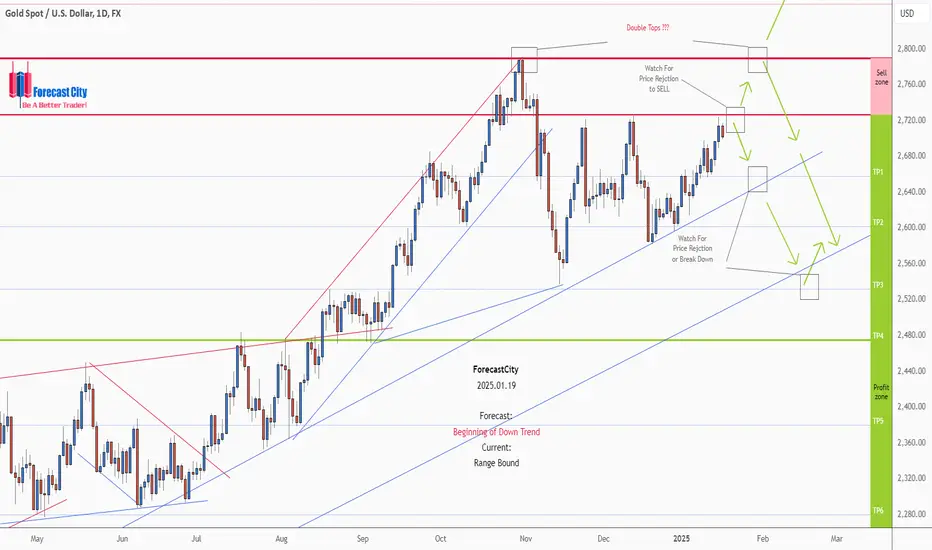
GOLD - Weekly Forecast - Technical Analysis & Trading Ideas!Midterm forecast:
While the price is below the resistance 2789.95, beginning of downtrend is expected.
We make sure when the support at 2475.27 breaks.
If the resistance at 2789.95 is broken, the short-term forecast -beginning of downtrend- will be invalid.
Technical analysis:
A trough is formed in daily chart at 2582.95 on 12/19/2024, so more gains to resistance(s) 2726.10 and maximum to Major Resistance (2789.95) is expected.
Take Profits:
2657.88
2601.87
2532.10
2475.27
2380.00
2279.87
2219.63
2145.04
2087.89
__________________________________________________________________
❤️ If you find this helpful and want more FREE forecasts in TradingView,
. . . . . Please show your support back,
. . . . . . . . Hit the 👍 BOOST button,
. . . . . . . . . . . Drop some feedback below in the comment!
🙏 Your Support is appreciated!
Let us know how you see this opportunity and forecast.
Have a successful week,
ForecastCity Support Team
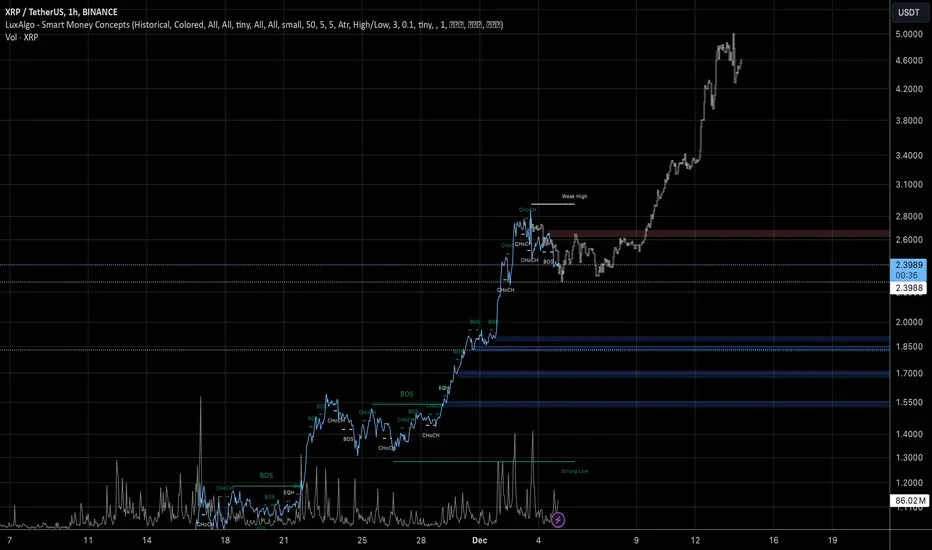
XRP — SHORT TERM (EXPERIMENTAL)Ripple CRYPTOCAP:XRP is a peer-to-peer powered cryptocurrency designed to work seamlessly with the Internet to allow a fast, direct and secure way to send payments on the web.
Ripple is the leading provider of digital asset infrastructure for financial services. Send cross-border payments in real-time, engage with tokenization and digital assets, and meet regulatory compliance requirements—all in one place.
EXPERIMENTAL. NFA. DYOR.
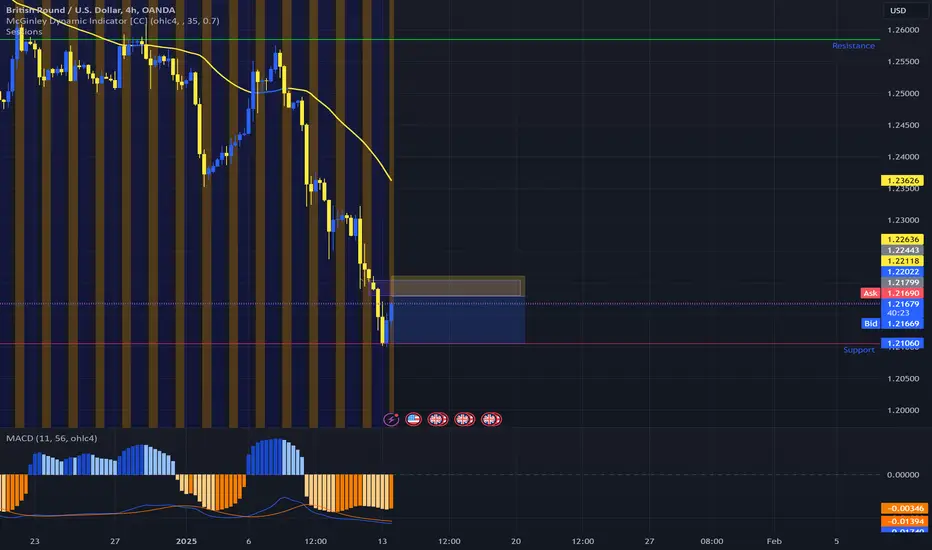
GBPUSD - SHORTAs always technical analysis of DXY shows we are about to complete a pullback on the 1h time frame. I also expect this pair to be completing a pullback around the same time. We will look for reaction in the purple area before entering a short position.
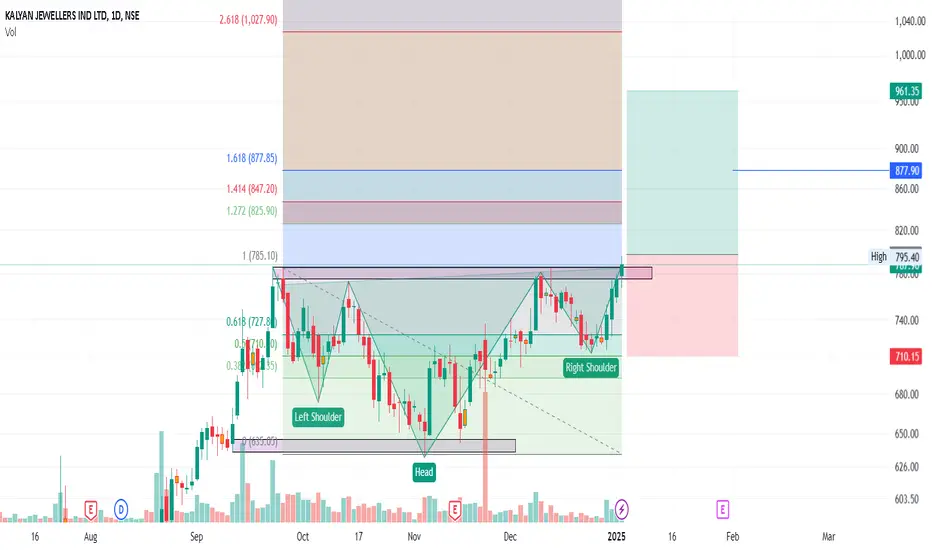
Kalyan Jewellers H&S BOThe stock is exhibiting a potential Head and Shoulders (H&S) breakout after a significant rally from 130 to 800.
However, there is a risk of a false breakout for distribution purposes, so it's important to proceed with caution.
small supply can be seen at 880 levels.
A strong breakout would be more reliable if supported by good trading volumes.
Additionally, a stop loss (SL) can be set at the low of the shoulder, with a strong daily candle close below 710 indicating a possible reversal.
Always remember to do your own research before making any investment decisions.