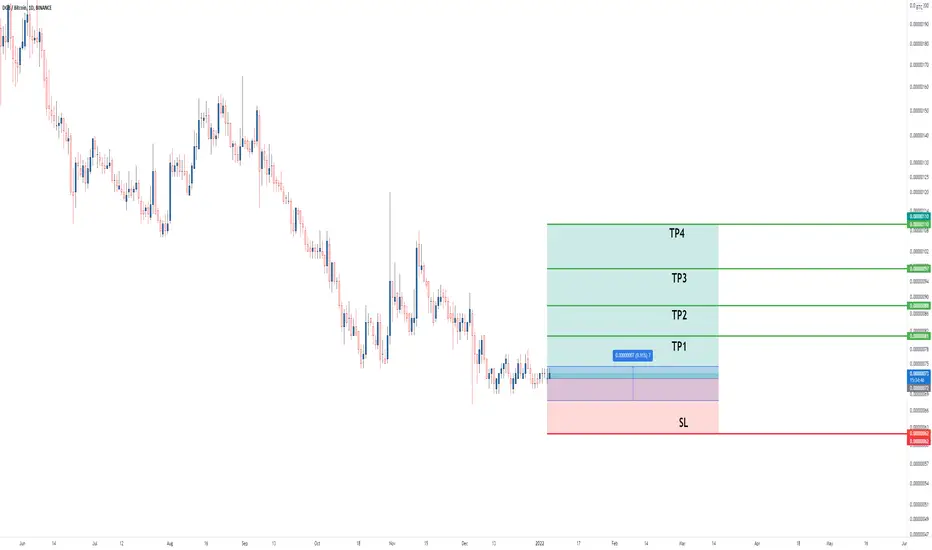
DGB/BTCHello traders
Let's take a look at the DGB / BTC
I think we are exactly at a strong level and soon we are flying from this area
do not miss that shot.
Enter: 68-75
TP1:81
TP2:88
TP3:97
TP4:110
SL:62
Shortterm
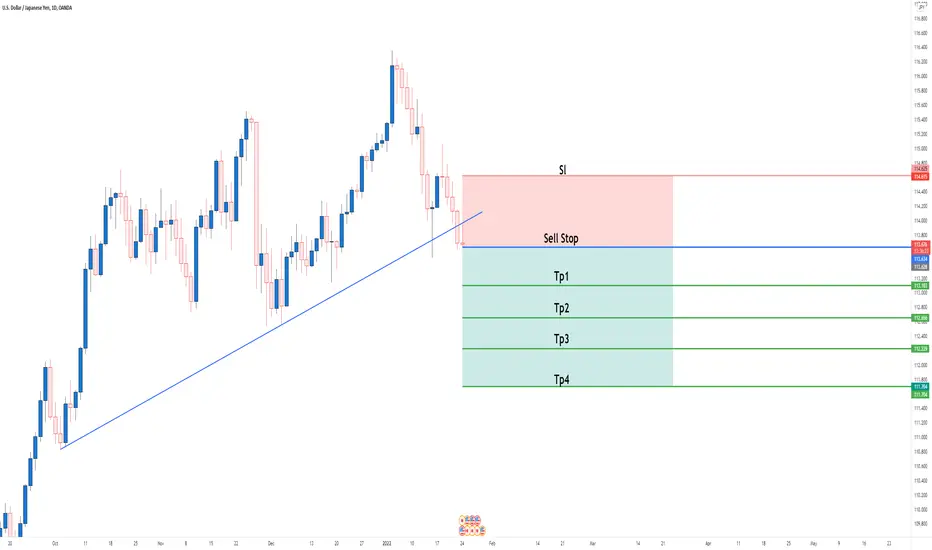
USD/JPYHello Traders
USD/JPY has lost the support of Trendline and has provided us with a good opportunity to open a sell position,
I hope you use it and it will be profitable for you.
Why Laxmi Organics is a strong Short to Medium term BUY NSE:LXCHEM
TEN POINTS
1. Laxmi Organic Industries is a specialty chemical manufacturer, focused on two key business segments - Acetyl Intermediates (AI) and Specialty Intermediates (SI)..The company is currently among the largest manufacturers of ethyl acetate in India with a market share of approximately 30% of the Indian ethyl acetate market. Laxmi Organic exports about 25% of the manufactured products.
Additionally, it is the only manufacturer of diketene derivatives in India with a market share of approximately 55% of the Indian diketene derivatives market in terms of revenue in FY21 and one of the largest portfolios of diketene products
2. Stock gained 50% in one month only after listing -hitting a high of 628 and reported a significant jump in its net profit to ₹98.68 crore in the quarter ending June as compared to ₹18 crore in the corresponding quarter of the previous fiscal. Its revenue from operations also witnessed a massive jump to ₹689 crore from 354 crore in the year-ago quarter.
3. However massive rainfall in Pune factory forced the company to close one of its factories for some time during the SEP 21 quarter and Net profit tumbled from ~98 cr in SEP 21 to 10.3 cr in SEP 21 qtr.
4. Coupled with profit booking the stock tumbled to 385 levels.
5. After a 3 month consolidation the company seems to be turning around its limitations shown in the previous quarter.
6. On the positive side- India Ratings and Research (Ind-Ra) has upgraded Laxmi Organic Industries Limited’s (LOIL) Long-Term Issuer Rating to ‘IND AA-’ from
‘IND A+’. The Outlook is Stable, the ratings agency quoted
7. Despite 60% decline in SI volumes on qoq basis on account of 45 days shut down at SI Unit (Mahad) which caused heavy loss, Laxmi’s H1FY22 profits were close to FY21 performance led by rapid growth in specialty business and higher spreads in acetyl business during the first quarter and normalised acetyl spreads during the second quarter. There is a strong visibility on SI order book for H2FY22. Laxmi has acquired significant international accounts during Q2FY22, as 24% of SI sales were from exports as against 5% in Q2FY21.
8. Buying at current levels is recommended for a short to medium term target of 500-520 for the short term and 620 for the longer term.
9. Maintain stop loss around 430
10. Risk reward ratio of 1:3

BITCOIN 24-27K CRASH ?There is constant bearish pressure on Bitcoin, any bullish candle is weak and dips are still very severe.
EMA200 supports the price at 25K.
Bitcoin dominance is 42% and imo it needs atleast 50% to continue it's journey to 100K so crash is very likely with the things that are happening in economy / world right now.
However BTC price is now between ema50 & ema200 and by the past price action it's the best time to accumulate more BTC !
Bitcoin cycles are not what they used to be before 2018.
Now they last longer and are long lasting accumulations before the next parabolic move is on the way.
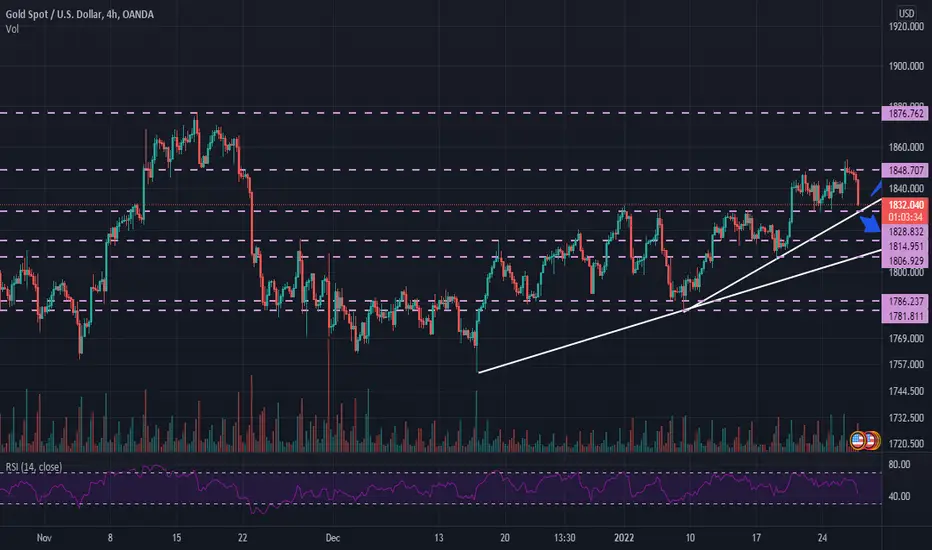
XAU/USDXAU/USD hourly chart looks bullish in short term
it has a condition that i am gonna put it in my watch list
but i am gonna wait for certain confirmations before taking action
so be careful:)
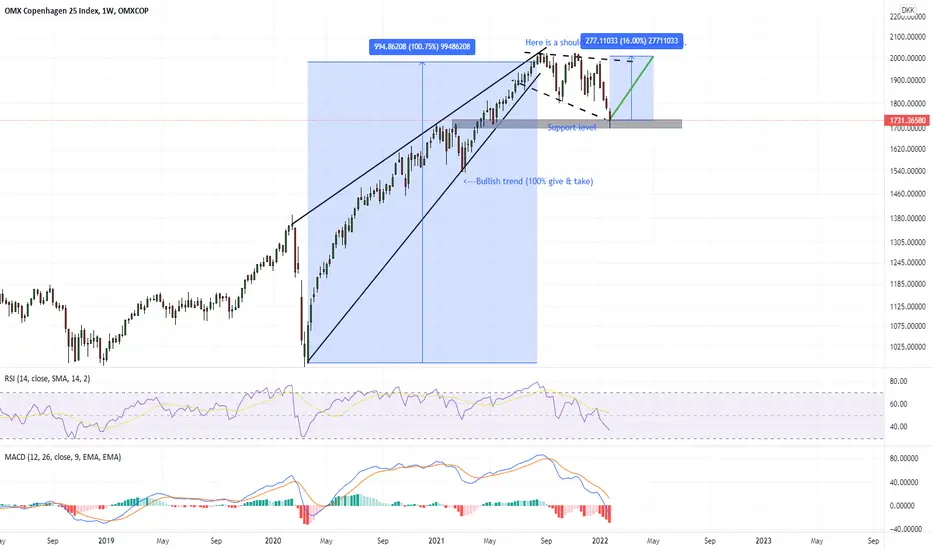
OMX C25 potential bullish trendThe OMX C25 shares had a very good bullish trend from the beginning of COVID-recession. Now the shares just finished a shoulder head shoulder bullish formation and is now testing at the support level. Now it is very possible that the shares are going to raise and reach the resistance level. Therefore we now could get a potential bullish trend where it can raise 16% over the next few months (give & take). So now is a good time to invest int this share if you are looking for a short-term investing but also a good time for a long-term.
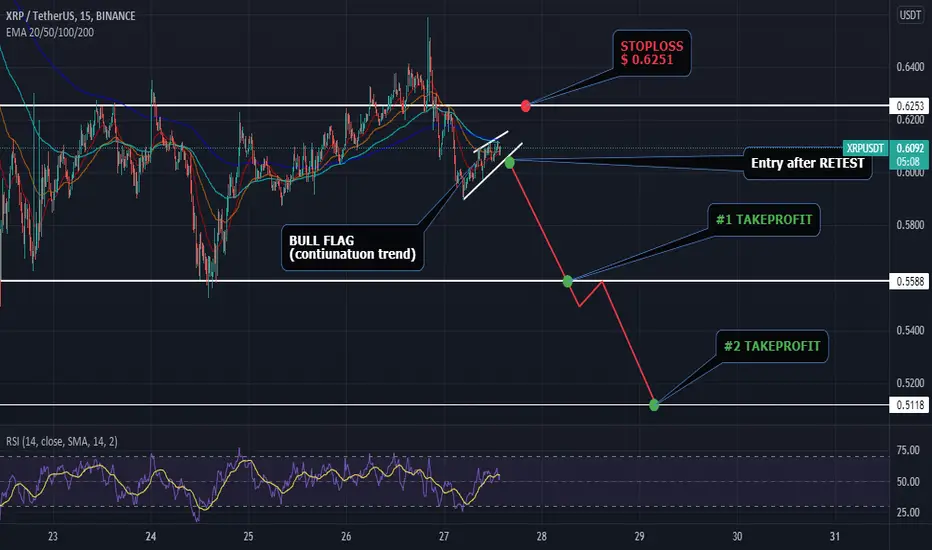
Signal for a short-term SHORT XRP. Bear FLAG !!! 🆘🆘🆘Hello,
Today a quick signal for SHORT XRP. (in line with my latest long-term analysis)
The cryptocurrency entered a downtrend on a mid-term hill after rebounding from a double bottom.
He is headed back to the shopping zone to test it again. I plan to break this line and reach the lows of July 20.
Entering after testing the bearish flag, which is a bookish move towards the continuation of the trend.
Stoploss determined on a short-term hill, because it is possible to draw an "M" with a lower top, which will also be a signal for SHORT.
Comment and like,
Greetings
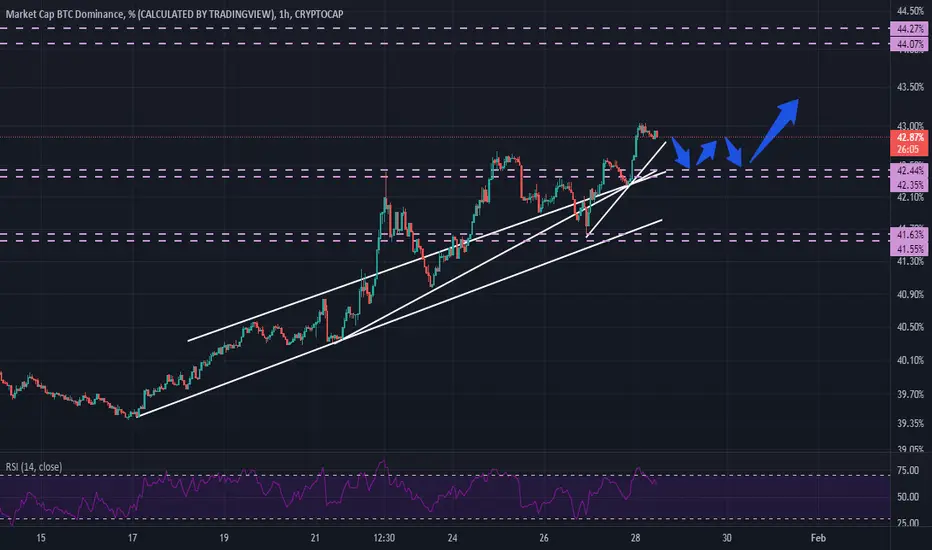
BTC DOMINANCE BTC DOMINANCE
ok i know that technical is not every thing that matters but i wanna try
btc dominance looks bullish at shortterm but until now!!!
maybe a correction could happen but not Necessarily
in order to go higher it needs to keep the 42/4 suppurt
and use it to continue the bullish trend
but if the suppurt breaks with a nice volume anything could happen
so its a great moment!!! have a good day:)
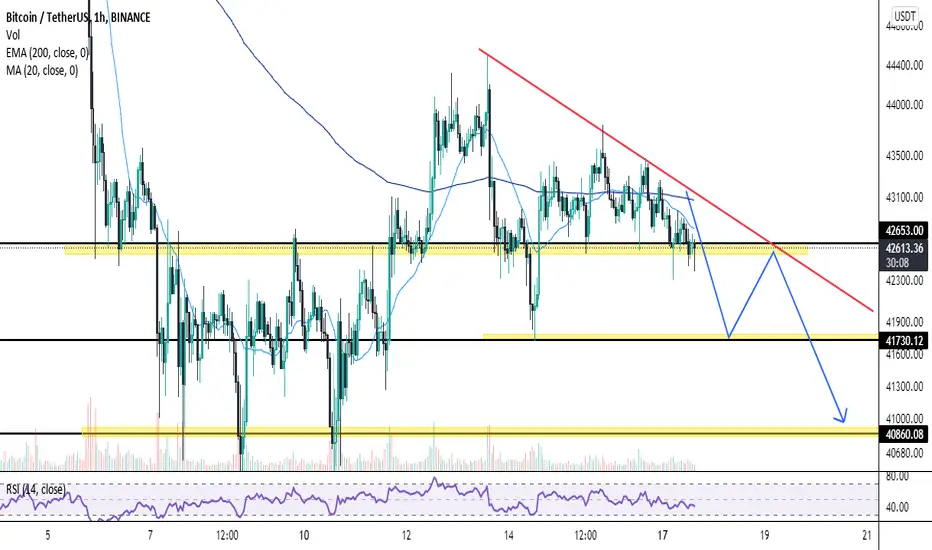
BTC/USDTBTC/USDT hourly timeframe i see some bullish signs that makes btc chart in my watchlist
but i needs more confirmations to start the bullish move
it needs a great volume to break the 39000 resistance in order to get bullish
so be carefull good luck!!!

ANY/USDTANY/USDT looks that it broke the bearish trendline on short term
but it still needs a high volume for confirmation
so breaking the bearish trend line is just a sign to place it in the watch list zone
take care:)

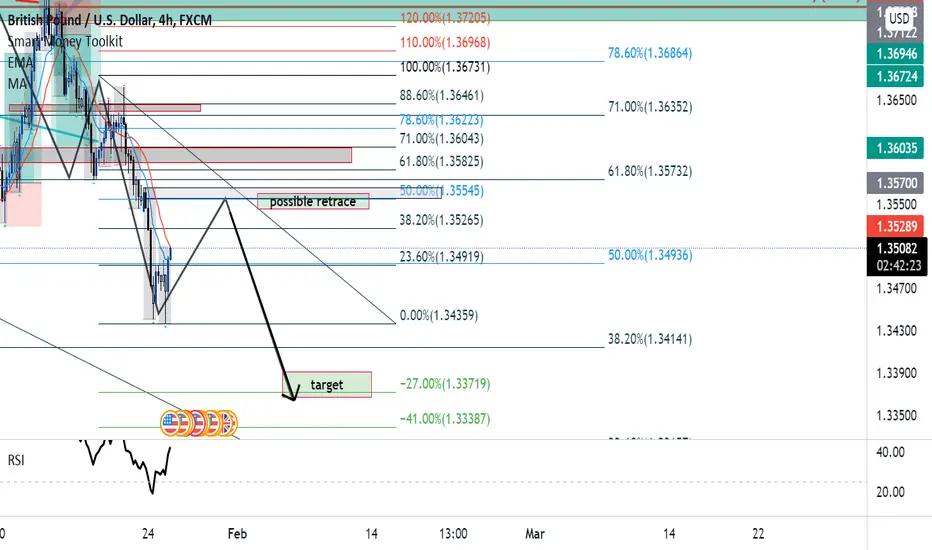
Analysis GBPUSD (Overall down Side)Hello Traders, GU looks like a very much a down trend for the past week. Therefor, trading it to the down side would be your best bet in your favor. As you can see the the candles are retracing to mitigate anything to bring back in profit to continue to a sell/short. Possibly would hit to the 38% to the 50% retracement to reach to the target area. According to the RSI, there is a divergence which it let me know that it is retracing. It also shows the engulfing candle to the retracement area around the Quarter point and making LH and LL's.
Beware: news is coming out for all the USD pairs. It is a red flag. starts 1/26/2022 2:00pm EST time.
Thank you for reading!
ABBOTINDIA - HEAD AND SHOULDERS - FALL EXPECTED !!ABBOTINDIA and recently made a head and shoulder pattern and also broke its neckline.
Expected that, it will take a pullback towards its neckline and fall again .
Trade Details:
Trade Active : Once testing resistance at 17500-18000 level
Stop Loss: 19200-300
Target: 15400
Happy Trading :)

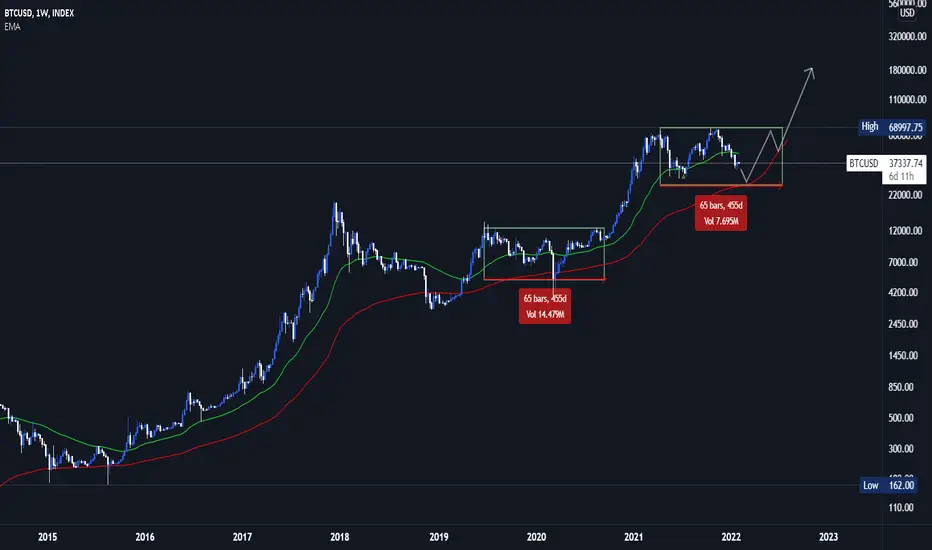
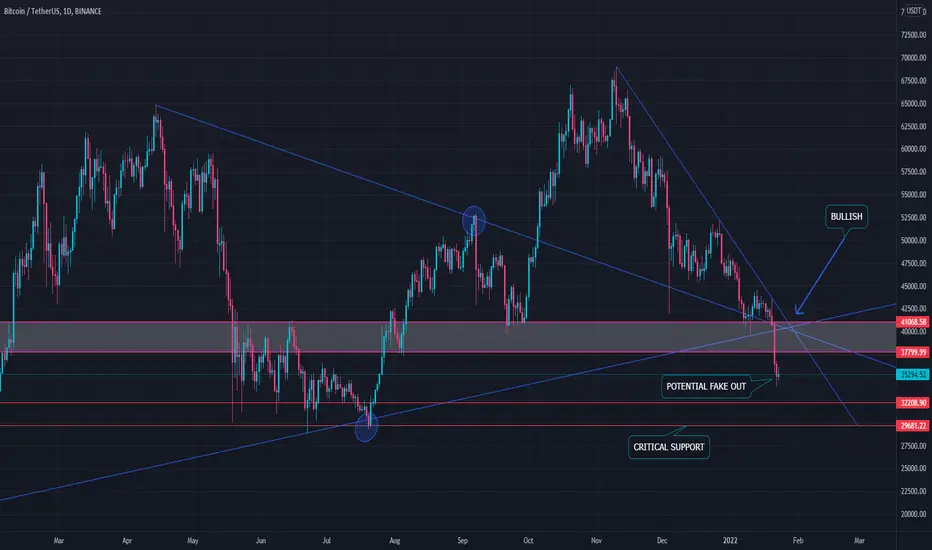
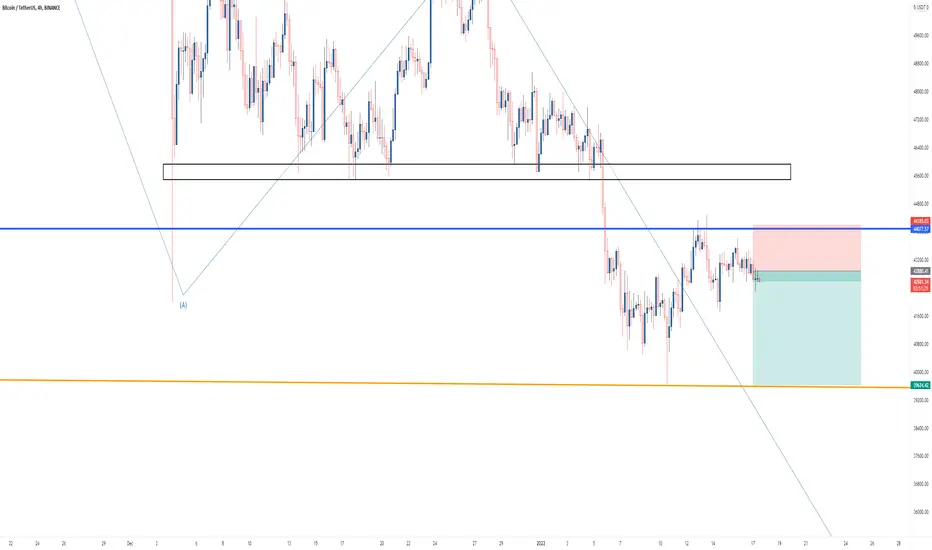
BTC/USDT POSSIBLE SCENARIOHello Tradingview community and members. I Am sharing my idea/opinion if you enjoy the analysis make sure to give a like and let me know your thoughts.
BTC has been consolidating for the last 10 weeks, bearish trends start to show up more and more. We could not hold the 41k-38k price range, we broke down and are now heading
towards 32k, close to last resort. A fake out is an optimistic take but could potentially play out. After breaking 32k we have our crucial support at 29.7k this is our last chance at heading in an optimistic direction. If we would manage to hold 29.7k and return going to the
upside, we still have a long way to become bullish again. In my opinion we have to cross the 3 blue lines you see in the chart above (40.5k) to truly become bullish again. It's not looking great but in these condition we find the best
opportunities. I think institutional investors have been waiting for a buying opportunity like we are seeing right now. We have already seen huge buying volumes in the last couple of days, only time will tell.
my prediction: In the short term I think the price will go sideways for a while between 38k-32k, we will eventually retest 29.7k for the third time. After retesting we will see a price surge towards the 40k zone, retest 35k and go up from there. Keep in mind this is just one of the scenarios that could play out.
What makes us stand out?
- Day Trading
- Accumulation Trading
- Bonus Package (nft's, low cap altcoins, ...)
- Roadmap
- Long and Short Term
Disclaimer: This is not financial advice, we are sharing our vision and thoughts.
Apple will show us the wayEarnings coming out this week for Apple and i anticipate to see whether my prediction holds true. Indices have been manipulated to go up with FAANGT' and now we see that the first one to go down was Netflix. All the rest are reporting earnings this week and the next so i would expect indices to get their well deserved correction with the help of the big guys. Then it's time for the shorts to get burned again... stay tuned.

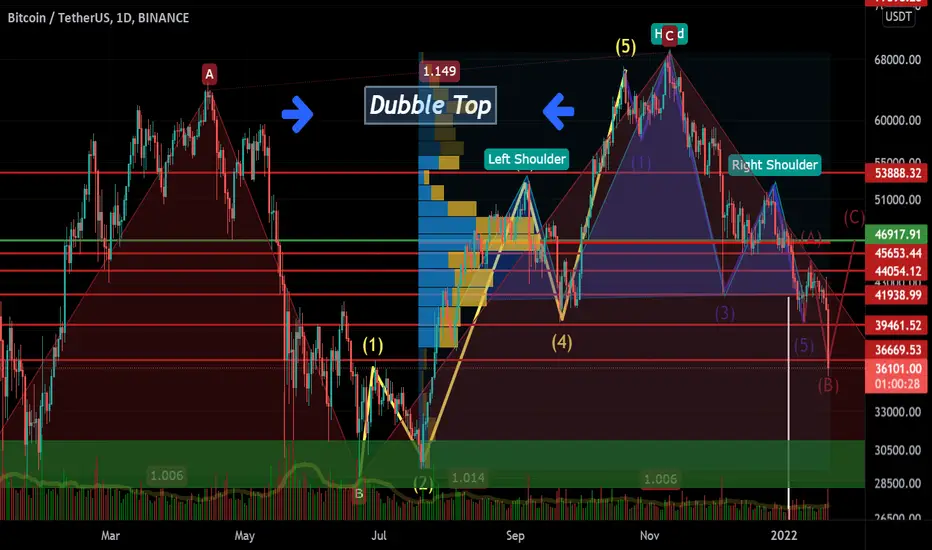
Posibble Double Top on BTCDuble Top and Head and Shoulder.Short Time gays!
30 K next buy in my opinion
BTC/USDT#Bitcoin has not yet been able to move strongly upwards The $ 40,000 area support will be very fragile if we hit it again Be aware of your open trades and follow the money management.
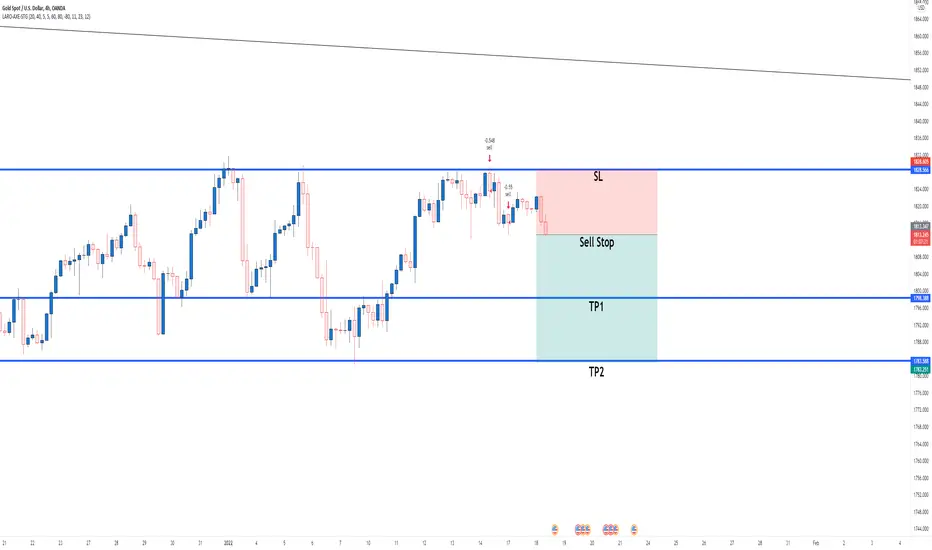
XAU/USDHello Traders
XAU/USD is not going well these days for bulls.
Our suggested position for this area is shared with you.
I hope it is profitable for you.
Lodha can give more than 15% return by the end of January 2022NSE:LODHA
This stock can give more 15% return by the end of JANUARY 2022. Currently trading at 1290, can go to 1500 by the end of the month which is likely to be more than 15%.

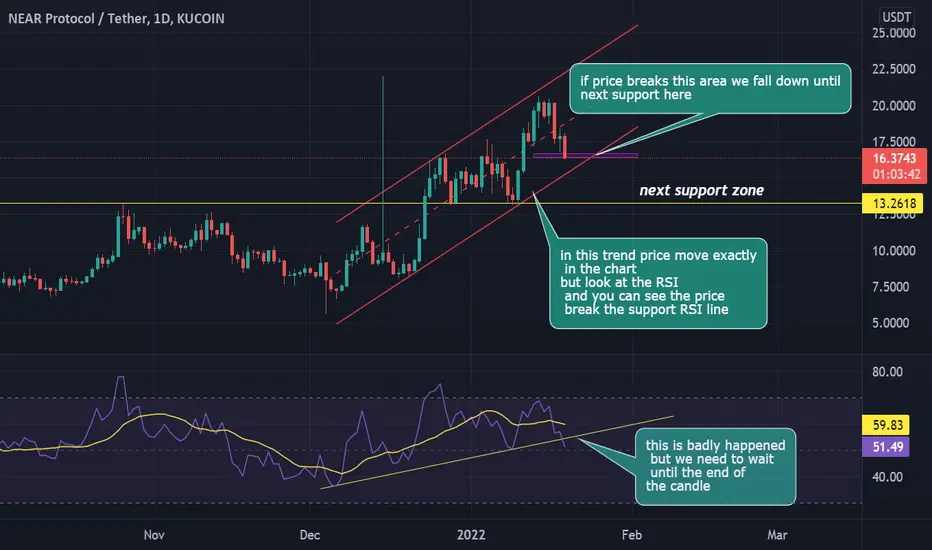
NEAR in the bad troubleBINANCE:NEARUSDT
Keep eyes on it 👀🕵️👁️
Don't forget Financial management and step
by step purchasing 💹💰💵💲
Please fallow me 🙏🥺
Please leave comments 🗨️💬
Like and share with your friends 👍💑
I hope you enjoy ☺️🌈🎉🎊🎁
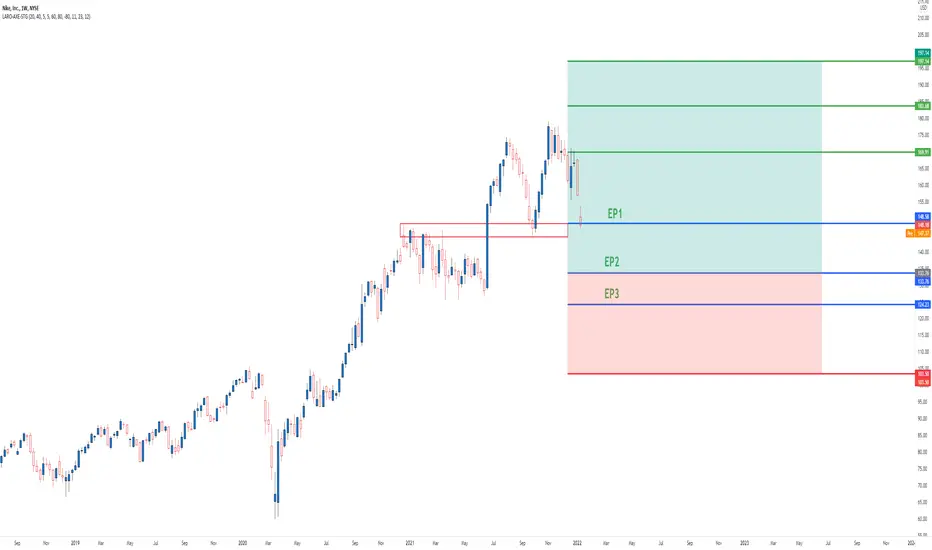
Nike/USDHello Everyone
today we are going to a briefly review on #Nike
And some good points for buy and hold.
Best wishes to you.
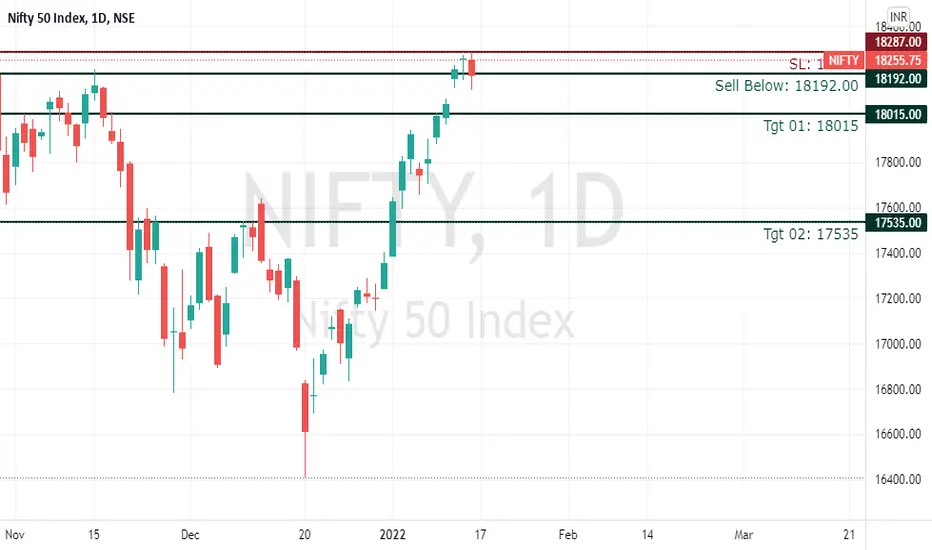
NIFTY ::: BEARISH :::DATE: 16 JAN 2022
INSTRUMENT: NIFTY
TREND: SELL
TYPE: POSITIONAL.
TIME FRAME: DAY
CMP: 18255
Sell Below: 18192
STOP LOSS: 18287
TGT 01: 18015
TGT 02: 17535
RISK DISCLOSURE:
We are not S E B I registered analysts. VIEWS EXPRESSED HERE ARE FOR OUR RECORD PURPOSES ONLY. Please consult your personal financial advisor before investing. We are not responsible for your profits/losses whatsoever.