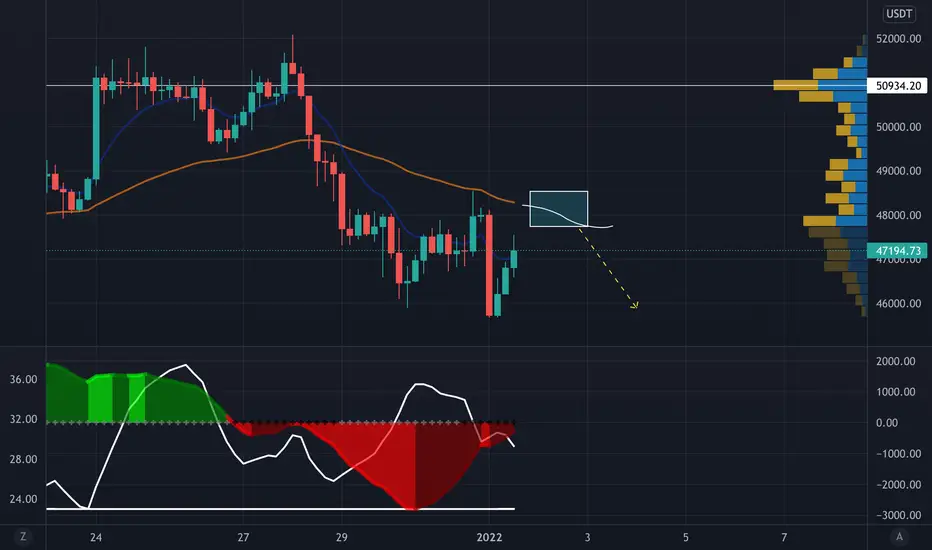
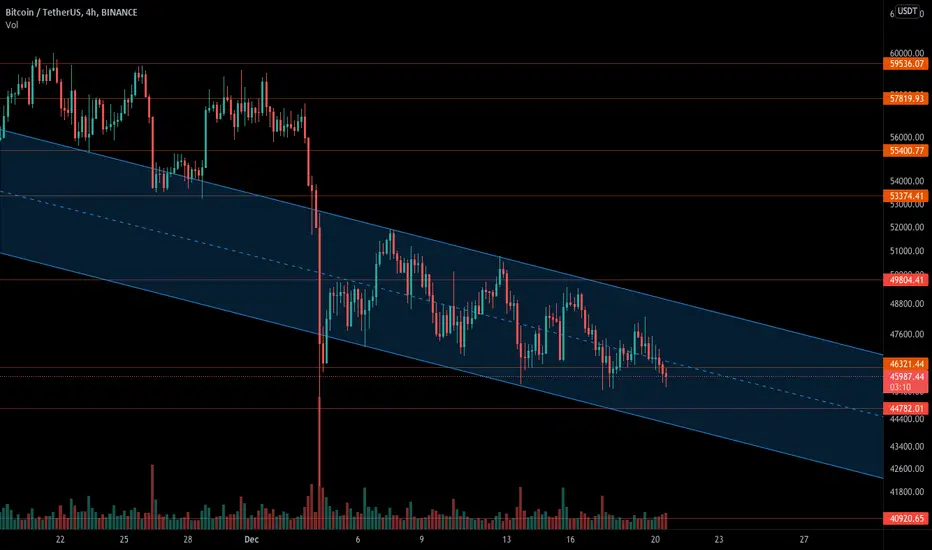
4h short term Bitcoin drop. I hate starting 2022 shorting Bitcoin.
That being said, I'm expecting a quick rejection at the 55EMA. Currently sitting at 48.000.
I'm not always a bear. Check my previous 4hr Bitcoin projection. Here's the link:
Happy 2022!
Rio.
Shortterm
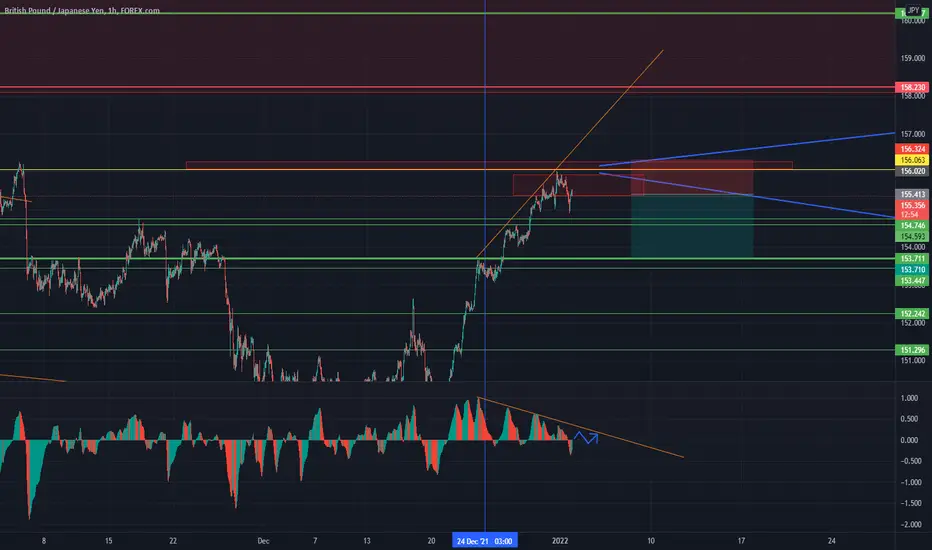
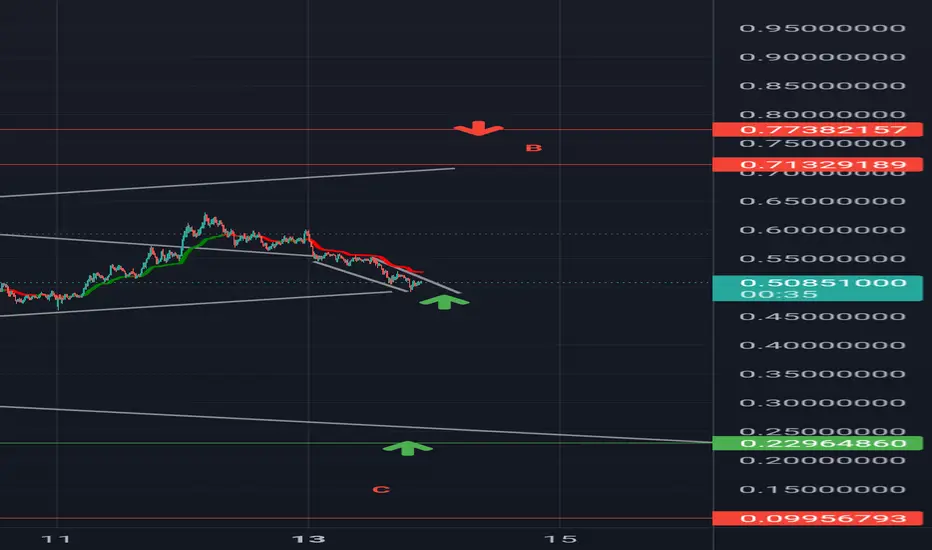
GBPJPY SHORT TERM SELLDivergence spotted in 1H TF and can be appreciated in 4H TF.
Our target is 153.7xx leve l, there is a high chance we reach this level by this week.
Trade ratio: 1,87 (Might increase if we enter in a higher level)
If it touch our SL we can wait for newer high as long (low probability, check my last analysis) as the curve in our indicator doesn't break the orange line on it.
BTCUSD is heading to the skybitcoin short term trade
Follow 3 steps to do entry
1. 1st breakout done
2. Retracement done
3. 2nd breakout and heading to the sky
good profit traders...

SAND short term hidden bullish divergence? 1h chartI would like to see another HL made around the white box and then boom HH around 7.42

RIVN 1hr chart analysisTrade Breakdown:
1. Buy at current price with stops below $92.
2. 1st PT at $106 & 2nd PT at $108.
Good luck!

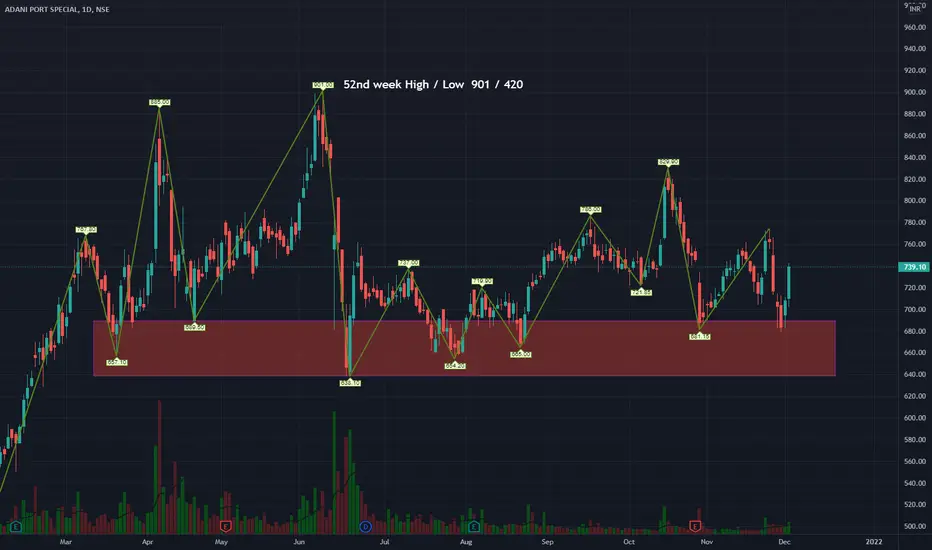
ADANIPORTS - possible upward moveCMP Rs. P/E Mar Cap Rs.Cr. NP Prev Qtr Rs.Cr. NP Qtr Rs.Cr. PAT Ann Rs.Cr. PAT 12M Rs.Cr. ROE 3Yr % ROE 5Yr % ROE 10Yr %
739.10 27.77 150884.56 1306.69 951.71 4997.04 5432.46 16.86 18.52 19.99
1. The stock has moved out of the major support zone.
2. The price should sustain over 737.
3. Next hurdles 767 and 786
4. A move above these prices should see a move upwards to 800-900 levels
For Intraday
Buy above 738 for a target of 754-774 with a stop loss of 727
For Short Term
Buy above 738 for a target of 797-829 with a stop loss of 715
For Long Term
Buy above 738 for a target of 900 with a stop loss of 679
Read chart carefully for trades
**UPDATE** SHORT PULLBACK ON FTM/USDT **UPDATE** SHORT PULLBACK ON FTM/USDT
After a nice bull run and nice gains we should expect a few days of a pullback.
I belive the pullback will come after we test the 0.618fib, it might start now without test it.
Its a good time to take some profits and wait for the price to calm down.
FOR ME THE PULLBACK WILL BE A GREAT TIME TO ADD SOME MORE TO MY BAG! IM A HODLER!
***btw do your own research***

BTCUSD trading and heading to the sky update on 27 Dec 2021Short-term trading BTCUSD
Follow my entry point, MUST fulfill 3 steps
1. 1st breakout done
2. Retracement done
3. 2nd breakout and heading to the sky
More pips is coming,traders~
Cheers

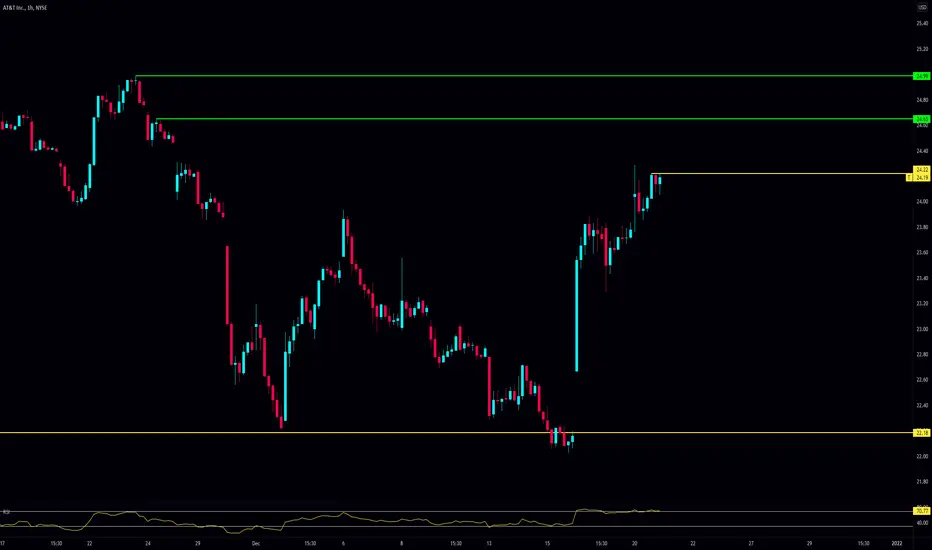
$T - Unorthodox Breakout Trade ThesisHistorically, $T is an extremely slow mover, which is why I was kind of shocked to see it as a potential breakout trade candidate.
For whatever reason, $T keeps aggressively rejecting off of 24.22, meaning that once these sells are cleared out, we're likely clear up to 24.64! Once 24.64 clears we see 25.00 rather quickly.
Although this move seems tiny on paper, if you play it with options, you can easily bag 200% gains in the blink of an eye.
If we clear 24.22, consider grabbing 12/23 24Cs or 12/23 25Cs, depending on your risk tolerance. GLHF!
Critical condition for market action, Short Term I go with LongConsidering the price has penetrated the MidTerm trendline for about 4 days, and also we have seen two consecutive Higher Highs and one Higher Low since Dec 20th after forming a triple bottom pattern in 4H time frame, I believe the short-term reversal has been confirmed.
Right now the short term trendline has been penetrated slightly which I believe is a fake one, Divergences indicators show divergence in many time frames eg, 1h and 4h.
Looking at RSI indicator and the beautiful descending trendline in 1h which is going to be broken soon is another confirmation of at least the short term bullish market.


GALA/USD Possible Buy Setup.This count is based on my assumptions so anything can happen not a trading or financial advice just for educational purposes only kindly do your own ta thanks trade with care good luck.
Name The Pattern?This count is based on my assumptions so anything can happen not a trading or financial advice just for educational purposes only kindly do your own ta thanks trade with care good luck.

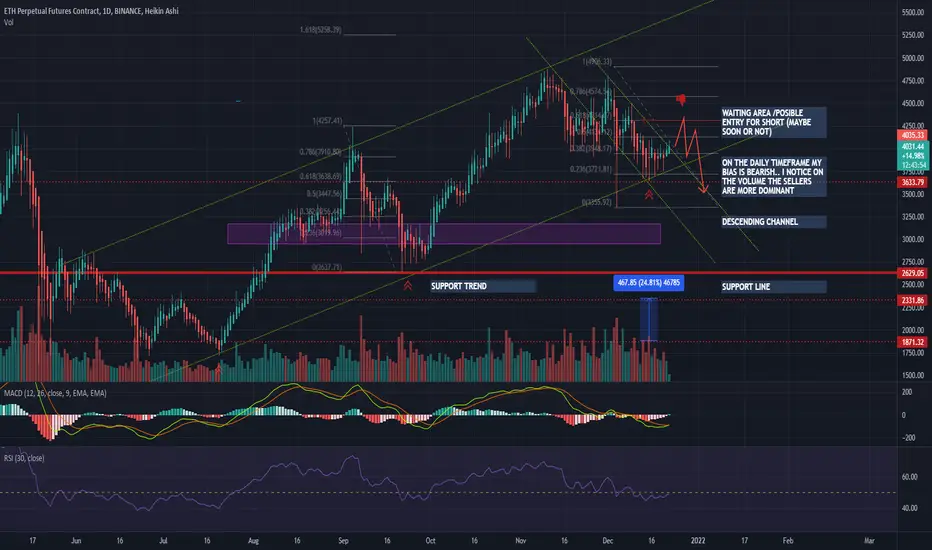
ETHUSDT ONE DAY TFHI EVERYONE!!!
im here again... as i watch the movement of ETHUSDT DAY TF... i notice that there is a forming of descending channel
A descending channel is a chart pattern formed from two downward trendlines drawn above and below a price representing
resistance and support levels. The descending channel pattern is also known as a
“ falling channel ” or “ channel down “.
The upper line is identified first, as running along the highs and is called the trendline.
im searching about the meaning and i found out that chart pattern will be going down.. ( i hope not )
btw its only my beginners idea and base it only in my knowledge.
if you have any comments and also ideas please do share here... it really motivate me to improve my learning in chart reading.
THANKS!!!!
XRP LONG AND SHORT OPPORTUNITYCurrently XRP at Resistance level.
XRP is now trading above the $0.87 support area and showing little strength because of the airdrop news. The major support for XRP is $0.745-$0.78 area. The local resistance for XRP is $0.93 and major resistance is $1-$1.10 area. If XRP hold above $0.87 then we see a test of $1 resistance area.
Hope you find it usefull.
Risk warning, disclaimer: the above is a personal market judgment based on published information and historical chart data on Tradingview, all analysis is only subjective. Hope investors consider, I am not responsible for your investment decision. Thank you.
Good luck!

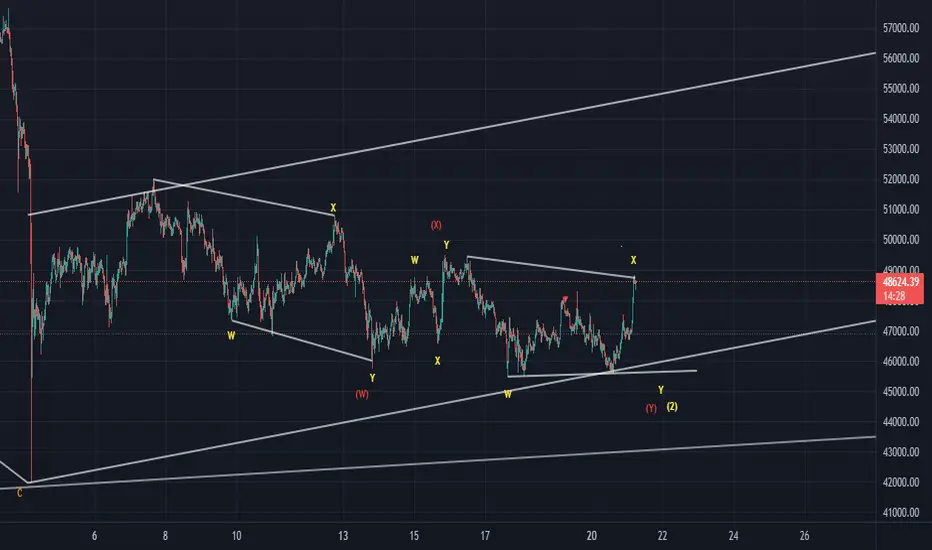
BTC Update.This count is based on my assumptions so anything can happen not a trading or financial advice just for educational purposes only kindly do your own ta thanks trade with care good luck.
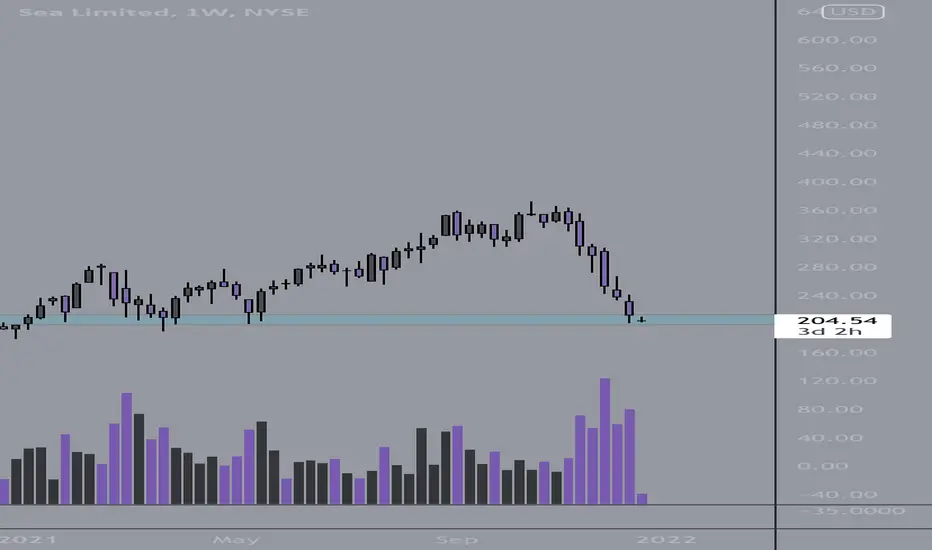
$SE extreme oversold levels, strong bounce in next few days $SE extremely oversold, looking for a long out of demand around this 200 level for a mean reversion to 250 in the short term. Strong growth stock backed with fundamentals, short covering rally is coming. Also to mention we are directly at the 100MA on this weekly chart, green day in the market will send this thing up quickly.
BTC - short-term In the descending channel , good reaction to support and resistance areas .
you should use these oscillations to buy for short term .
use my analysis for USDT Dominance too .
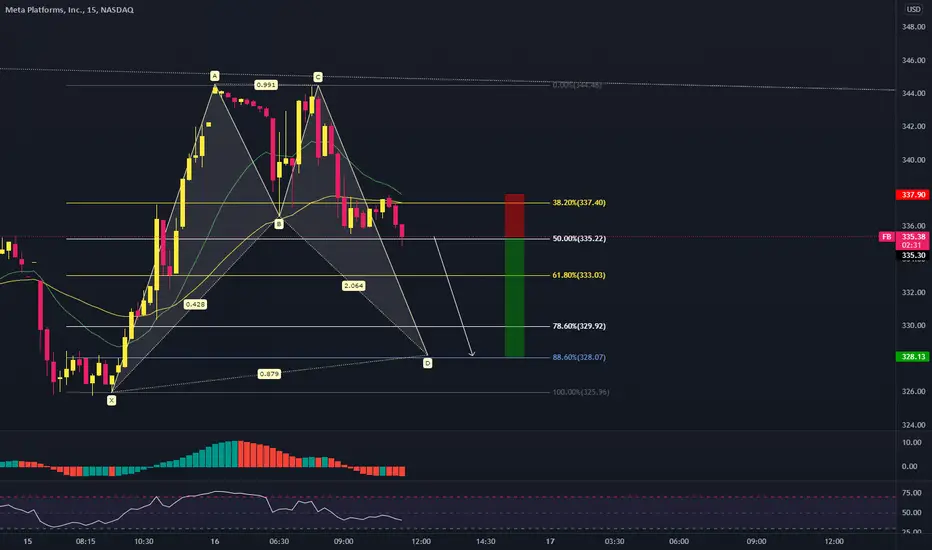
FB Bullish Bat on 15 minTrade Breakdown:
1. Short at $335 with stop loss above $338.
2. 1st PT @ $330, 2nd PT @ $328.5
Good luck!
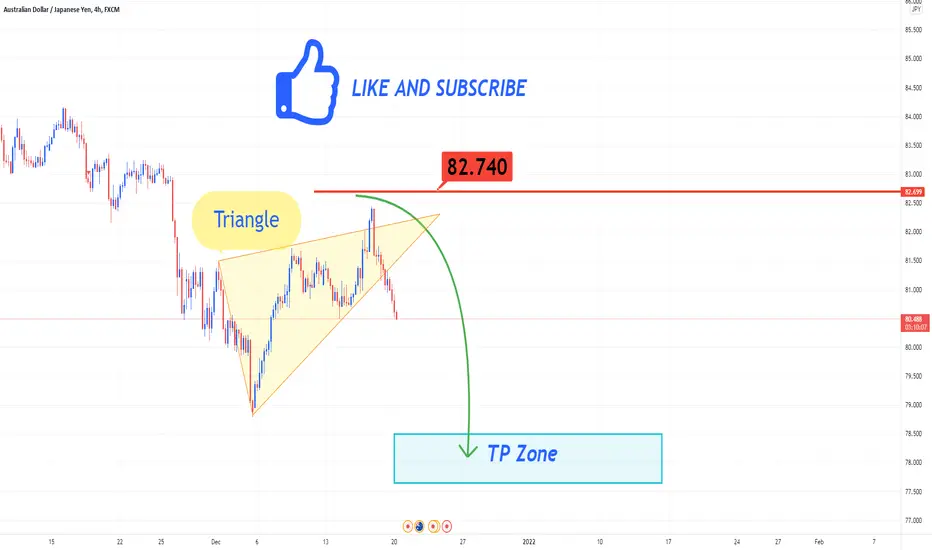
💡Don't miss the great Sell opportunity in AUDJPYHi dear Members. Hope you all are enjoying our ideas and analysis.
It seems that with the triangle broken, we should see the Australian dollar down in the coming hours. The area we are in is a very low risk area for sell. You can use the lower trigger time frame to enter.
Good luck to you all❤️
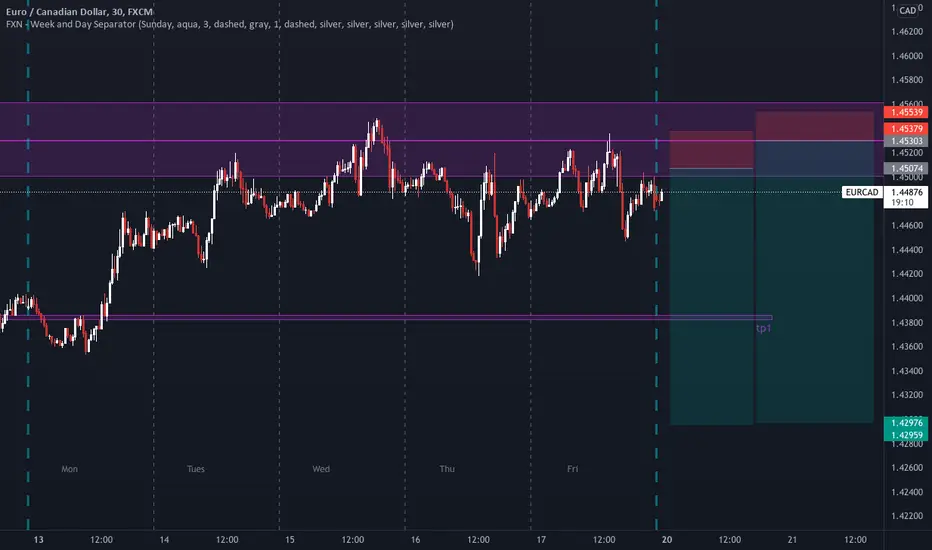
eurcad shortlooking for price to head towards 1.44 then possible push towards 1.43 without taking out last week high.
$SPOT - Breakout Trade Thesis$SPOT gives us the opportunity to play a breakout trade at these levels.
Look to go long if we get a breakout over the 238 level. PTs are 245.50 and 256.60. If all goes well we should capture an easy 8% move.
Look to go short if we get a breakout under the 216 level. This entry is less likely but it could lead to us catching a swift trip down to 211.
