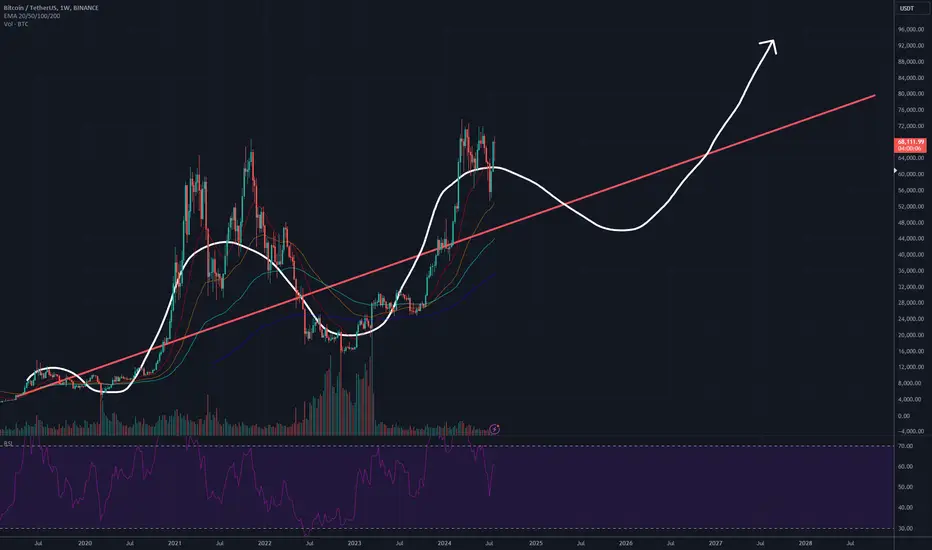
Bitcoin to continue meandering around this linear regressionAround 2019, BTC/USD began a linear regression that continues to be respected to this day. Now, it looks like we are currently making a move to the downside of the line, and I expect no lower than 38k. This is a long term play, and it may not be until early 2025 that the bottom is in, however it could be as early as November, which would be great timing for the presidential election. If Kamala wins, expect the bottom to be hit within a week. If Trump, then expect a short pump, followed by a long bleed into early 2025, and then the next run to an ATH will commence and I expect no higher than 100k.
Shortterm
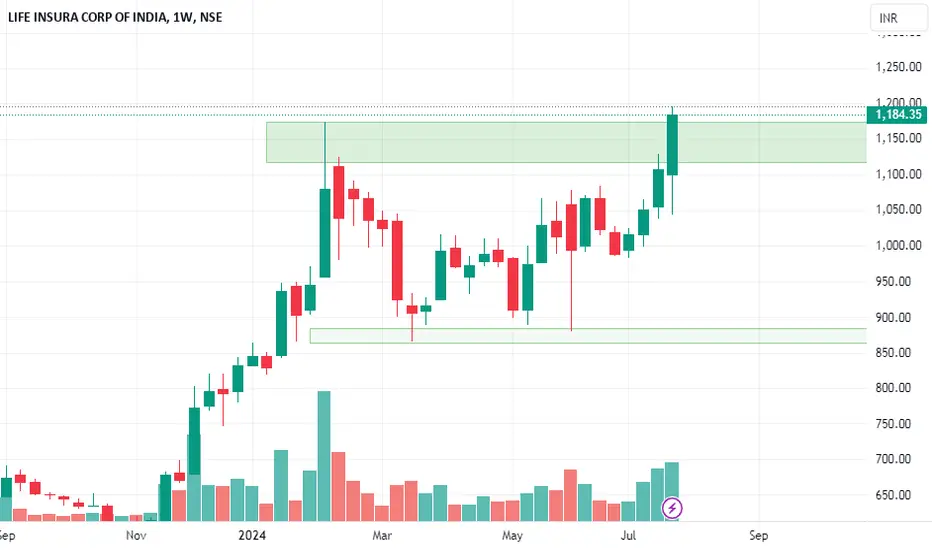
LICI Breakout!!!All Time High Breakout.
Box pattern Breakout.
Good Volume Buildup seen.
Accumulation Done.
Above all EMA.
Good for Short Term.
Do Like ,Comment , Follow for regular Updates...
Keep Learning ,Keep Earning...
Disclaimer : This is not a Buy or Sell recommendation. I am not SEBI Registered. Please consult your financial advisor before making any investments . This is for Educational purpose only.
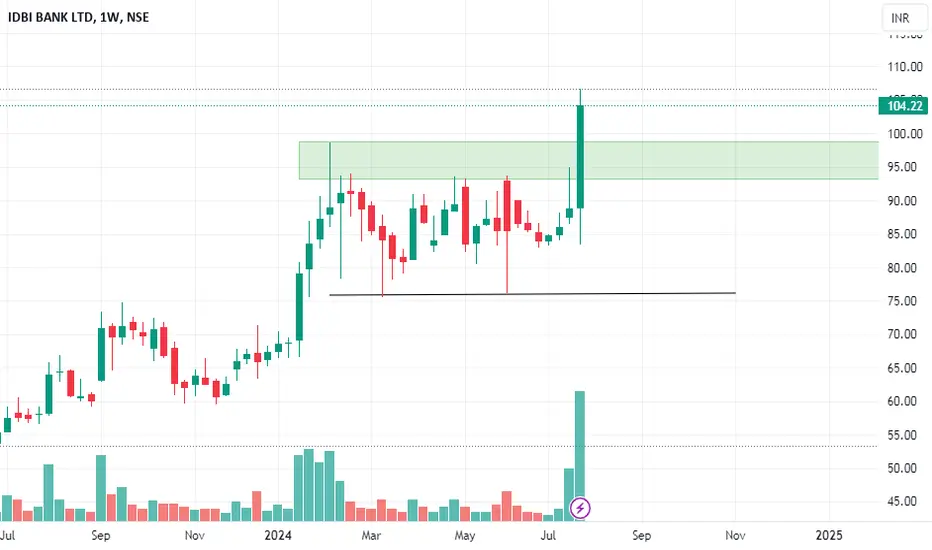
IDBI52 Week High Breakout.
Box Pattern .
Huge Volumes.
Accumulation Done.
Above all key EMA.
Good for Short Term.
Do Like ,Comment , Follow for regular Updates...
Keep Learning ,Keep Earning...
Disclaimer : This is not a Buy or Sell recommendation. I am not SEBI Registered. Please consult your financial advisor before making any investments . This is for Educational purpose only.
MARKSANSWeekly Breakout Done.
Accumulation Done.
Huge Volumes.
Good for Short Term.
Do Like ,Comment , Follow for regular Updates...
Keep Learning ,Keep Earning...
Disclaimer : This is not a Buy or Sell recommendation. I am not SEBI Registered. Please consult your financial advisor before making any investments . This is for Educational purpose only.

Quick long setupLooks bullish. Long trade placed. But I don't risk to hold it through the earnings ....

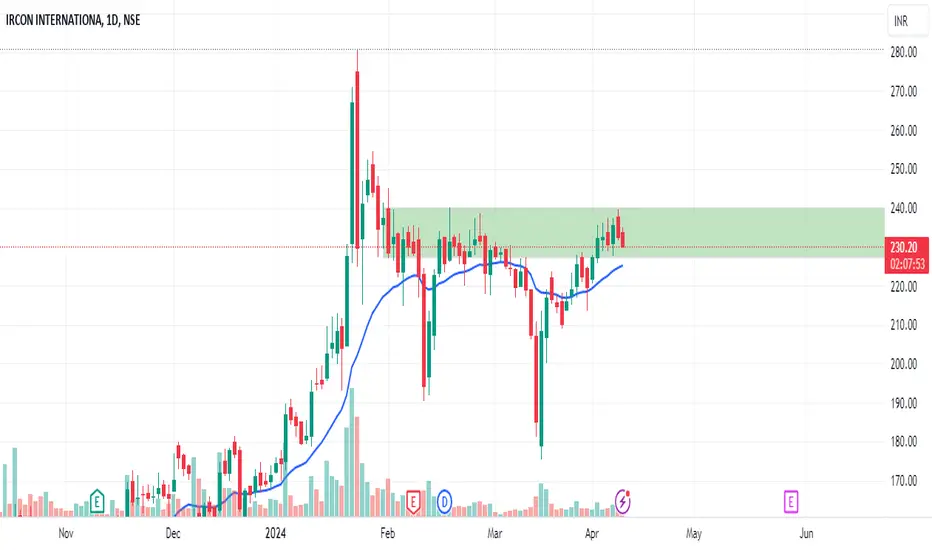
IRCONConsolidation happening at Resistance Level.
Looks good on Chart.
Above all EMA.
Short term target 280.
Do Like ,Comment , Follow for regular Updates...
Disclaimer : This is not a Buy or Sell recommendation. I am not SEBI Registered. Please consult your financial advisor before making any investments . This is for Educational purpose only.
Investment or Trade Mindset With ExampleNow looking to this chart, if we have long term vision then my question is "How long ?" and "Why Long?". Many of you are already familiar with technical or fundamental analysis but my point is how to discriminate your mind into two half for a same script or same sector.
Coming to the solution:
Let's know about benefits -"FAYDA". If we can then we can ride long term and short term both and by hypothetical calculation it will shock will brain like anything else.
Personally I have no interest to be biased for long term or short term. I can see only "Munafa" means profit.
It's very simple.
Step 1: For long term holding hold the script in account "A"
And for short term use different account "B"
Step 2: Well Define your long term system and short term system and place it in-front of your working table or place.
Step 3: Even for analysis use two different drawing.
Step 4: Even after doing these all your mind will disturb you. Just take a break of your screen by placing alert on your system.
I hope this can help you. Kindly let me know something that I can discuss and share with you.
In this way I am also learning.
Thank you for reading.

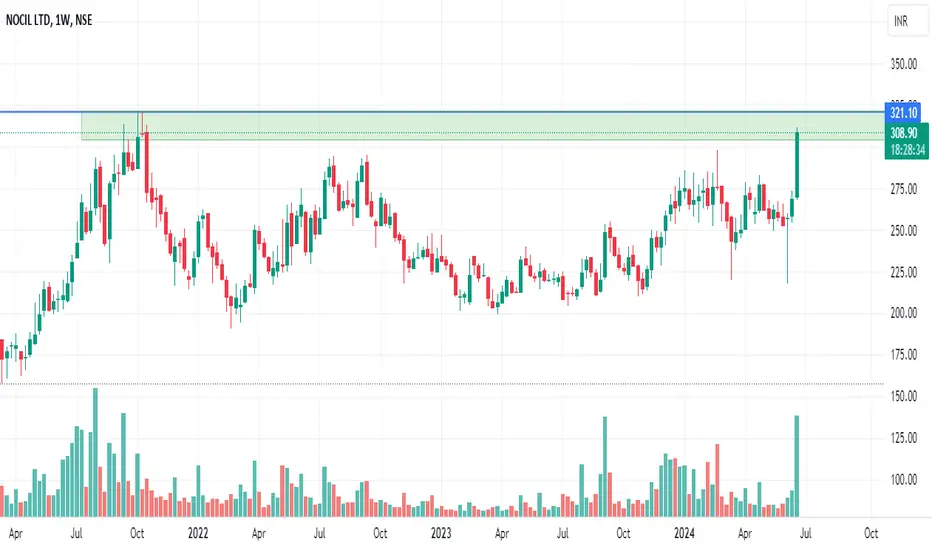
NOCILLooks ready for an All Time High Breakout.
Huge Consolidation Done.
Massive Volume Buildup.
Above all Key EMA.
Good for Short Term.
Do Like ,Comment , Follow for regular Updates...
Keep Learning ,Keep Earning...
Disclaimer : This is not a Buy or Sell recommendation. I am not SEBI Registered. Please consult your financial advisor before making any investments . This is for Educational purpose only.
INDOTECH: short term target reachedNSE:INDOTECH has reached its short term target and is trading at its all time high range. After I last gave the pattern, there were more lower peaks and higher troughs.

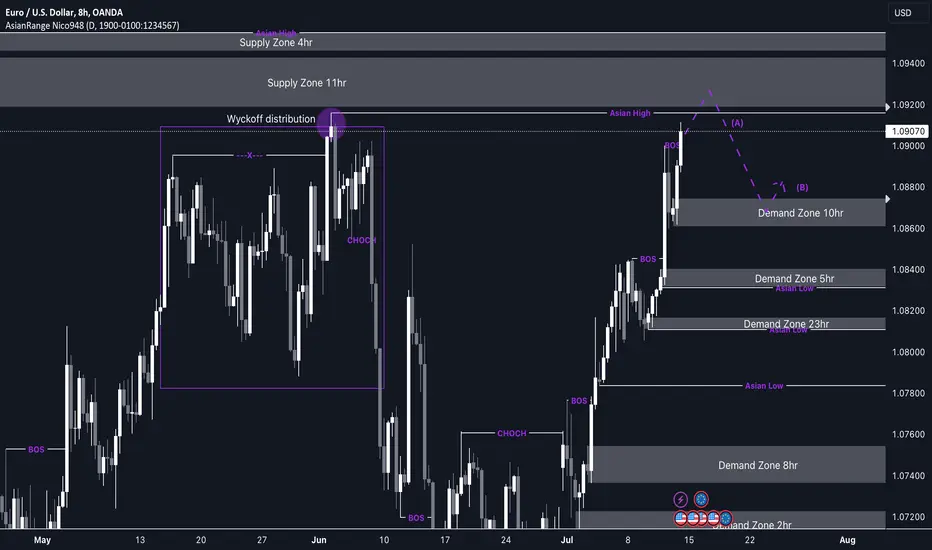
EUR/USD Shorts from 1.09200 (Sell to Buy) My EU bias currently is to catch a temporary move down. As price approaches a high-quality 11-hour supply zone, I'll be watching for a Wyckoff distribution to confirm a sell opportunity.
Whether or not price mitigates the supply zone, I'm expecting it to retrace to a newly formed demand zone, ultimately aiming to make a new high. Therefore, once price reaches the 10-hour demand zone, I will be looking for buy opportunities.
Confluences for EU Sells are as follows :
- Price has been very bullish, breaking structure to the upside.
- The current trend is bullish, matching the dropping DXY.
- There is significant liquidity to the upside, with strong bullish candles on the higher time frame.
- Demand zones have been created near the current price, indicating potential for another rally.
P.S. Once price returns to the 10-hour demand zone, I will be on the lookout for a Change of Character (CHOCH) on the lower time frame to confirm my buy opportunities. For now, I'll wait to see how Monday's market opens.
SCILooks Good on charts.
Above all Key EMA.
Short term Target 290.
Do Like ,Comment , Follow for regular Updates...
Keep Learning ,Keep Earning...
Disclaimer : This is not a Buy or Sell recommendation. I am not SEBI Registered. Please consult your financial advisor before making any investments . This is for Educational purpose only.

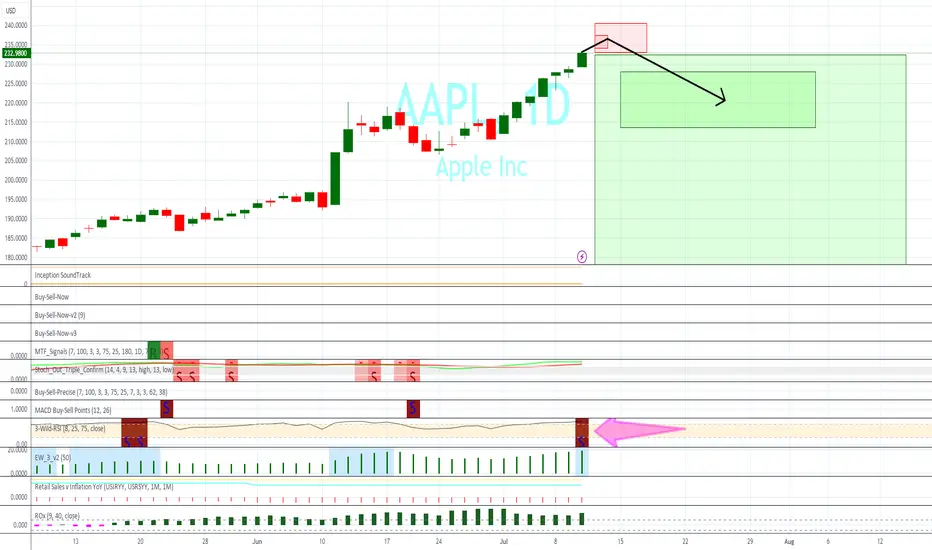
AAPL Signals Short Term DropOf the 71 times AAPL triggers a sell on my RSI indicator (the magenta arrow at the bottom of the chart), the stock drops 97.143% of the time in the following 25 trading days. During 37% of the successful drops, the stock moves upward for 1-4 more days after the signal occurs in what I call the delay period.
What qualifies as a successful drop? The sell signal was triggered based on the closing price of AAPL stock on July 10, 2024 at 232.98. This means 97% of the time the stock will move below this closing price in the near-term. 2.85% of the time, the stock does not drop below this price over the following 25 trading days. The stock has always dropped below the signal closing price by at least 0.266% over the next 100 trading days.
On the chart above, the red boxes at the top are the delay zones of interest. The larger red box contains 100% of all delayed movement. The smaller box contains the stock's top or peak of the delay for 50% of the occasions. The same holds true for the two large green target boxes on the bottom. The final downward movement bottoms in the smaller green box 50% of the time, while the much larger green box contains bottoms or valleys for all downward movement.
This delay period of potential continued upward movement has historically had a maximum 3% gain before the stock eventually dropped. Regarding the bottom of the drop. Over the next 25 bars, it can occur on any day in the range with the median bottom occurring by day 8. 75% of the bottoms have occurred before day 18. The stock drops a minim of 0.266%, and median of 5.021%. 25% of the bottoms are no lower than 2.152%, while 75% of the drops are 8.3% or less.
The four shallowest drops over the next 25 days have been 0.266% (September 2010), 0.312% (February 2017), 0.827% (March 2019), and, 0.868% (August 2020) while the four deepest drops have been 63.23% (August 2000), 26.58% (December 1999), 26.51% (January 2006), and 24.80% (September 1999). The most recent double-digit percentage drop was 15% in April 2019. All shallow drops occurred in the most recent strong bull market, while the largest drops were part of the dot-com bubble burst.
While this current potential drop will likely avoid the sharper end of sell-offs, it is always interesting to see the strength and accuracy of signals. Historical movement is not indicative of future movement, but it is good to have as a data point.
JSWINFRALooks Supergood on Charts.
Near All Time High.
Above all Key EMA.
Good for Shortterm.
Do Like ,Comment , Follow for regular Updates...
Keep Learning ,Keep Earning...
Disclaimer : This is not a Buy or Sell recommendation. I am not SEBI Registered. Please consult your financial advisor before making any investments . This is for Educational purpose only.

UMANGDAIRYLooks Ready for a Triangle Breakout.
Volume Buildup seen.
Good for Short Term.
Do Like ,Comment , Follow for regular Updates...
Keep Learning ,Keep Earning...
Disclaimer : This is not a Buy or Sell recommendation. I am not SEBI Registered. Please consult your financial advisor before making any investments . This is for Educational purpose only.

PGILRound Bottom Pattern Breakout.
Good Accumulation Done.
Huge Volumes.
Above all Key EMA.
Good for Short Term.
Do Like ,Comment , Follow for regular Updates...
Keep Learning ,Keep Earning...
Disclaimer : This is not a Buy or Sell recommendation. I am not SEBI Registered. Please consult your financial advisor before making any investments . This is for Educational purpose only.

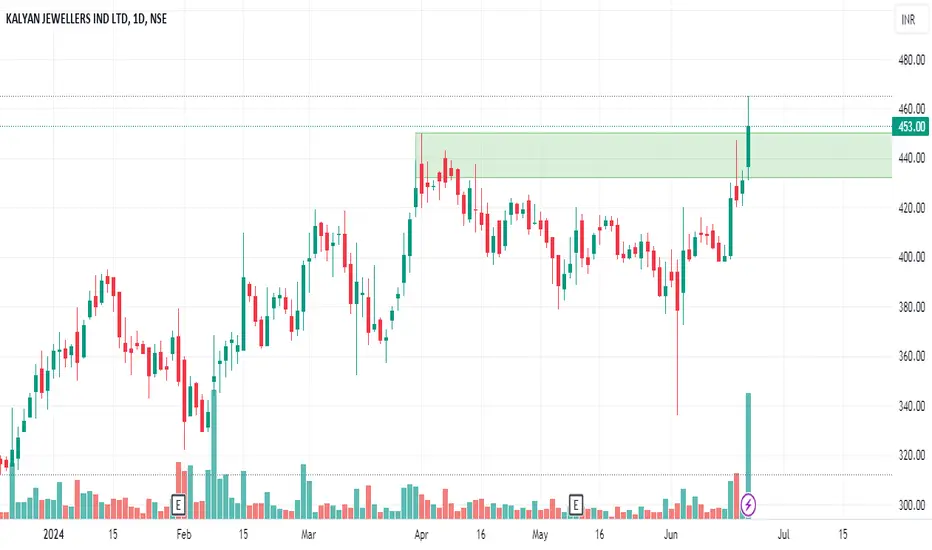
KALYANKJILAll Time High Breakout.
Accumulation Done.
Good Volumes.
Above all Key EMA.
Good for Short Term.
Do Like ,Comment , Follow for regular Updates...
Keep Learning ,Keep Earning...
Disclaimer : This is not a Buy or Sell recommendation. I am not SEBI Registered. Please consult your financial advisor before making any investments . This is for Educational purpose only.
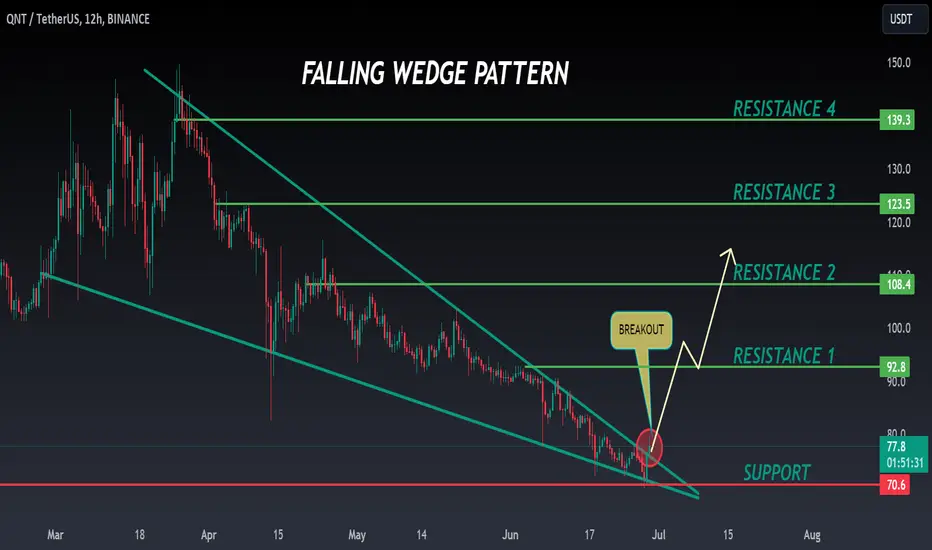
QNT ANALYSIS🔮 #QNT Analysis - Breakout 🚀🚀
💲💲 There is a breakout of Falling Wedge Pattern in #QNT. It's a 12hr time frame breakout and it's ready for a bullish move of around 40% in for short term and around 80% in long term
💸Current Price -- $77.9
📈Target Price -- $139.3
⁉️ What to do?
- We have marked crucial levels in the chart . We can trade according to the chart and make some profits. 🚀💸
#QNT #Cryptocurrency #Breakout #DYOR
TRIGYNRound Bottom Structure.
Gaps to be filled Likely.
Good Volume Buildup.
Good for Short Term.
Target 168 , 216.
Do Like ,Comment , Follow for regular Updates...
Keep Learning ,Keep Earning...
Disclaimer : This is not a Buy or Sell recommendation. I am not SEBI Registered. Please consult your financial advisor before making any investments . This is for Educational purpose only.

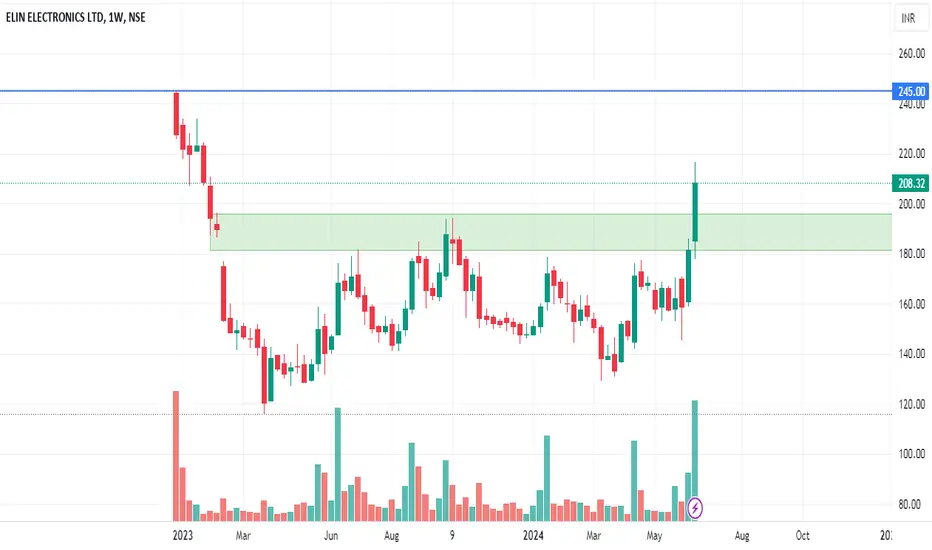
ELIN52 Week High Breakout.
Huge Volumes.
Accumulation Done.
Good for Short Term.
Do Like ,Comment , Follow for regular Updates...
Keep Learning ,Keep Earning...
Disclaimer : This is not a Buy or Sell recommendation. I am not SEBI Registered. Please consult your financial advisor before making any investments . This is for Educational purpose only.
HUHTAMAKILooks Ready for a Multiyear Breakout.
Good Volume Buildup.
Above all Key EMA.
Good for Short Term.
Do Like ,Comment , Follow for regular Updates...
Keep Learning ,Keep Earning...
Disclaimer : This is not a Buy or Sell recommendation. I am not SEBI Registered. Please consult your financial advisor before making any investments . This is for Educational purpose only.

QQQ Thursday Gap Up ReversalShort-term & small sample, but an interesting pattern nonetheless...
If we look back at similar events to Thursday's action, they've all been short-term tops in the market. We're looking at: (1) Gap up open on a Thursday; (2) Bearish reversal closing near the lows of the day; (3) Increased Volume from the prior day(s); (4) Preceded by a good run in the market.
I think it's worth noting, although I'm not sure the market dynamic behind it, that these recent short-term tops have all occurred on a Thursday. So seeing similar-type action this past Thursday is sending up a short-term cautionary signal, especially after such a strong runup over the last few weeks. I want to emphasize 'short-term' though, because the long-term trend is still very much in tact. It may also be worth noting the lack of breadth under the hood as an additional short-term cautionary sign, although there are certain areas and groups that have been participating... it's been very much a stock picker's type of environment.

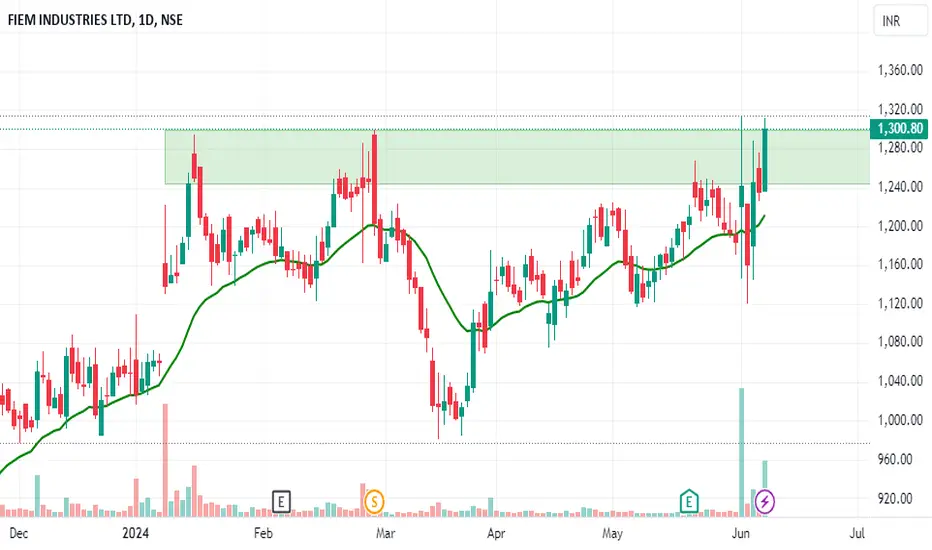
FIEMINDLooks Good on Charts.
Volume Buildup seen.
Breakout Possible.
Above all Key EMA.
Good for Short Term.
Do Like ,Comment , Follow for regular Updates...
Keep Learning ,Keep Earning...
Disclaimer : This is not a Buy or Sell recommendation. I am not SEBI Registered. Please consult your financial advisor before making any investments . This is for Educational purpose only.
HPLAll Time High Breakout.
Massive Volume Buildup.
Above all Key EMA.
Good for Short Term.
Do Like ,Comment , Follow for regular Updates...
Keep Learning ,Keep Earning...
Disclaimer : This is not a Buy or Sell recommendation. I am not SEBI Registered. Please consult your financial advisor before making any investments . This is for Educational purpose only.
