A little correction on Bitcoin?We can see that Bitcoin is experiencing some downward pressure and that support has been broken for now. Are we going to make further correction and find the zone around $53500 or still a zone lower. It would not be bad after the long bullish trend. Let's catch our breath and look for new buyers. Let's go!
Shortterm

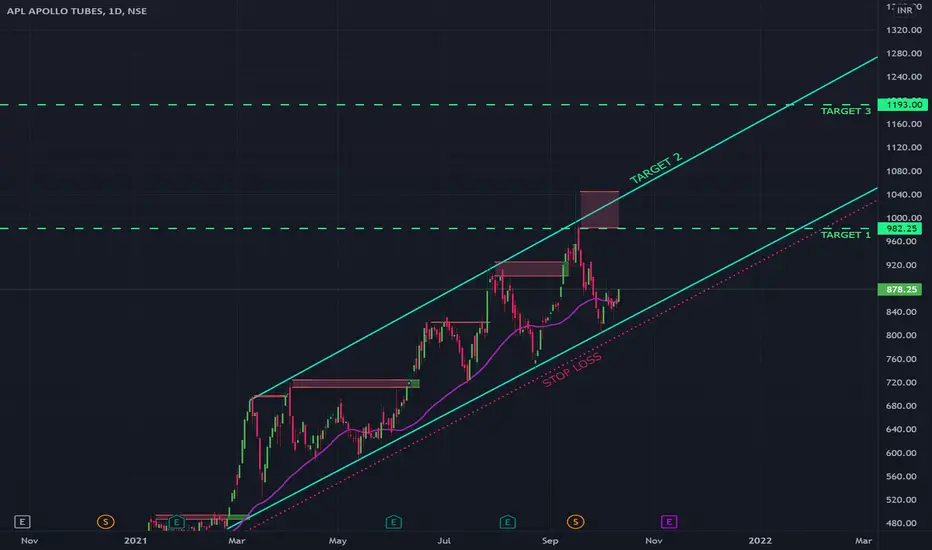
A short-term bullish set-up in APL APOLLONSE:APLAPOLLO
The stock has taken support on the support trendline and looks to have started a bullish trend.
One can enter for a swing opportunity at CMP.
Target 1 in the previous swing high of 982.
Target 2 is the resistance trendline.
Target 3 is 1193 which is Fib retracement line.
keep a trailing SL below the support trendline.
Happy Trading.
Can the tesla fall and by how much???Let's try to see where Tesla's price can drop to. Now the important point is that if there are no more buyers and the price goes over a thousand, then the nearest pivot point according to Fibo, will be 918.5.
For now, we stay out of the market and watch. If you short, then very carefully.
It is better to put a limit order)
❤️ If you find this helpful and want more FREE forecasts in TradingView
. . . . . Please show your support back,
. . . . . . . . Hit the 👍 LIKE button,
. . . . . . . . . . . Drop some feedback below in the comment!
❤️ Your Support is very much 🙏 appreciated!❤️
💎 Want us to help you become a better Stock trader?
Now, It's your turn!
Be sure to leave a comment let us know how do you see this opportunity and forecast.


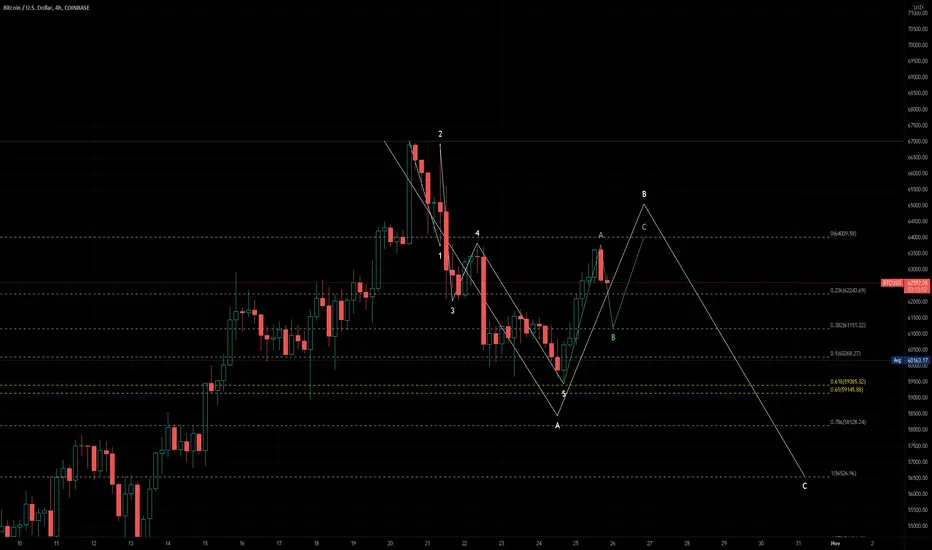
Weekend target of 56k possible for an ABC correctionThere looks to be a high possibility that bitcoin is currently in an ABC correction coming down from the current ATH.
As shown, A ended at ~59.5k with a 5 wave correction down and now we are an ABC correction (shown in green) for a larger B correction up.
I think from here bitcoin will fall back to the 61k region with a bounce to 64k to complete the B wave.
Note: A break of 59.5k would invalidate this and we would have to say Wave C down has begun with Wave B ending at 63.7k and have to find new potential targets and Wave counts.
Then after, 5 waves down to complete the C wave which shown by an estimation of a 1 to 1 retrace puts it near 56.5k.
As to the timing I use parabolic curves (I have found to be good at finding reversals) for the B wave ending on the 4H chart:
For the ending C wave:
This also suggests that it may drop to around 56k as there is a strong potential for support here as shown by the green horizontal line drawn in.
I would say most likely a bounce will happen in this area as long as it follows this path.
There currently is hidden bullish divergence on the 4H RSI which I believe to be playing out now and also a hidden bull is showing on the daily.
I believe for the daily RSI though there is potential to be a stronger hidden bull that will occur following this ABC correction
Yellow - Current Hidden Bullish Divergence
Green - Potential Hidden Bullish Divergence at the end of Wave C
To invalidate this being an ABC correction, or to say it already completed, it will need to break the current ATH, then I will need to reassess as to where the new target may be.
As to what this means overall for bitcoin I will wait and see as to what happens next.
If this is a B wave we're currently in I will like to see where it ends first. After that it would be more accurate to figure out where Wave C would end and then determine what count we are starting on the larger time frames (Weekly and up).
I will post more ideas to this and more about the idea of still seeing a new ATH in the near future and what the potential target(s) may be.
***Disclaimer: I am not a financial professional/expert and all ideas from me are all speculation based off of my own research. Please do your own research as well as I am not responsible for others when it comes to their financial decisions.***
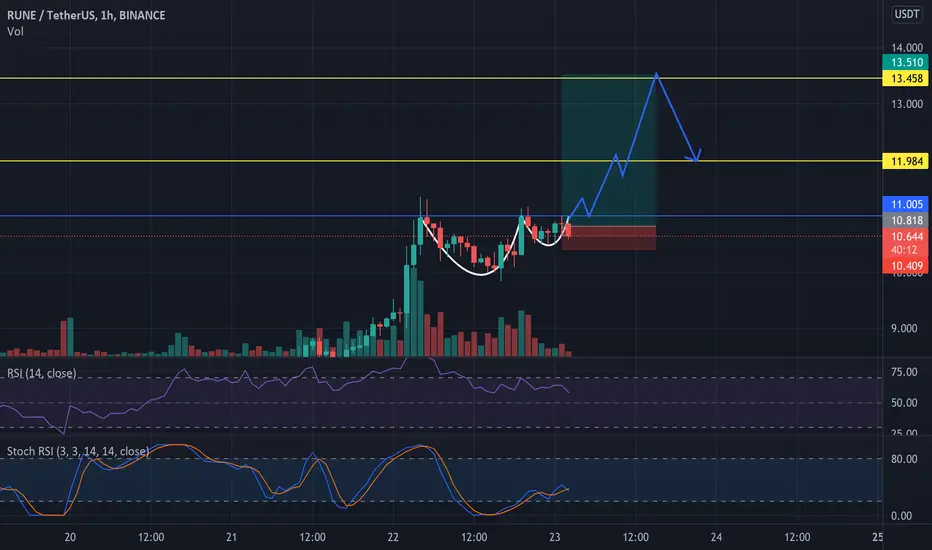
LONG RUNE ROUNDING BOTTOM Short/Mid term + TPSWait for confirmation before going in, I will update the post (follow to keep updated). Short term TPs in Yellow, mid term TPs in Green.
Good volume, very bullish configuration the reason im waiting to go in is BTC on support. Have a good day trading !

Bitcoin - The Next Two MonthsBitcoin looks good to me in the next few months, probably could go down in the interim.
Not investment advice!

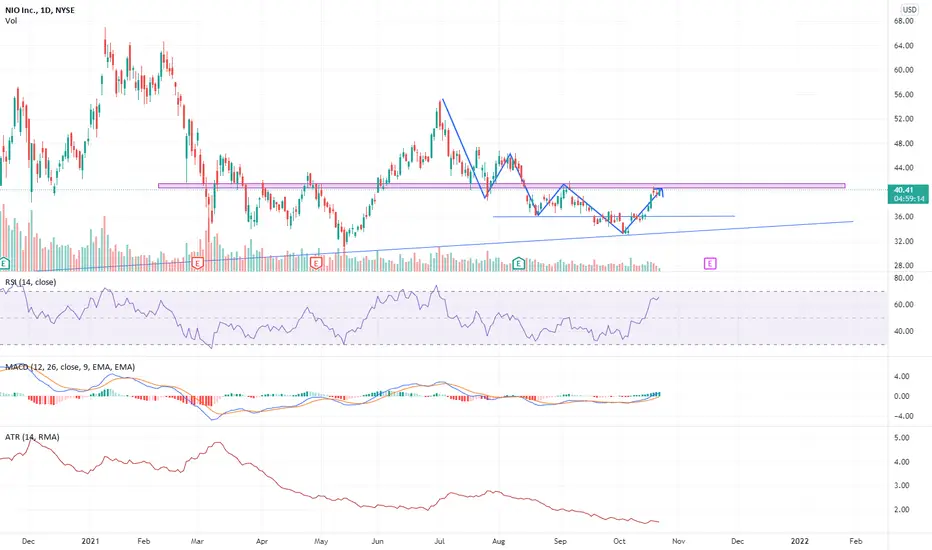
Nio Potential Reversal if crosses above 40Potential reversal from short term downtrend since Jul 2021, if it successfully breaks above $40.
If convicted above 40, near term support is back at 36 (2nd last lower low).
Possibility of pullback at 40 with RSI at overbought. Inclination is downwards.


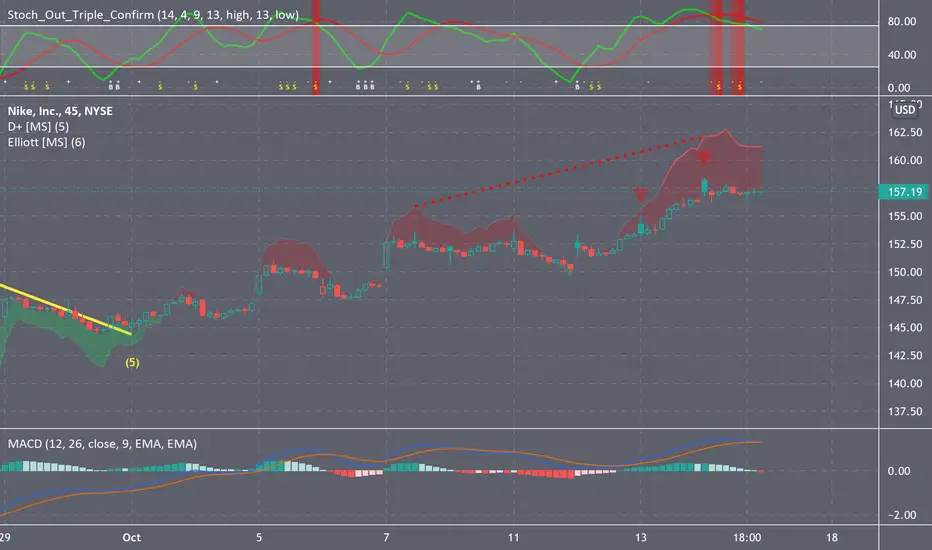
Set To Fall NKE is set to fall immediately, I have placed a large position to put NKE.
Technicals to look at:
Divergence+ gives a sell signal & their signals have not failed me in the past. I have been a long term customer and the profits I have made from these signals have paid for the subscription the remainder of my life. These signals are based on RSI & divergence. I am sponsored by @marketscripters so please message them for info on a low cost subscription that can help you make better trade decisions.
The MACD also shows weakening bullish divergence & growing bearish divergence
Guth 3x Confirm also has 2 very strong sell signals
My plan is to buy Puts for $155 a share Expiring 10.22.21 at the open of todays trading session and scalp a 5-75% profit based on this drop
Follow for more charts like this
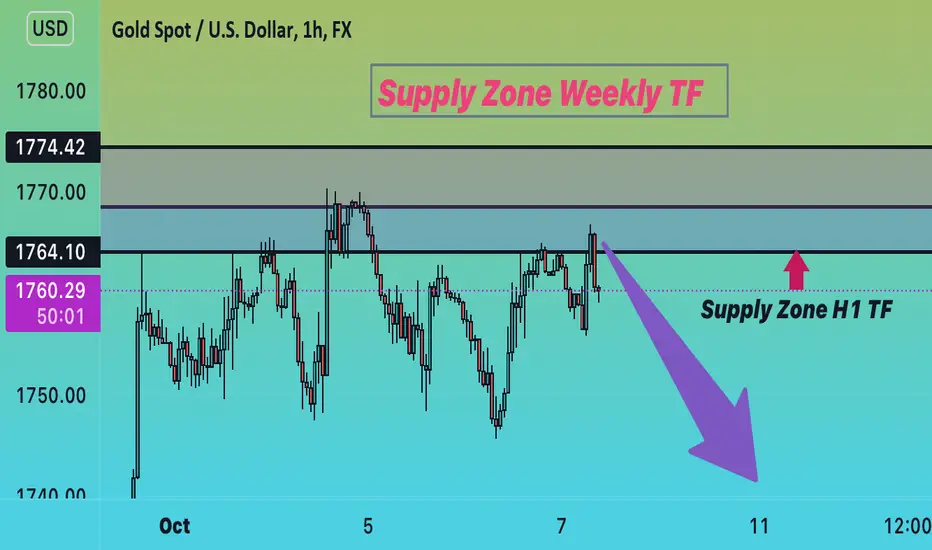
Time to sell GoldThe position of Gold is currently below the Weekly and 1 hour Supply Zone, and the projections will start to decline.
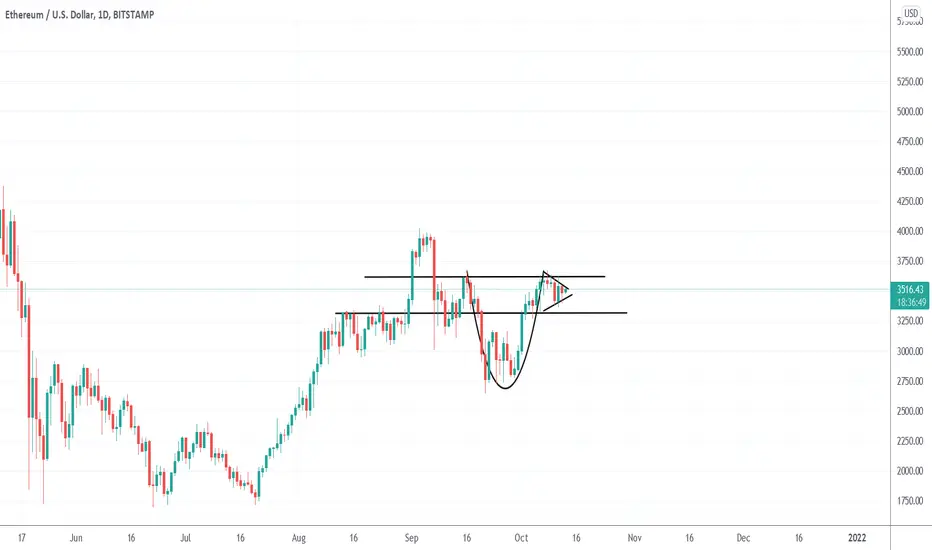
A Bull run of nearly 400$ is near The graph is making Cup and handle Pattern and by the book the depth it creates inthe curve the nearly same jump we can expect so in my opinion after the breakout Eth will gonna jump atleast 400$ for a short term period.