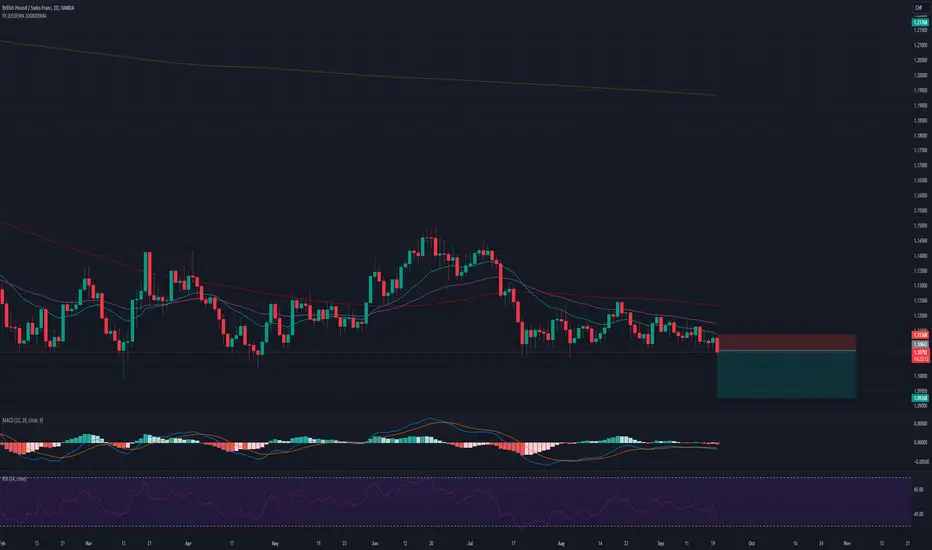
Daily Wave Rider - GBPCHF - SELLGBPCHF
Channel: RED
WK Pivot: RED
AOB: WP
CON: SBB
SELL Stop: 1.10843
Stop Loss: 1.11368
TP01: 1.10318
TP02: 1.09268
DWR present as a sell setup on 18SEP, with Channel and Pivot are red bouncing of weekly pivot.
Trade is taken as we are looking to sell Risk-Off currencies.
SPX500: BUY
DXY: SELL
OIL: SELL
GOLD: BUY
Shorttrade
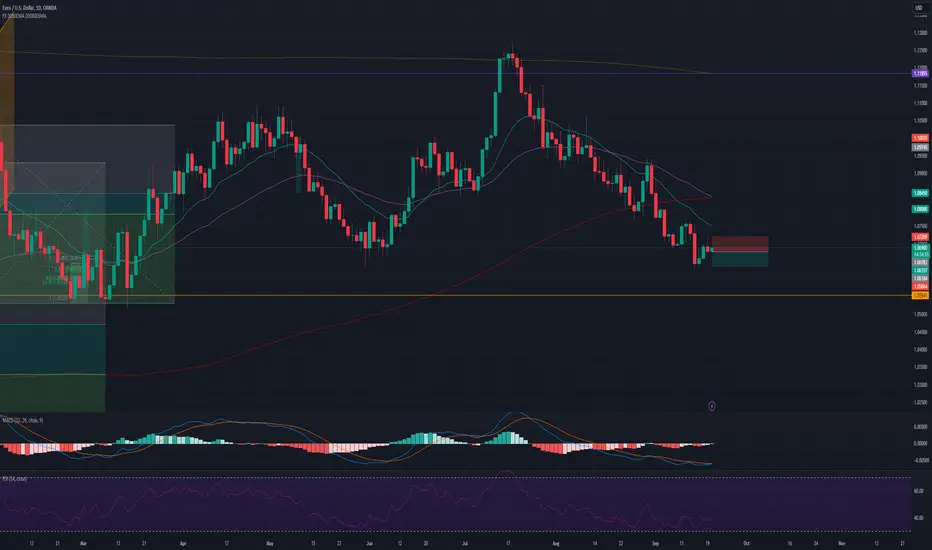
Daily Wave Rider - EURUSD - SELL
EURUSD
Channel: RED
WK Pivot: RED
AOB: EMA10
CON: SBB
SELL Stop: 1.06783
Stop Loss: 1.07209
TP01: 1.06357
DWR present as a sell setup on 18SEP, with Channel and Pivot are red bouncing of EMA10
However, trade is not taken/considered as it is not within our trading rules.
SPX500: BUY
DXY: SELL
OIL: SELL
GOLD: BUY
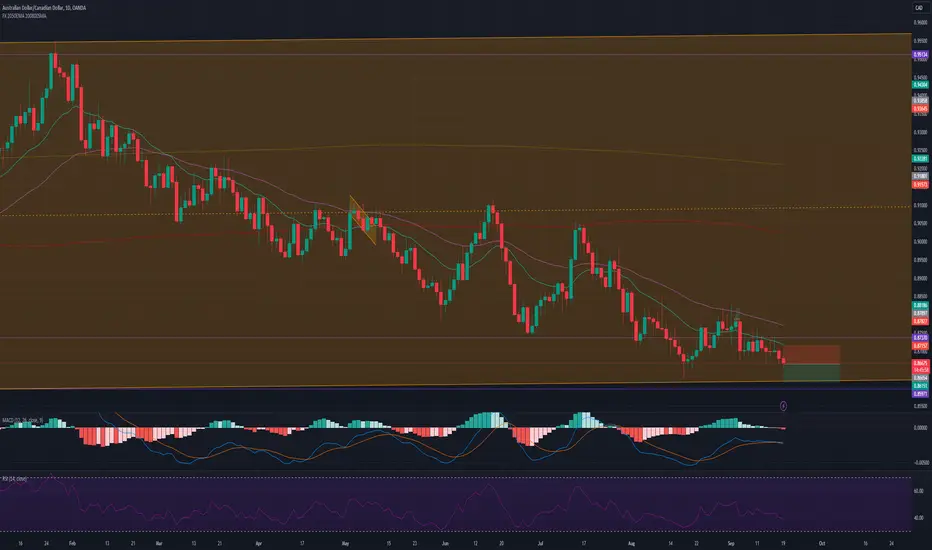
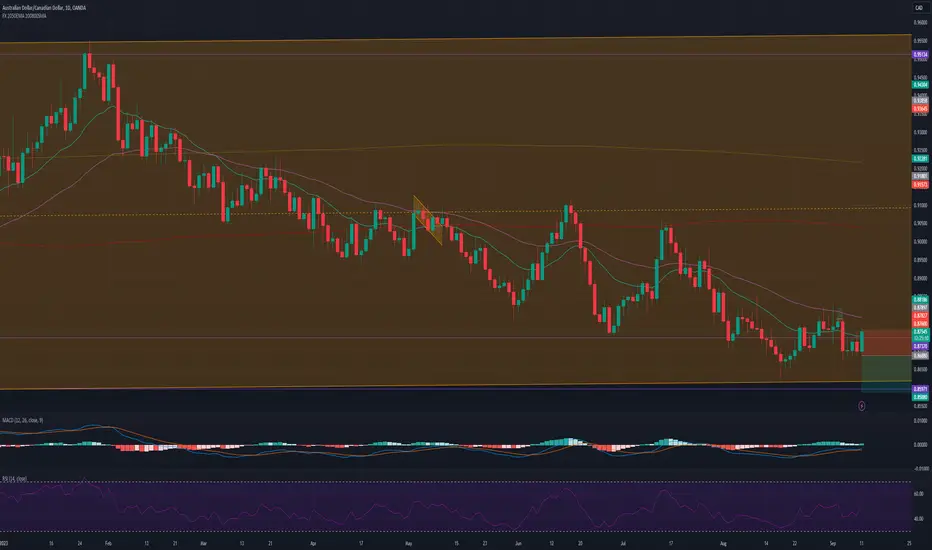
Daily Wave Rider - AUDCAD - SELLAUDCAD
Channel: RED
WK Pivot: RED
AOB: WP
CON: EngB
SELL Stop: 0.86654
Stop Loss: 0.87157
TP01: 0.86151
DWR present as a sell setup on 18SEP, with Channel and Pivot are red bouncing of weekly pivot
However, trade is not taken/considered as it differs from our Market Analysis Bias.
SPX500: BUY
DXY: SELL
OIL: SELL
GOLD: BUY
Reference to our WK38 analysis, we are anticipating a "Risk-On" sentiments thus will BUY AUD/NZD.
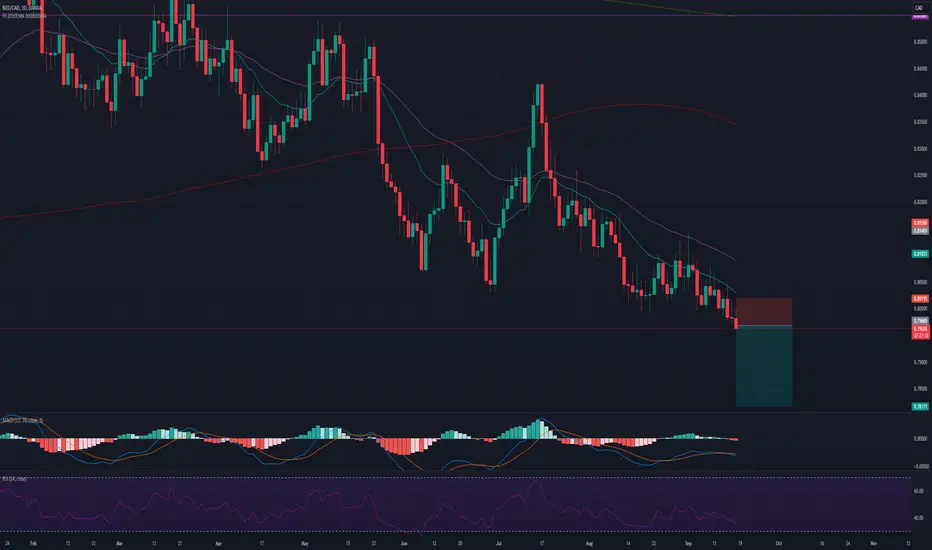
Daily Wave Rider - NZDCAD -SELLNZDCAD
Channel: RED
WK Pivot: RED
AOB: EMA10
CON: SBB
SELL Stop: 0.79689
Stop Loss: 0.80195
TP01: 0.79183
TP02: 0.78171
DWR present as a sell setup on 18SEP, with Channel and Pivot are red bouncing of EMA10
However, trade is not taken/considered as it differs from our Market Analysis Bias.
SPX500: BUY
DXY: SELL
OIL: SELL
GOLD: BUY
Reference to our WK38 analysis, we are anticipating a "Risk-On" sentiments thus will BUY AUD/NZD
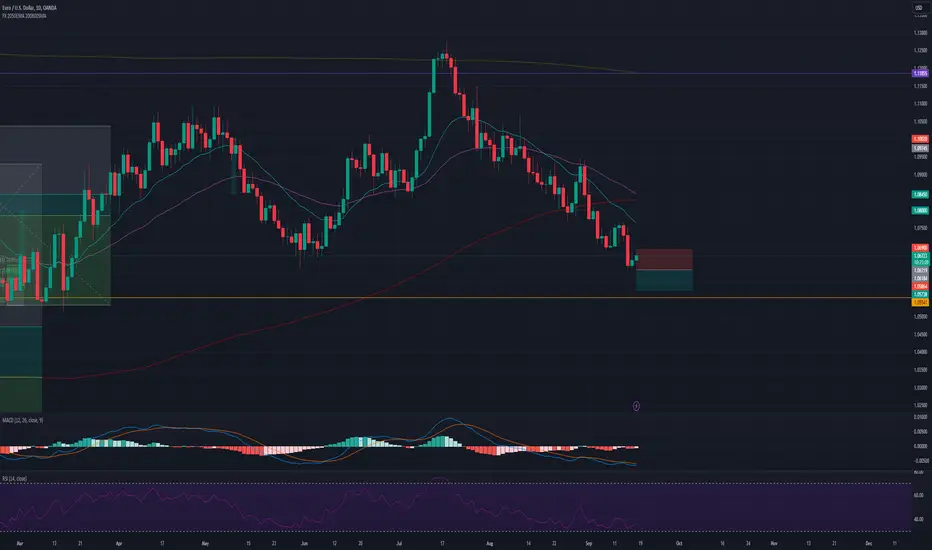
Daily Wave Rider - EURUSD - SELLEURUSD
Channel: RED
WK Pivot: RED
AOB: WP
CON: IB
SELL Stop: 1.06319
Stop Loss: 1.06900
TP01: 1.05738
DWR present as a sell setup on 18SEP, with Channel and Pivot are red bouncing of weekly pivot
However, trade is not taken/considered as it differs from our Market Analysis Bias.
SPX500: BUY
DXY: SELL
OIL: SELL
GOLD: BUY
Reference to our WK38 analysis, we are anticipating a "Risk-On" sentiments thus will BUY USD.
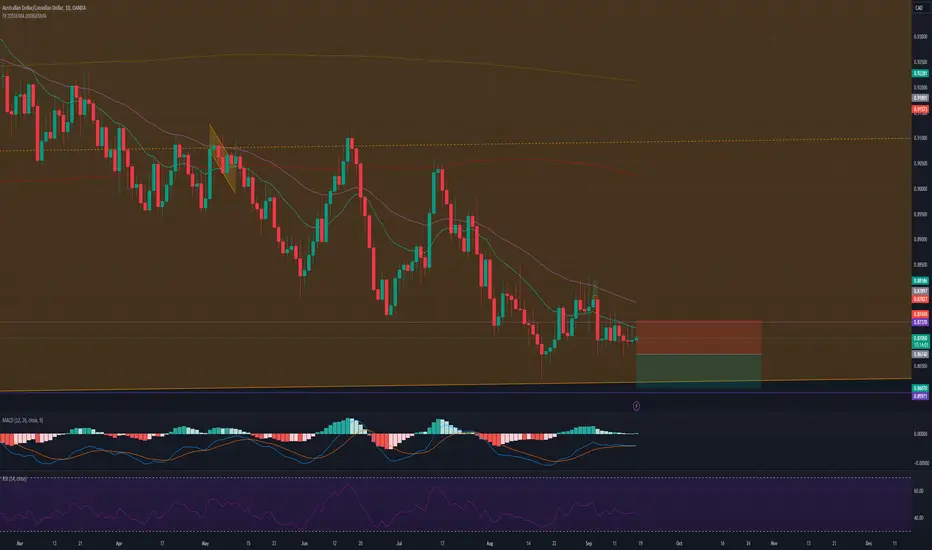
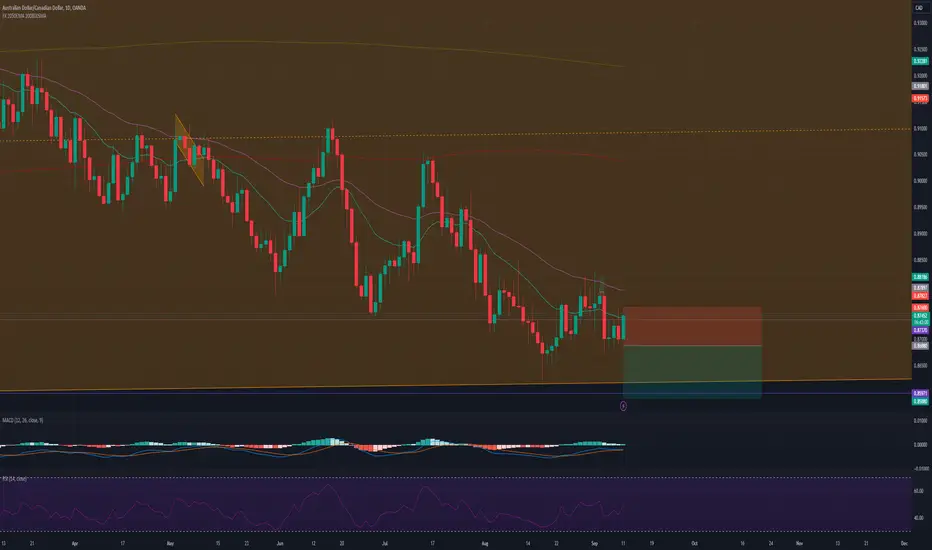
Daily Wave Rider - AUDCAD SELLAUDCAD
Channel: RED
WK Pivot: RED
AOB: WP
CON: SBB
SELL Stop: 0.86740
Stop Loss: 0.87410
TP01: 0.86070
DWR present as a sell setup on 18SEP, with Channel and Pivot are red bouncing off weekly pivot.
However, trade is not taken/considered as it differs from our Market Analysis Bias.
SPX500: BUY
DXY: SELL
OIL: SELL
GOLD: BUY
Reference to our WK38 analysis, we are anticipating a "Risk-On" sentiments thus will BUY AUD/NZD.
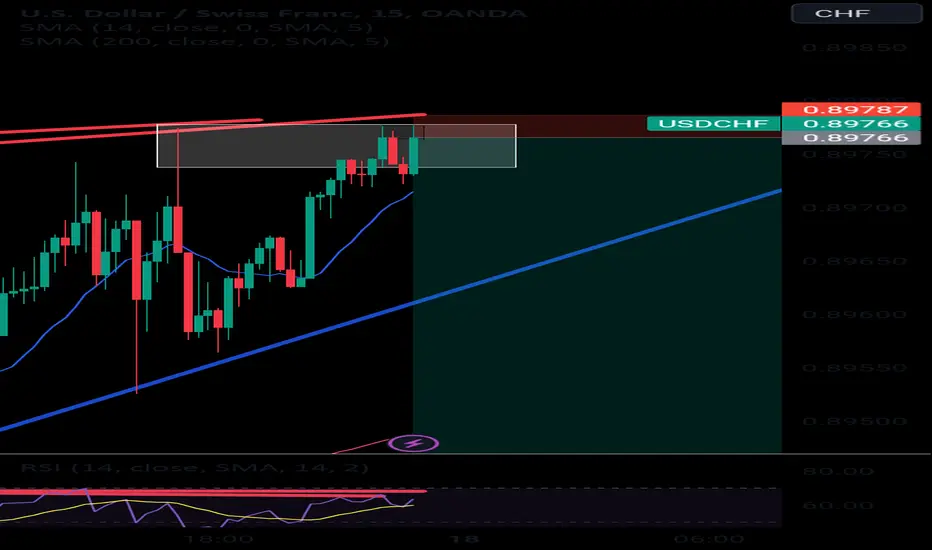
Possible USDCHF ShortThe Swissy is the nearing a resistance around the 0.89939 level that has been tested and proven strong from 17th April 23 to 6th July 23.
The pair is also displaying bearish divergence from the 4 hour to the 5 min chart.
I believe the bears will come into play as soon as Monday pulling the pair down and I intend to be one of those bears with an entry at the open or possibly once the 0.89766 level is breached to the downside . For now we wait to trade what we see.
EURCAD I Potential short idea explainedWelcome back! Let me know your thoughts in the comments!
** EURCAD Analysis - Listen to video!
We recommend that you keep this pair on your watchlist and enter when the entry criteria of your strategy is met.
Please support this idea with a LIKE and COMMENT if you find it useful and Click "Follow" on our profile if you'd like these trade ideas delivered straight to your email in the future.
Thanks for your continued support!

EURNZD SHORThello guys.in 4hr time frame a bearish candle closed under the last low and changed the trend direction/character (CHOCH).
also we have choch in 1hr.and as you we have FVG area in 4hr.
so in pullback we are waiting for confirmation to open sell position.
R:R 1:70
“”your follows and boosts encourage me to publish more analysis””

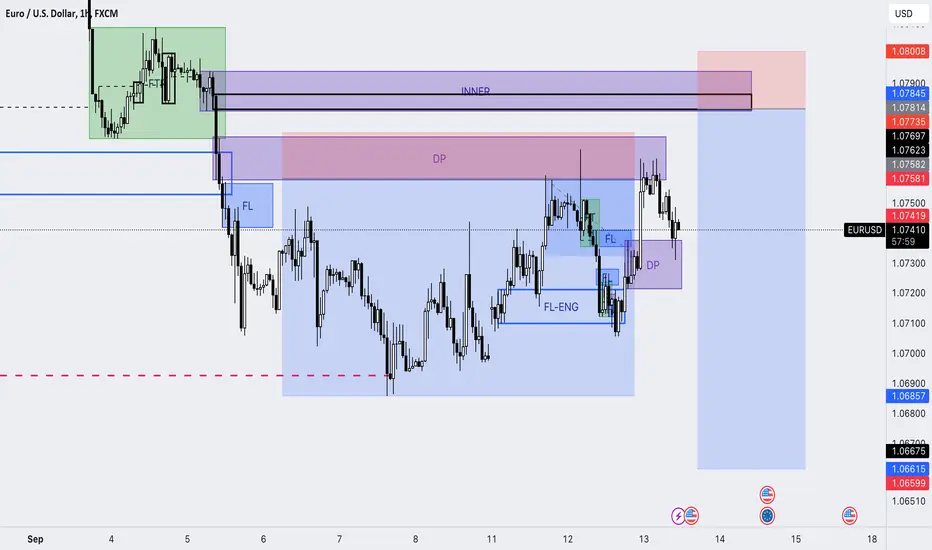
eurusd short setupeurusd has an engulf south the price and this inner fl would be a great supply zone for fake out and then there would be a great bearish trend
cadjpy sella good short setup for CADJPY, there is a good chance for CADJPY to start a bearish trend from here

Risk to Reward Ratio is the key to constant wins at tradingI love writing those articles on my Blog, mainly because I learn from reviewing my trades & secondary for the value it gives back to the trading community.
I been preaching Trading is simple but not easy. It is based on following a winning trade plan. & how do you find such a plan? Try & fail, Try & succeed there is no other way. There is the possibility of a generous soul teaching how a winning strategy & thats what I hope to do in this article. I will share 2 rules
Rule number 1 Always trade the bigger picture.
Find out what the bigger picture chart is doing & trade based on that. In this trade am placing my trade decision in the (W) chart the top chart in white. My bigger picture chart is the monthly (M) not shown. And the chart I use to time my enter & exit is the Day chart (D) below in Black
Rule number 2 Risk to Reward ratio,
This should be rule #1 but I placed it as number 2 to add importance to the rules of trading the bigger picture. Aim for a Risk to Reward ratio of 3 to 5. This means you asses the Risk (how. much money you can loose) before you asses the Reward (how much money you can win).
In this trade, the bigger picture chart (M) is in a downtrend. The trading chart (W) comes into untested Supply Zone (SZ) with a Risk of less than a dollar. I take my SHRT in the red Circle
The reward is 4-5 dollars per share, mostly due to a price free fall zone, with little Demand zone (DZ) to challenge the price. I took profit at two point marked by the red X in the Daily chart.
There are odd enhancers as to why I took this trade, but they are outside the scope of this blog. If you like to learn more about my winning trading strategy that I been practicing for 11 years. Follow my Blog & learn to trade smarter.

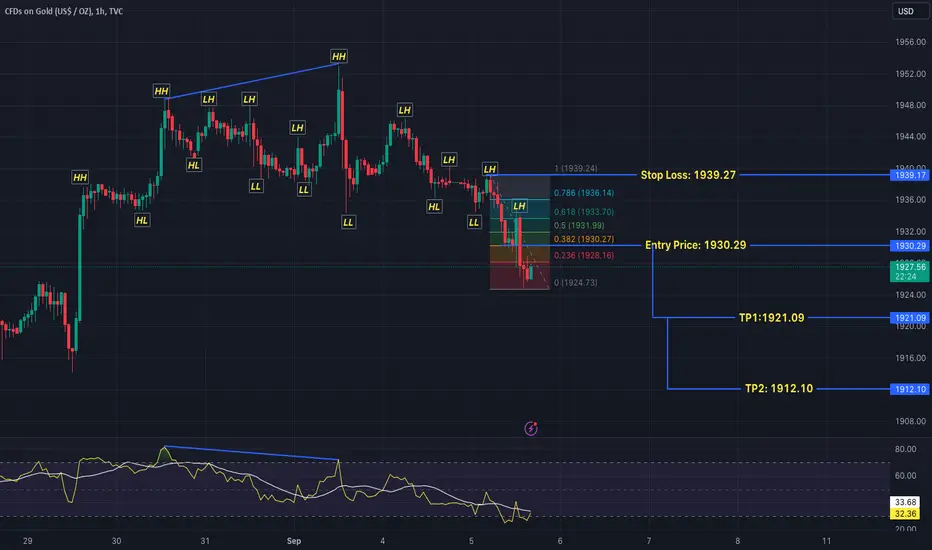
XAUUSD Bearish TrendXAUUSD Bearish Trend showing in 1 hour Chart that there is Bearish Divergence , and the trend reversal from the exact Bearish Point, now to get the Entry Put the FIB Retrc Entry Point is already Defined & TP1 & TP2 Set Accordingly,
Daily Wave Rider - SELL NZDUSDNZDUSD
Channel: RED
WK Pivot: RED
AOB: 10
CON: SBB
SELL Stop: 0.5867
Stop Loss: 0.5921
TP01: 0.5813
TP02: 0.5705
DWR presents as a sell setup on 11SEP, with Channel and Pivot are red bouncing off SMA 10.
However, trade is not taken/considered as it differs from our Market Analysis Bias.
SPX500: Up
DXY: Down
OIL: Up
GOLD: Up
Reference to our WK37 analysis, we are anticipating a "Risk-On" sentiments thus will BUY AUD/NZD.

Daily Wave Rider - SELL NZDCADNZDCAD
Channel: RED
WK Pivot: RED
AOB: WP
CON: SBB
SELL Stop: 0.8022
Stop Loss: 0.8081
TP01: 0.7963
TP02: 0.7845
DWR presents as a sell setup on 11SEP, with Channel and Pivot are red bouncing off weekly pivot.
However, trade is not taken/considered as it differs from our Market Analysis Bias.
SPX500: Up
DXY: Down
OIL: Up
GOLD: Up
Reference to our WK37 analysis, we are anticipating a "Risk-On" sentiments thus will BUY AUD/NZD.

Daily Wave Rider - SELL AUDUSDAUDUSD
Channel: RED
WK Pivot: RED
AOB: WS1
CON: SBB
SELL Stop: 0.6366
Stop Loss: 0.6417
TP01: 0.6315
TP02: 0.6213
DWR presents as a sell setup on 11SEP, with Channel and Pivot are red bouncing off Weekly support 1.
However, trade is not taken/considered as it differs from our Market Analysis Bias.
SPX500: Up
DXY: Down
OIL: Up
GOLD: Up
Reference to our WK37 analysis, we are anticipating a "Risk-On" sentiments thus will BUY AUD/NZD.

Daily Wave Rider - SELL AUDCHFAUDCHF
Channel: RED
WK Pivot: RED
AOB: WP
CON: IB
SELL Stop: 0.5678
Stop Loss: 5711
TP01: 0.55826
TP02: 0.5630
DWR presents as a sell setup on 11SEP, with Channel and Pivot are red bouncing off Weekly pivot.
However, trade is not taken/considered as it differs from our Market Analysis Bias.
SPX500: Up
DXY: Down
OIL: Up
GOLD: Up
Reference to our WK37 analysis, we are anticipating a "Risk-On" sentiments thus will BUY AUD/NZD.
Daily Wave Rider - SELL AUDCADChannel: RED
WK Pivot: RED
AOB: EMA10
CON: SBB
SELL Stop: 0.8688
Stop Loss: 0.8760
TP01: 0.8616
TP02: 0.8588
DWR present as a sell setup on 11SEP, with Channel and Pivot are red bouncing off EMA10.
However, trade is not taken/considered as it differs from our Market Analysis Bias.
SPX500: Up
DXY: Down
OIL: Up
GOLD: Up
Reference to our WK37 analysis, we are anticipating a "Risk-On" sentiments thus will BUY AUD/NZD.
Symmetrical Triangle continuationAUDJPYSymmetrical Triangle continuation Pattern in 1 Hour Chart AUDJPY, its show that might they Break out from this point to Upward Direction, showing bullish Trend. Entry Price & TP1 & TP2 Set Accordingly Stop Loss for Long: 93.939,
For Plan B Entry price is also set for Short Trade might this go from this Point to down ward so we set trade accordingly & Entry Price & Stop Loss for Short Trade is 94.326 also Defined with TP1 & TP2 as well.
Symmetrical Triangle continuation Pattern might take break out both side so we already make plan for the both side trades, once one side trade is active, so cancelled the other side, wait & watch

UNFI/USDT I've shorted and I've sinned... but 💪 😎I've shorted and I've sinned...
but
once bitten, still brave ;)
8.614 is 1:1 Trend-Based Fib Extension
between 3.055 – 5.530 – 4.759 -> 8.614
Gann angle progression of trend from 2:1 towards 3:1.
Stop @ 8.70
Targets = 0.382 and 0.618 Fibs, that is 6.81 and 5.94.

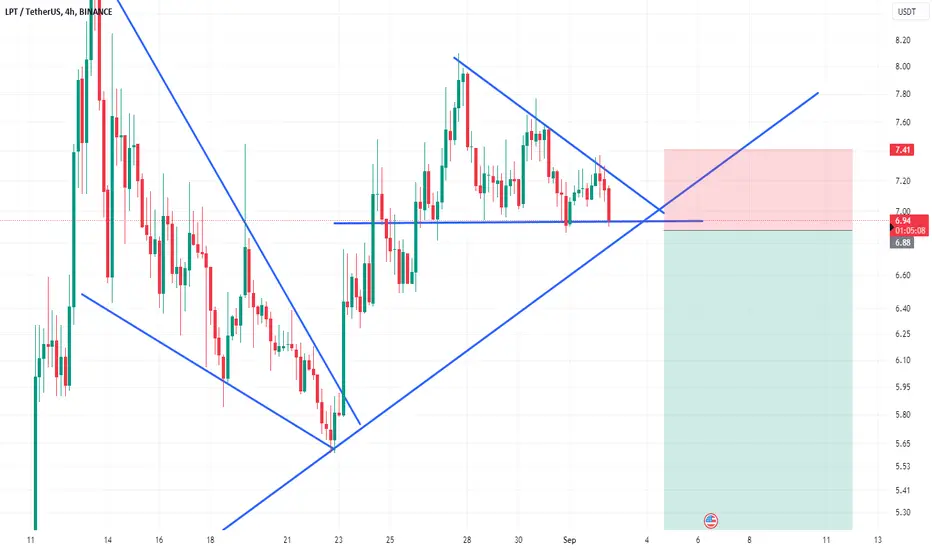
LPT EZ MoneyWe need some money so we must wait for breakout and open it later.
Give me like if you agree ! Eazy money for us !
Good luck my friends
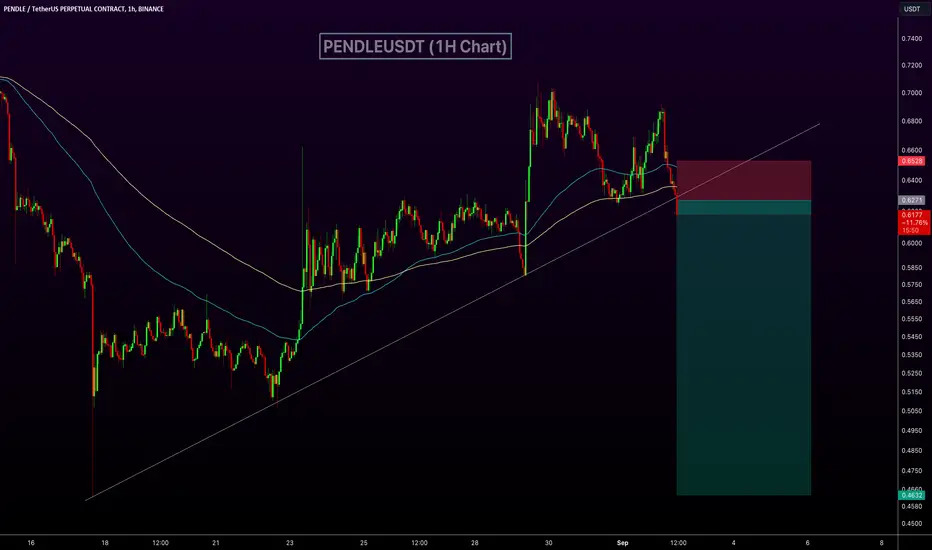
PENDLEUSDT Looks Bearish! PENDLEUSDT Technical analysis update
Short level: $0.625 - $0.629
Stop loss : $0.654
Take Profit 1 : $0.605
Take Profit 2 : $0.560
Take Profit 3 : $0.465
Thanks
Hexa
BCH Targets Hit as PredictedBCH had a very nice run, but when you properly apply divergence indicators and TD counts on the right timeframes... it's not that hard to spot a good short.
