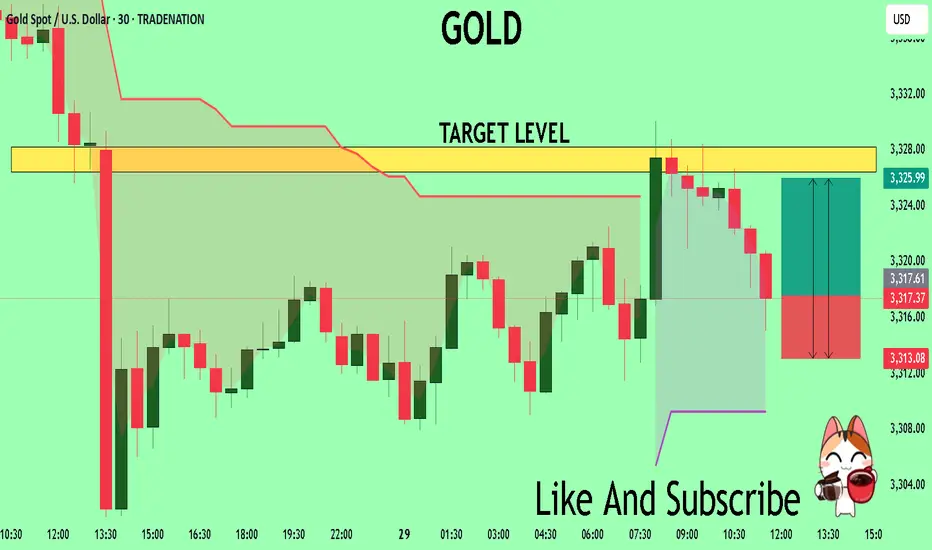
GOLD The Target Is UP! BUY!
My dear subscribers,
This is my opinion on the GOLD next move:
The instrument tests an important psychological level 3317.7
Bias - Bullish
Technical Indicators: Supper Trend gives a precise Bullish signal, while Pivot Point HL predicts price changes and potential reversals in the market.
Target - 3326.4
My Stop Loss - 3313.0
About Used Indicators:
On the subsequent day, trading above the pivot point is thought to indicate ongoing bullish sentiment, while trading below the pivot point indicates bearish sentiment.
Disclosure: I am part of Trade Nation's Influencer program and receive a monthly fee for using their TradingView charts in my analysis.
———————————
WISH YOU ALL LUCK
Signal
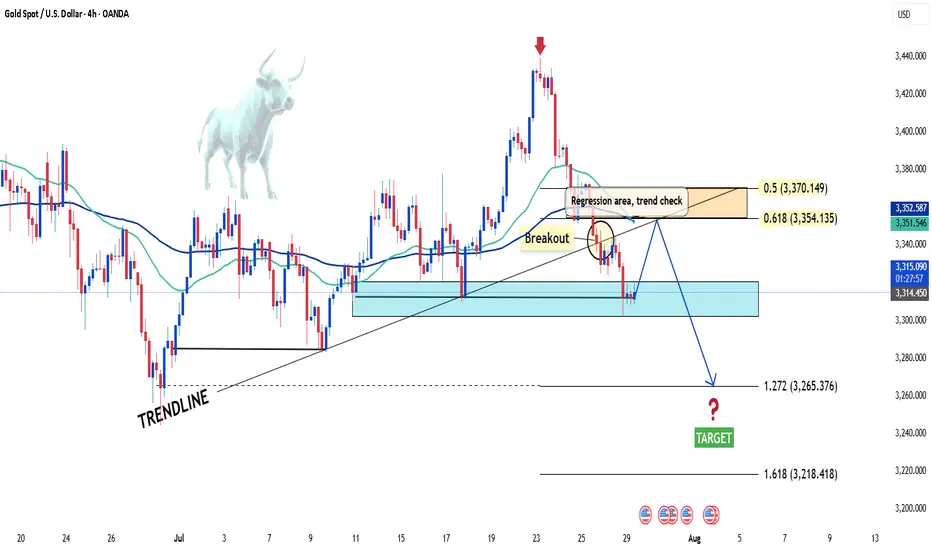
XAUUSD under pressure – Is the downtrend just beginning?Hello everyone! What do you think about XAUUSD right now?
Yesterday, XAUUSD extended its decline and is currently trading around 3,315 USD.
The recent drop in gold prices was mainly triggered by a stronger US dollar, following a trade agreement between the US and the European Union (EU).
From a technical perspective, the short-term outlook shows the beginning of a new downtrend. Notably, we see a bearish crossover in the EMA 34 and 89, along with a break of the previous upward trendline—both reinforcing the current bearish momentum.
If there’s a pullback before the next leg down, the 0.5–0.618 Fibonacci retracement zone (which also aligns with resistance and the EMAs) will be a key area to watch. This could be an ideal level for potential trade setups.
Looking ahead, the next support target is around 3,300 USD. If that level breaks, gold might aim for the 32XX region.
Do you think XAUUSD will continue to fall? Drop your thoughts in the comments!
Wishing you successful and profitable trades!
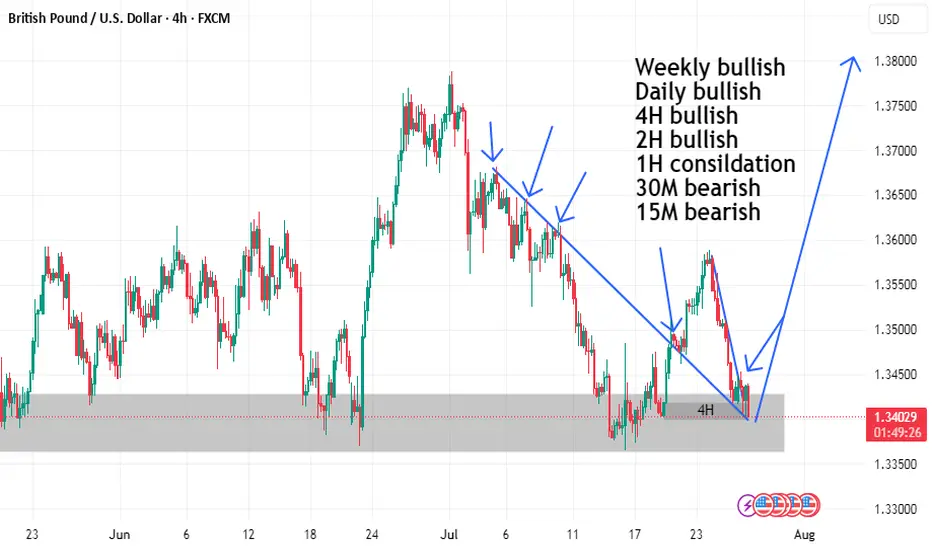
GBPUSD BUY TIGER SETUP LOOOOOOOOOOOONGwelcome
we have strong mitigation order block on time frame weekly and daily
and on 4H we have break downtrend and retest on it
and we in well discount area
and we have demand on high time frame
so this is good idea for buying
Don't forget to follow me
so that get refresh analysis
Bullish Sentiment Returns to Gold?Hello everyone, what are your thoughts on XAUUSD?
From a technical perspective, XAUUSD has just retested its long-term ascending trendline and formed a bullish reaction candle, suggesting that buying pressure may be returning.
Recently, a survey of 206 investors revealed that market sentiment remains optimistic, with 66% expecting gold prices to continue rising, 19% predicting a decline, and 15% anticipating a sideways market.
What do you think? Share your opinion in the comments!

Gold Under Pressure – Temporary Pullback or Start of a DowntrendHello everyone, great to see you again.
Today, let’s focus on the bearish factors surrounding gold. At the time of writing, gold is trading around 3,331 USD, down 50 pips on the day, continuing its downward correction since the end of last week.
Within just a few days, gold has plunged from its peak of 3,433 USD—losing nearly 100 USD per ounce.
This sharp drop is largely driven by profit-taking and market anticipation ahead of key economic data next week, including U.S. interest rate decisions, inflation, and job reports.
This week is packed with critical updates: growth figures, inflation stats, employment numbers, and monetary policy decisions from major central banks—all of which could significantly impact gold’s next move.
According to a recent survey, 36% of analysts expect gold to fall further, while retail investors remain optimistic about a rebound.
For now, the market is clearly in a correction phase. Caution is advised.
What do you think—will gold bounce back or continue to drop?
Perfect Sync: V Reversal Meets Bull Flag
Two clean and classic technical structures:
✅ V-Reversal Formation
✅ Bull Flag – still active and building pressure
After a sharp reversal, the price entered a bullish continuation phase.
Currently moving within the flag structure toward its upper edge.
If we see a breakout to the upside, the move could match the flagpole length, which aligns well with the target from the V-reversal pattern.
📍 Bullish scenario remains valid as long as we stay within structure.
📉 Breakdown below $570 invalidates this setup.
🧠 Important Reminder:
Enter only after a confirmed breakout.
✅ Apply strict risk management
✅ Never risk more than 1% of your capital on a single position.
Everything’s clear. No noise. Just wait for confirmation — let the market come to you.

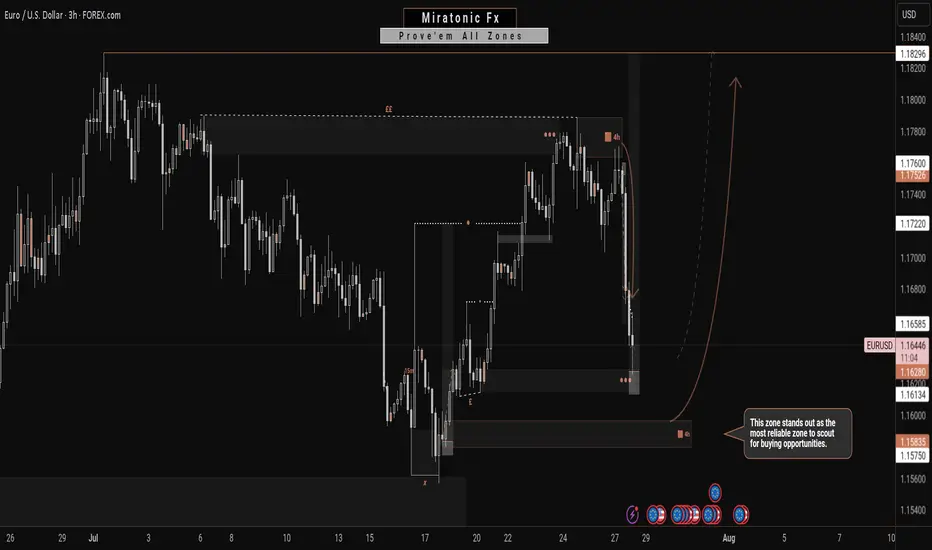
Potentially, A Safer Way To Long The EURUSDIn contrast to my previous outlook, the current price action suggests an increased probability of a deeper bearish move—potentially invalidating the buy zone marked out in the previous analysis. This sudden change is largely driven by the prospect of untapped liquidity residing beneath that zone, reinforcing the well-known market principle that price seeks out liquidity before committing to directional moves.
Given this development, the newly identified zone on the chart emerges as a more technically sound and reliable area from which to anticipate bullish interest. It aligns better with the broader liquidity profile and offers a stronger base for accumulation. Traders may opt to wait for confirmations within this zone or, depending on their risk appetite, consider executing buy positions upon price entry.
As always, patience and clarity are key as we allow price to reveal its intention.
Fingers crossed 🤞
Wishing you all a focused and profitable trading week.
Catch you on the next one. 🫡
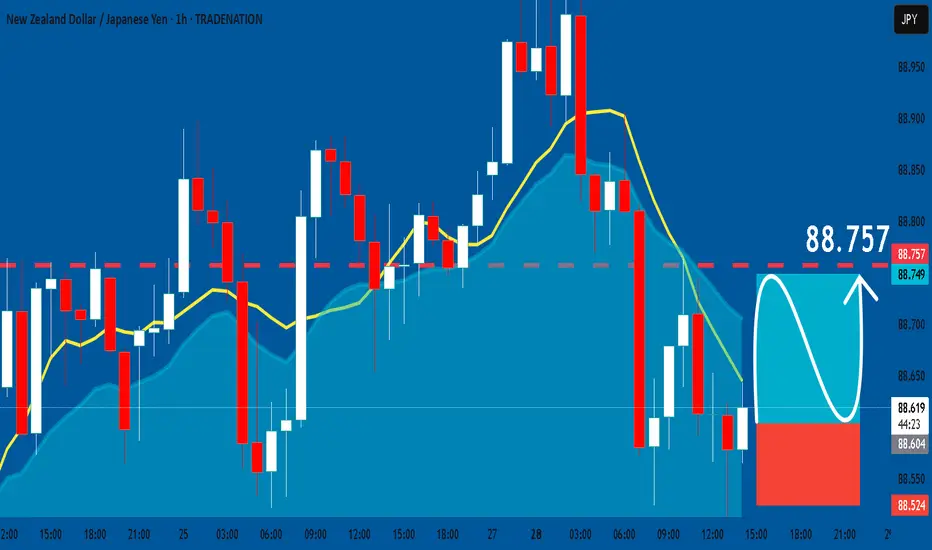
NZDJPY: Free Trading Signal
NZDJPY
- Classic bullish pattern
- Our team expects retracement
SUGGESTED TRADE:
Swing Trade
Buy NZDJPY
Entry - 88.612
Stop - 88.524
Take - 88.757
Our Risk - 1%
Start protection of your profits from lower levels
Disclosure: I am part of Trade Nation's Influencer program and receive a monthly fee for using their TradingView charts in my analysis.
❤️ Please, support our work with like & comment! ❤️
EURJPY Sellers In Panic! BUY!
My dear friends,
Please, find my technical outlook for EURJPY below:
The price is coiling around a solid key level - 172.51
Bias - Bullish
Technical Indicators: Pivot Points Low anticipates a potential price reversal.
Super trend shows a clear buy, giving a perfect indicators' convergence.
Goal - 173.00
Safe Stop Loss - 172.29
About Used Indicators:
The pivot point itself is simply the average of the high, low and closing prices from the previous trading day.
Disclosure: I am part of Trade Nation's Influencer program and receive a monthly fee for using their TradingView charts in my analysis.
———————————
WISH YOU ALL LUCK

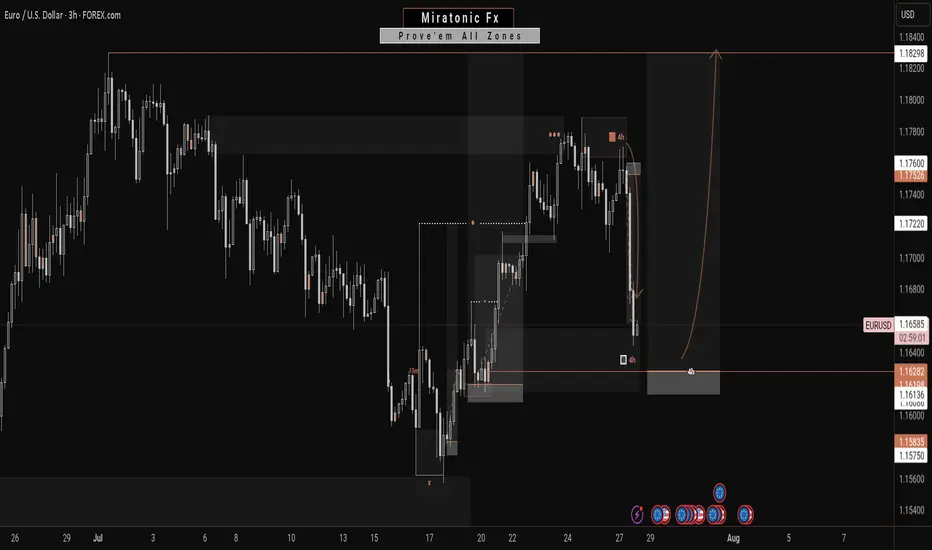
Next Move On EURUSD: A Bullish ContinuationWith this 4H bearish impulsive move, it’s easy to assume a reversal is underway to break the previous daily swing low. However, this appears more like a liquidity grab—fueling the next leg to the upside.
Price has retraced into a key zone that previously performed a strong liquidation. With significant liquidity already swept and clean inducements now resting above, this level becomes crucial.
This zone is the last stand: a break downward may target the daily swing low, while a hold and reaction could propel price toward the swing high.
Fingers crossed 🤞 as we watch price play out.
Have a great trading week, traders.
Catch you in the next one. 🫡
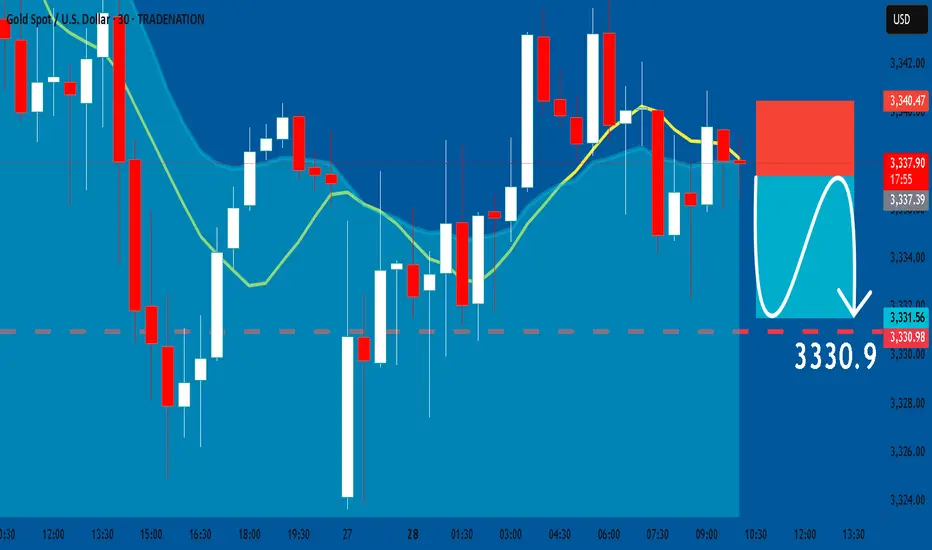
GOLD: Short Trade with Entry/SL/TP
GOLD
- Classic bearish setup
- Our team expects bearish continuation
SUGGESTED TRADE:
Swing Trade
Short GOLD
Entry Point - 3337.3
Stop Loss - 3340.4
Take Profit - 3330.9
Our Risk - 1%
Start protection of your profits from lower levels
Disclosure: I am part of Trade Nation's Influencer program and receive a monthly fee for using their TradingView charts in my analysis.
❤️ Please, support our work with like & comment! ❤️
EURUSD Massive Long! BUY!
My dear friends,
EURUSD looks like it will make a good move, and here are the details:
The market is trading on 1.1665 pivot level.
Bias - Bullish
Technical Indicators: Supper Trend generates a clear long signal while Pivot Point HL is currently determining the overall Bullish trend of the market.
Goal - 1.1728
About Used Indicators:
Pivot points are a great way to identify areas of support and resistance, but they work best when combined with other kinds of technical analysis
Disclosure: I am part of Trade Nation's Influencer program and receive a monthly fee for using their TradingView charts in my analysis.
———————————
WISH YOU ALL LUCK

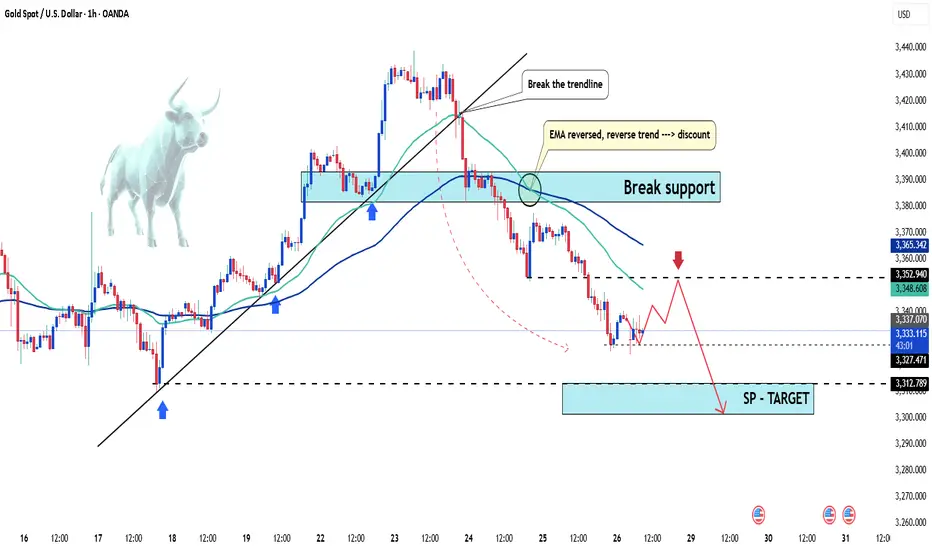
Gold under pressure as USD strengthensGold is facing significant selling pressure as the US dollar regains momentum. Currently, XAU/USD is trading near $3,337, down over $31 from the session high, and pressing directly against the ascending trendline.
The stronger USD is making gold—an asset that yields no interest—less attractive to investors. If this dollar strength continues, the likelihood of a trendline break and further downside is very high.
On the economic front, U.S. jobless claims have fallen to their lowest level in three months, signaling a resilient labor market despite sluggish hiring. This stable jobs data is expected to support the Fed’s decision to hold interest rates steady at 4.25–4.50% in the upcoming policy meeting, even amid rising inflation pressure driven by President Donald Trump’s tariff policies.
At this moment, sellers are in control. Traders should closely watch upcoming support zones and trading volume to spot reasonable entry points.
Good luck!

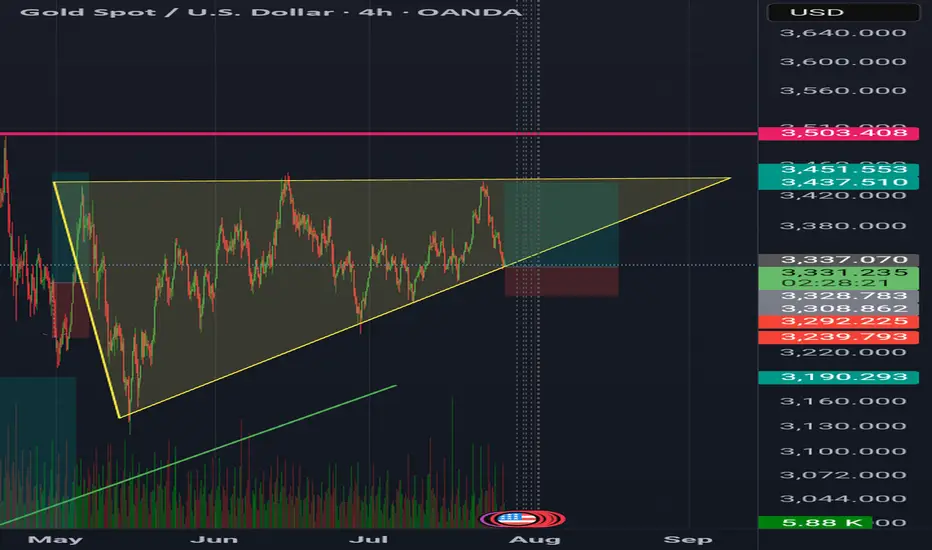
GoldXau usd daily analysis
Time frame 4 hours
Gold is moving up and down in the yellow triangle, you can see on the chart
I think Gold move up to 3450 $ and if we have no positive news, it will drop to the down side. This analysis has good benefit and Risk rewards ratio is 3
On the other hand if Gold break the 3320 $ my analysis is faild and must listen to the economic news

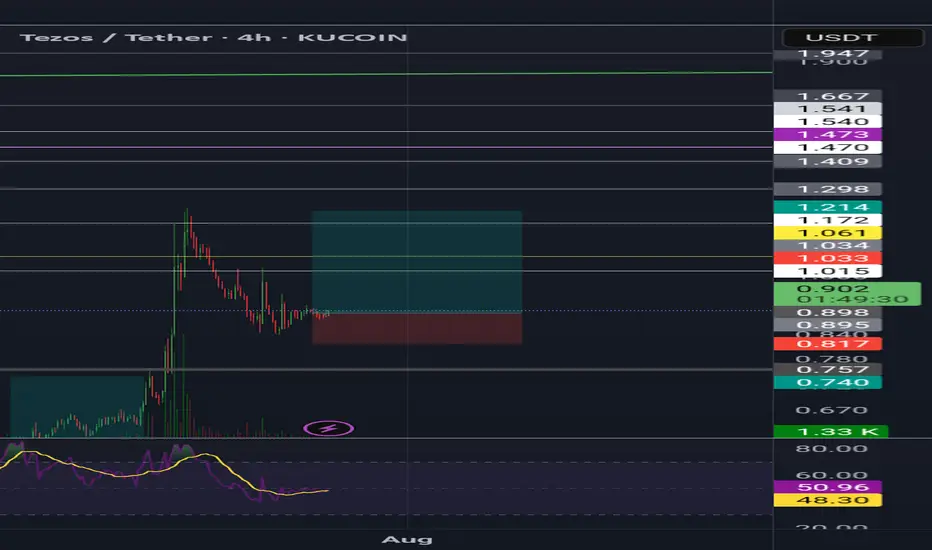
TezosXTZ usdt daily analysis
Time frame 4hourls
Risk rewards ratio >4
Target 1.124$
LS is very tight
If my analysis failed l will lost a few but if it reaches my target good benefit
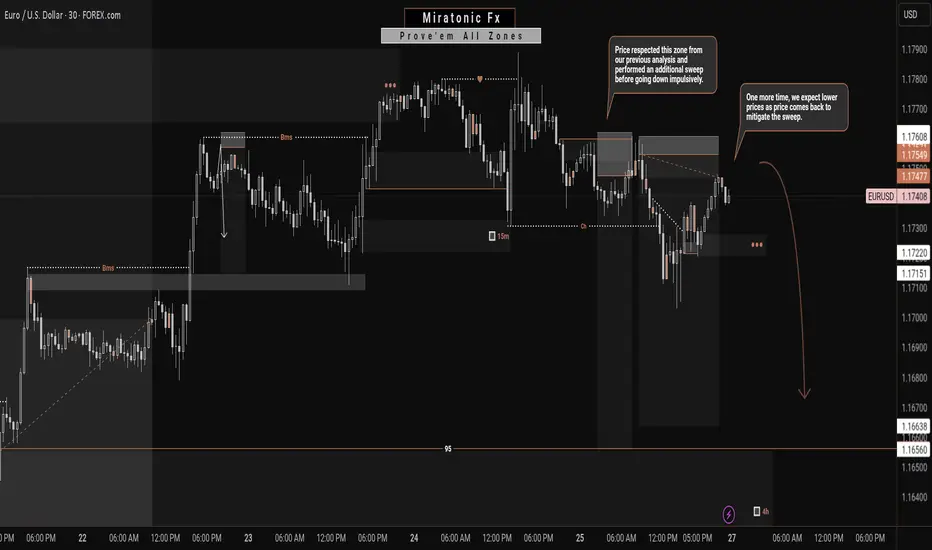
EURUSD: A Bearish Continuation?From my previous analysis, we anticipated a short-term decline on the EURUSD for a Daily bearish pullback. Price respected our zone and made a even stronger sweep before plummeting as forecasted.
Currently, price has returned to mitigate that liquidity sweep. Given the prior impulsive bearish move—which this current bullish correction stems from—we expect another drop, targeting the weak structure below for a potential liquidity grab or continuation.
We'll continue to monitor how price behaves around the current levels, but unless there's a significant shift in momentum, our bearish outlook remains valid. ✅
Follow us for more updates. 🔔
See you on the next one. 🫡
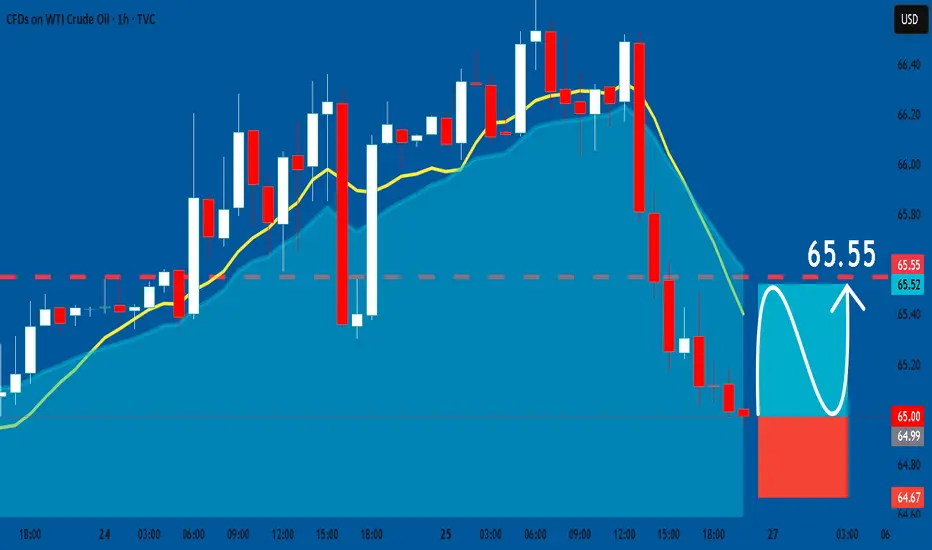
USOIL: Long Trade with Entry/SL/TP
USOIL
- Classic bullish setup
- Our team expects bullish continuation
SUGGESTED TRADE:
Swing Trade
Long USOIL
Entry Point - 65.00
Stop Loss - 64.67
Take Profit - 65.55
Our Risk - 1%
Start protection of your profits from lower levels
Disclosure: I am part of Trade Nation's Influencer program and receive a monthly fee for using their TradingView charts in my analysis.
❤️ Please, support our work with like & comment! ❤️
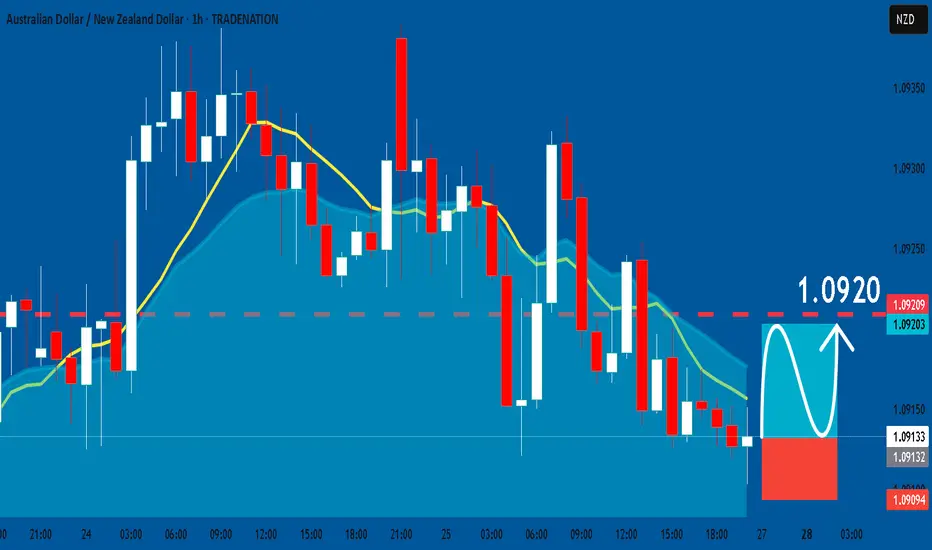
AUDNZD: Bullish Continuation & Long Trade
AUDNZD
- Classic bullish formation
- Our team expects growth
SUGGESTED TRADE:
Swing Trade
Buy AUDNZD
Entry Level - 1.0913
Sl - 1.0909
Tp - 1.0920
Our Risk - 1%
Start protection of your profits from lower levels
Disclosure: I am part of Trade Nation's Influencer program and receive a monthly fee for using their TradingView charts in my analysis.
❤️ Please, support our work with like & comment! ❤️
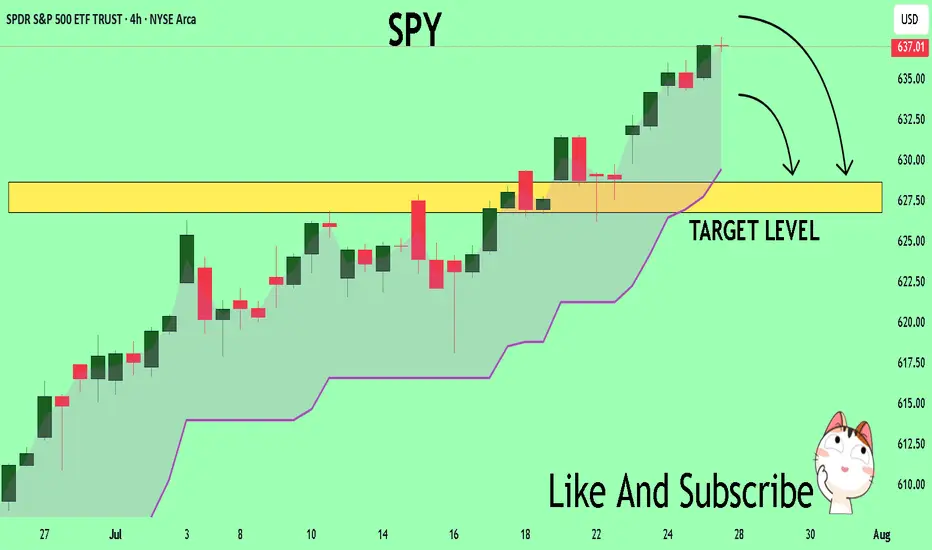
SPY Will Collapse! SELL!
My dear subscribers,
This is my opinion on the SPY next move:
The instrument tests an important psychological level 637.01
Bias - Bearish
Technical Indicators: Supper Trend gives a precise Bearish signal, while Pivot Point HL predicts price changes and potential reversals in the market.
Target - 628.63
About Used Indicators:
On the subsequent day, trading above the pivot point is thought to indicate ongoing bullish sentiment, while trading below the pivot point indicates bearish sentiment.
Disclosure: I am part of Trade Nation's Influencer program and receive a monthly fee for using their TradingView charts in my analysis.
———————————
WISH YOU ALL LUCK
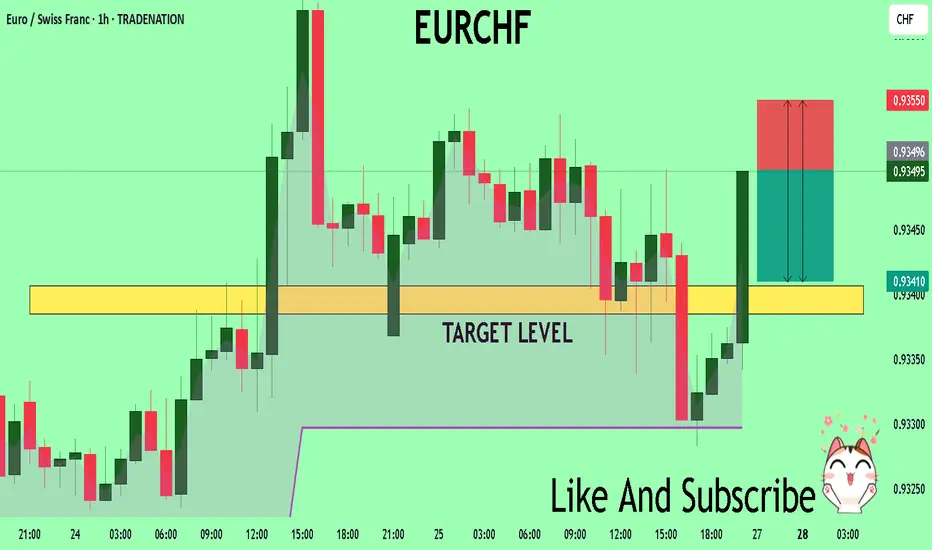
EURCHF Set To Fall! SELL!
My dear friends,
My technical analysis for EURCHF is below:
The market is trading on 0.9349 pivot level.
Bias - Bearish
Technical Indicators: Both Super Trend & Pivot HL indicate a highly probable Bearish continuation.
Target - 0.9340
Recommended Stop Loss - 0.9355
About Used Indicators:
A pivot point is a technical analysis indicator, or calculations, used to determine the overall trend of the market over different time frames.
Disclosure: I am part of Trade Nation's Influencer program and receive a monthly fee for using their TradingView charts in my analysis.
———————————
WISH YOU ALL LUCK
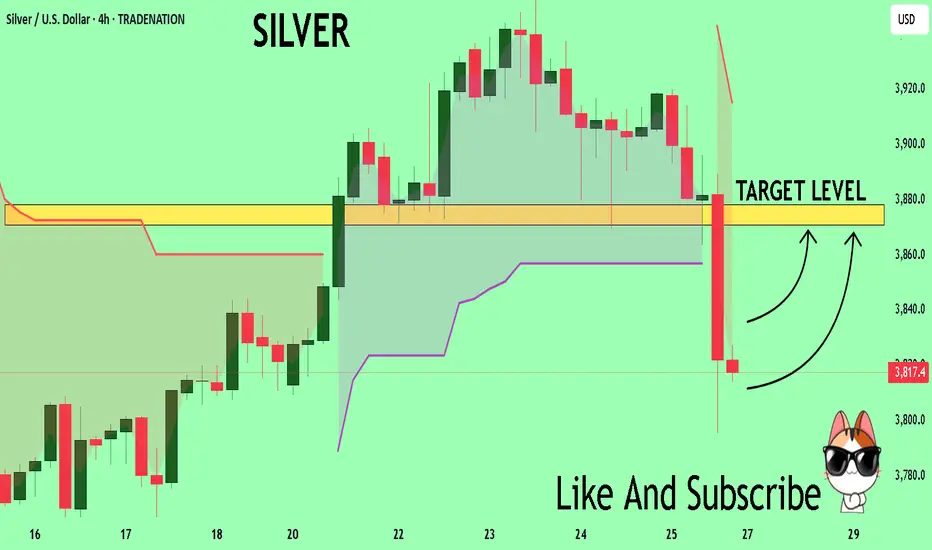
SILVER Trading Opportunity! BUY!
My dear friends,
Please, find my technical outlook for SILVER below:
The price is coiling around a solid key level - 38.174
Bias - Bearish
Technical Indicators: Pivot Points High anticipates a potential price reversal.
Super trend shows a clear sell, giving a perfect indicators' convergence.
Goal - 38.708
About Used Indicators:
The pivot point itself is simply the average of the high, low and closing prices from the previous trading day.
Disclosure: I am part of Trade Nation's Influencer program and receive a monthly fee for using their TradingView charts in my analysis.
———————————
WISH YOU ALL LUCK
EURCAD The Target Is DOWN! SELL!
My dear subscribers,
EURCAD looks like it will make a good move, and here are the details:
The market is trading on 1.6089 pivot level.
Bias - Bearish
My Stop Loss - 1.6104
Technical Indicators: Both Super Trend & Pivot HL indicate a highly probable Bearish continuation.
Target - 1.6061
About Used Indicators:
The average true range (ATR) plays an important role in 'Supertrend' as the indicator uses ATR to calculate its value. The ATR indicator signals the degree of price volatility.
Disclosure: I am part of Trade Nation's Influencer program and receive a monthly fee for using their TradingView charts in my analysis.
———————————
WISH YOU ALL LUCK
