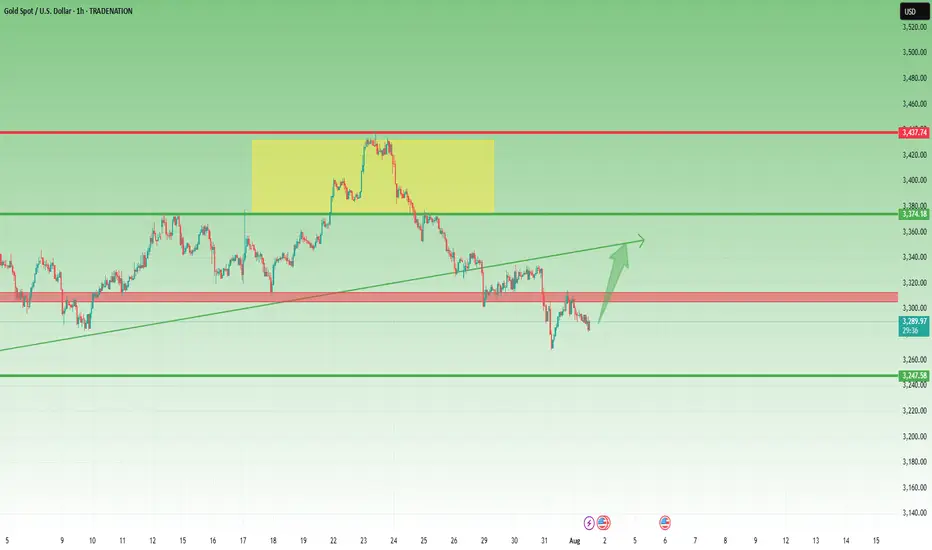
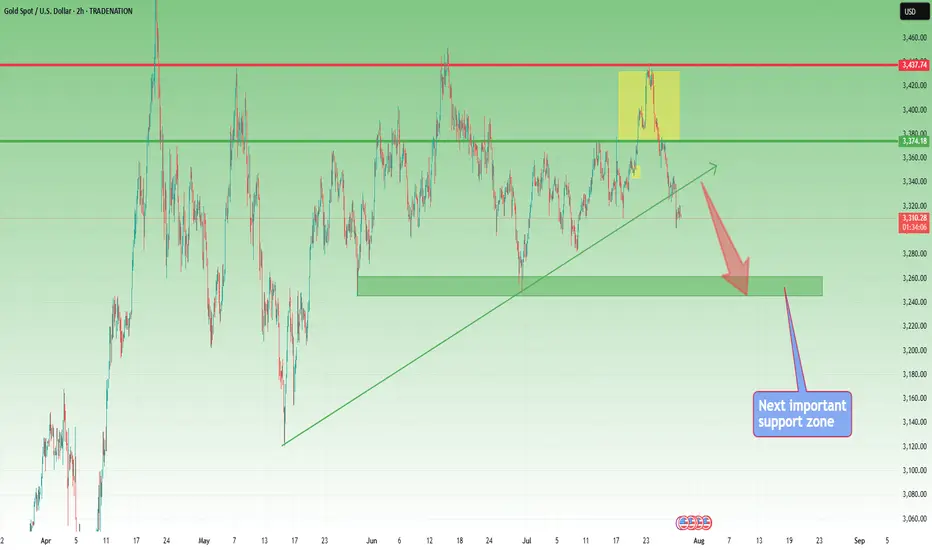
Gold Rejected at 3315 – But Bulls Might Not Be Done Yet📌 What happened yesterday?
During the Asian session, Gold printed a fresh local low at 3268, continuing the downtrend that already dropped over 1700 pips in just one week. However, that move quickly reversed, and we saw a natural corrective bounce.
📈 Resistance holds firm
The correction took price back up into the 3310 zone, which acted as confluence resistance. After two taps into that area, price failed to sustain above 3300, indicating sellers are still active there.
❓ Is the upside correction over?
I don't think so. The recent drop has been choppy, lacking the strong momentum of previous legs. This type of price action often signals that we are still within a correction, not in a clean continuation.
📊 What am I watching?
I’m actively monitoring for:
• Exhaustion signs on the downside
• Upside reversal signals
My plan is to open long trades only when I see confirmation, aiming for a move back toward the 3330 zone, which could act as resistance.
Disclosure: I am part of TradeNation's Influencer program and receive a monthly fee for using their TradingView charts in my analyses and educational articles.
Signalprovider
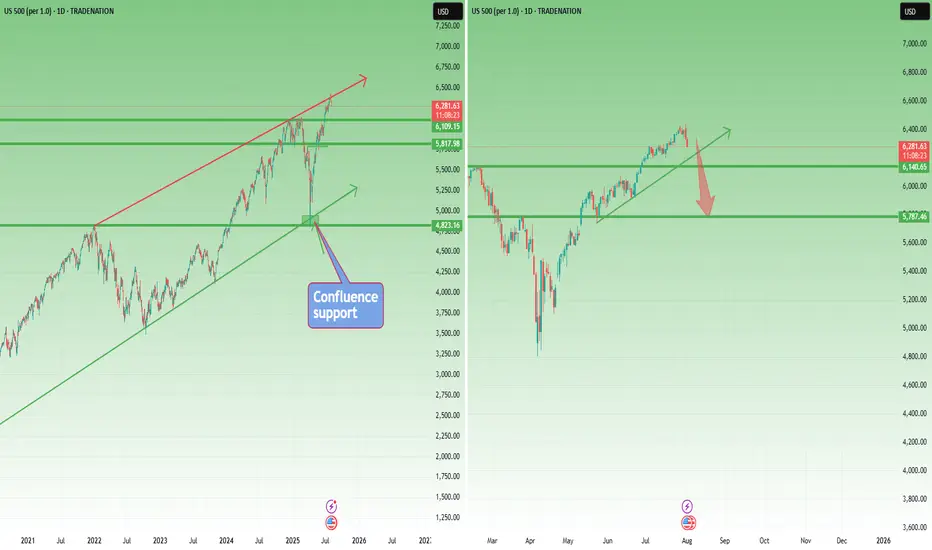
Correction Ahead? SP500 Prints Reversal Signal at Key Resistance📘 This market moves like a textbook chart
SP500 is acting like a perfect case study from a trading manual. Back in early April, the index dipped just below 5,000, right into a confluence support zone ( I had spoken about this at the time ) – formed by the long-term ascending trendline and the 2022 all-time high. Just like other U.S. indices, the market reversed aggressively from that area.
🚀 A 30% rally in 4 months
From that low, SP500 rallied around 30% in just four months. An incredible move that brought the index straight to the upper boundary of the yearly rising channel.
🕯️ Bearish signal at the top
And just like in NAS100’s case , the index printed a strong Bearish Engulfing candle exactly at that resistance level. This kind of signal, after such a rise, shouldn’t be ignored.
📉 A correction is not only probable – it’s needed
A pullback from here is not just likely, but in my opinion, healthy and necessary . Short-term speculators could look for a move toward the 6,150 zone, which would already offer decent room for profit.
🔍 What if it goes deeper?
I wouldn’t be surprised to see a correction down to 5,750–5,800. That’s about a 10% decline, which wouldn't even classify as a bear market, just a normal reset after a euphoric rally.
🧠 Perspective matters
In a market that gained 30% in four months, a 10% correction is not a crash — it’s discipline being restored.
Disclosure: I am part of TradeNation's Influencer program and receive a monthly fee for using their TradingView charts in my analyses and educational articles.
Top in Place? NASDAQ100 Signals Exhaustion After Incredible Run📈 The crazy run since April
NASDAQ100 has had a spectacular run since early April, when the index dipped to 16,300 amid rising tensions caused by Trump’s tax war. From that low, we’ve seen a mind-blowing rally of over 7,000 points, which translates to a 40% gain in just 4 months.
Such a rise is not just impressive— it’s overextended , especially by historical standards. Markets don’t move in straight lines forever, and this one might be showing signs of fatigue.
🕯️ Bearish signal at the top
Fast forward to this week: yesterday, the index marked a new all-time high at 23,700, but closed the day with a strong bearish engulfing candle — one that wipes out the gains of the previous 4 trading sessions.
This is not a small technical detail. Such candles, when appearing after an extended rally, often signal exhaustion and a potential shift in momentum.
❗ Top in place?
In my opinion, there's a high probability that a top has been set, at least temporarily. We might be looking at the beginning of a healthy correction, or even something more meaningful, depending on follow-through in the next sessions.
📉 Where to next?
The first major support to watch is the 22,200 level.
I expect that zone to be tested soon — and honestly, considering how much the index has gone up, this shouldn’t surprise anyone. It’s nothing more than a minor pullback, all things considered.
🧠 Stay smart!
When markets go vertical, it pays to stay disciplined and realistic. Tops rarely announce themselves, but when signals like this appear, it’s wise to listen.
Disclosure: I am part of TradeNation's Influencer program and receive a monthly fee for using their TradingView charts in my analyses and educational articles.

XAUUSD Update – Down Continuation to 3250?1. What Happened Yesterday
After an anemic correction that formed a bearish flag, Gold finally broke below 3300 and even dipped under the 3280 support zone — which was my primary downside target. While the move during the day didn’t have enough momentum to reach my second sell limit, I was already in a low-volume short position, so I didn’t miss the move entirely.
2. The Key Question
Has the drop ended, or are we looking at further downside?
3. Why I Expect More Downside
• The overall structure remains bearish.
• The newly formed resistance (previous support) is now the new sell zone.
• If the price drops towards 3280 again, continuation to 3250 becomes very probable.
4. Trading Plan
Selling rallies remains the preferred strategy, especially on spikes into resistance. As long as the price stays below 3335-3340 zone, the bearish outlook remains intact.
5. Conclusion
Sell the rallies. The technical picture still favors downside continuation — no need to overcomplicate it. 🚀
Disclosure: I am part of TradeNation's Influencer program and receive a monthly fee for using their TradingView charts in my analyses and educational articles.
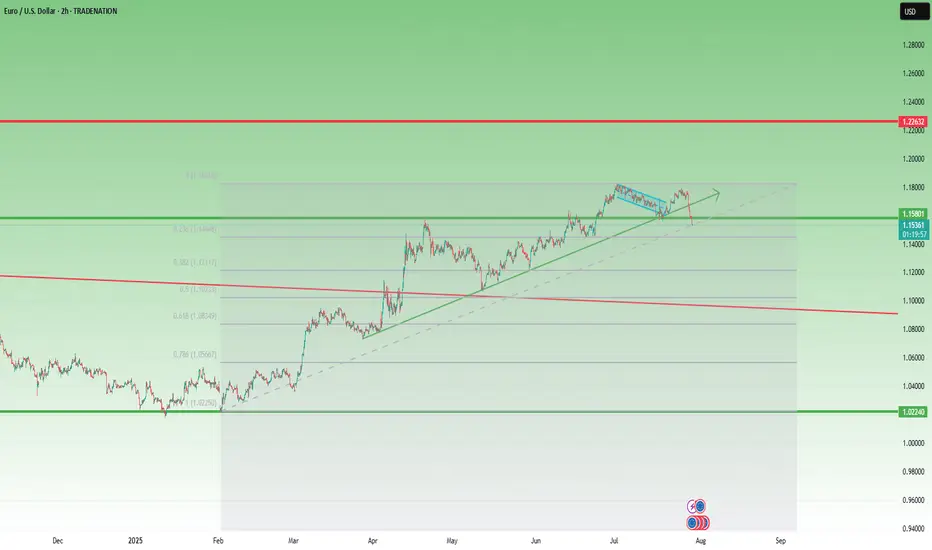
Closed Longs, Now Selling Rallies on EURUSD ReversalAs mentioned in my previous posts, I’m been bullish on EURUSD in the medium term, targeting 1.20 and even beyond.
But no pair—especially not EURUSD, which tends to move more steadily and rationally—goes up in a straight line.
________________________________________
🔹 Last week, the pair stalled just below 1.18, and I decided to close my long trade with a +150 pip gain. That proved to be a wise call, as price dropped hard shortly after.
________________________________________
📉 What’s happening now?
• EURUSD has broken below the rising trendline
• More importantly, it’s broken below the neckline of a double top pattern
• Now trading around 1.1535
This opens the door for a deeper correction, and I expect we could see a test of the 1.1150–1.1100 zone by the end of summer.
________________________________________
📌 Trading Plan:
• I’m now in sell-the-rally mode
• Ideal short entry: around 1.1650, where we also get a favorable 1:3+ risk-reward
• Watch also for interim support around 1.1400
________________________________________
Conclusion:
The bigger picture remains bullish— but this correction looks healthy and isn’t done yet.
Selling rallies makes more sense now, until the structure tells us otherwise.
Disclosure: I am part of TradeNation's Influencer program and receive a monthly fee for using their TradingView charts in my analyses and educational articles.
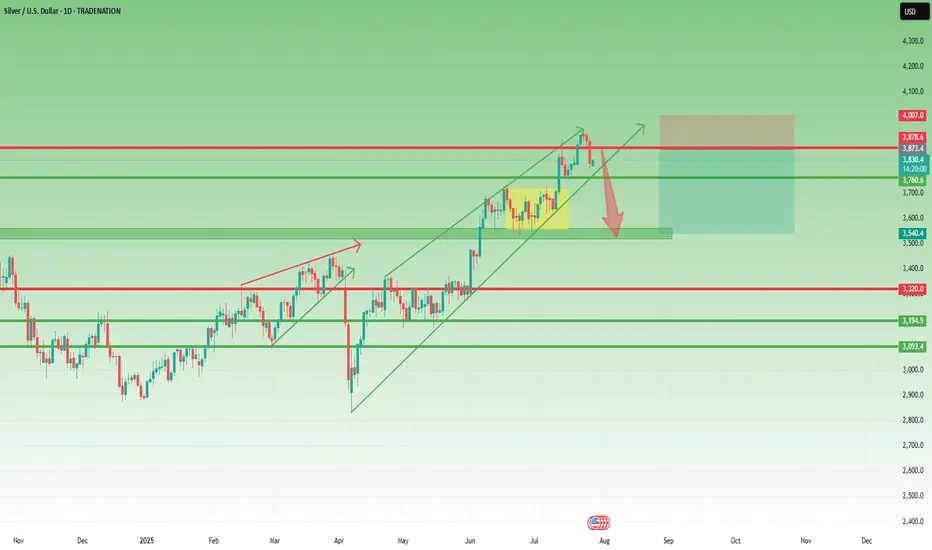
XAGUSD – Reversal Signs After the Run Toward $40Lately, I’ve been a strong advocate for a Silver rally toward $40, and indeed, we got a solid move, with price reaching as high as $39.50, not touching 40 though...
Just like with Gold, the last 3 days of last week turned bearish, and now it looks like we may be entering the early stage of a correction.
📉 Current Setup:
- The rejection from $39.50, right below the psychological $40 level, is significant
- I’ll be monitoring for a possible short entry if we get a rebound into the $38.80–$39.00 zone
- A new high above $39.50 would invalidate this setup
📌 On the downside, if price breaks below the confluence support at $37.70–$38.00, that would confirm the reversal and could lead to an acceleration toward $35.50 support
Conclusion:
The bullish narrative on Silver is pausing here. Until a new high is made, I’m looking to sell the bounce and follow the momentum if the breakdown under support is confirmed.
Let’s see how this plays out this week. 🧭
Disclosure: I am part of TradeNation's Influencer program and receive a monthly fee for using their TradingView charts in my analyses and educational articles.
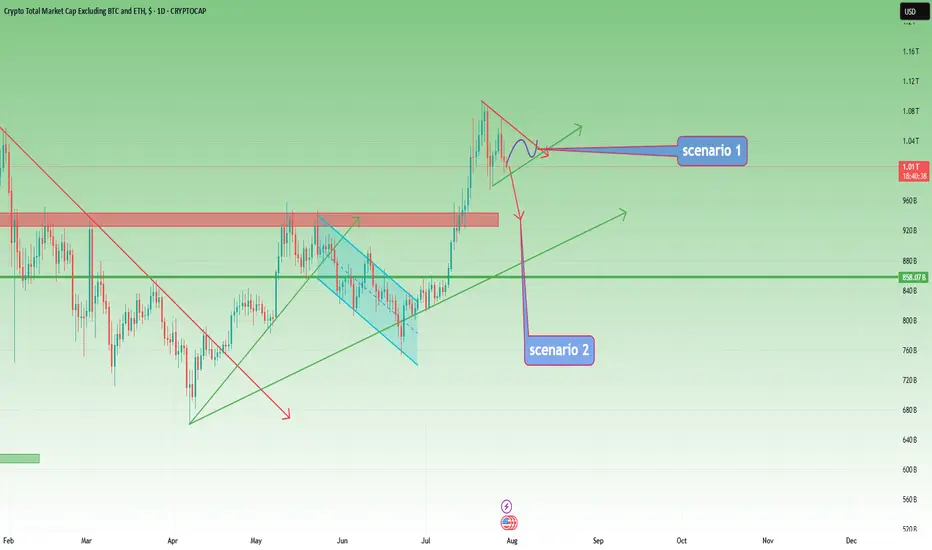
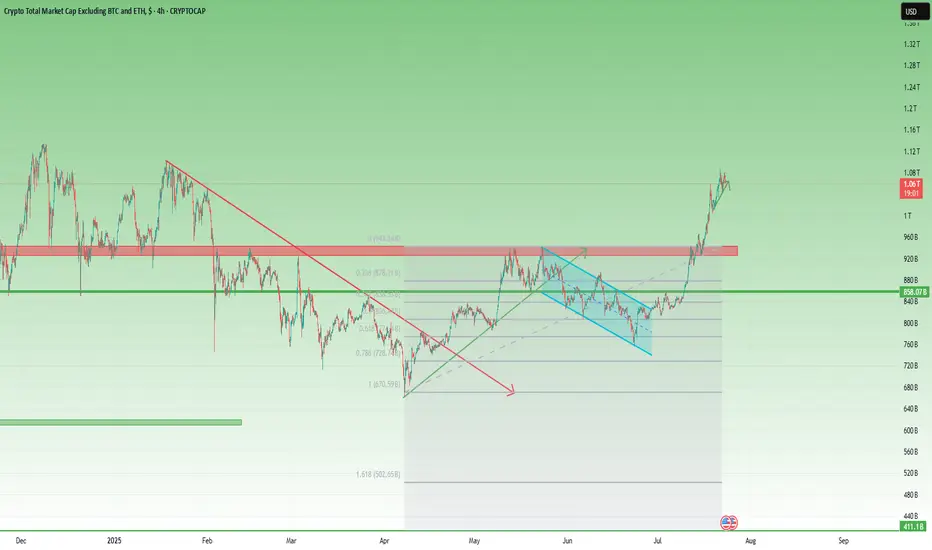
TOTAL3 – Still Bullish, But Waiting for Clarity
In my previous analysis on TOTAL3, I mentioned the high probability of a correction, but also noted that I didn’t expect the 925–940B zone to be reached.
And indeed, price reversed early — finding support around 975B before moving higher.
However, after a push up to 1.07T, the market has started to pull back again.
📊 Current Outlook – Two Scenarios I’m Watching:
Bullish Triangle:
Price may continue to consolidate into a symmetrical triangle, then resume the uptrend from there.
Deeper Pullback into Support:
The market could retest the 925–940B zone, a key support area, before bouncing back up.
⚠️ Bearish Reassessment?
Of course, if price breaks back below 925B and stays there, we’ll have to reconsider the bullish case.
But for now, the trend remains intact, and there’s no technical reason to panic.
📌 My Plan:
I already hold a bag of alts, and I’m not adding for now.
I’ll wait until the pattern becomes clearer — whether it’s a triangle breakout or a dip into support.
Until then, I’m sitting comfortably on what I already hold.
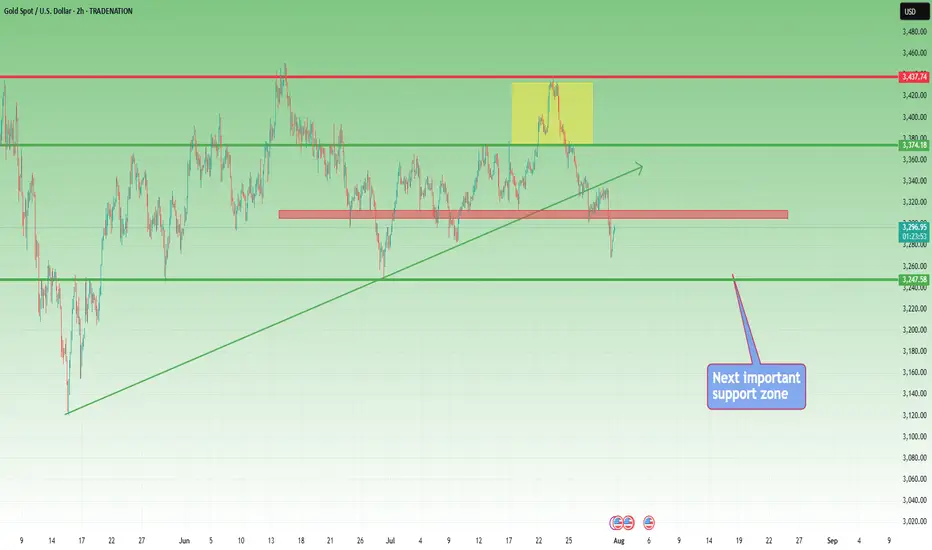
XAUUSD – Weak Rebound, Bearish Bias RemainsYesterday was a quiet and choppy day for Gold.
Although price managed to recover a small portion of last week’s 1400 pip drop, the rebound remains anemic — price barely reached the 23% Fibonacci retracement.
To make things worse for the bulls, the recovery from around $3300 is starting to take the shape of a bearish flag, a continuation pattern that typically signals further downside ahead.
📌 Resistance Zones to Watch:
- Initial resistance: $3345–3350
- Stronger resistance: $3370, a level already proven and well-defined
As long as the price is under those levels, I remain firmly bearish.
📈 Trading Plan:
I already have a short position open, and I'm still waiting to add more, preferably on a push into higher resistance, ideally above $3345.
No need to force entries — I’d rather scale in on strength, not weakness.
Once the correction is complete, I’m targeting:
- $3280 as the first support
- $3250 as a realistic downside objective
Conclusion:
The rebound lacks power. The structure favors the bears.
Still watching for better entries to add short, with eyes on 3280 and 3250 as likely targets.
Let’s stay patient and let the setup come to us. 🎯
Disclosure: I am part of TradeNation's Influencer program and receive a monthly fee for using their TradingView charts in my analyses and educational articles.

EURNZD Update: This short trigger could spark a waterfall dropYo traders, Skeptic from Skeptic Lab! 🩵 EURNZD just broke its daily upward trendline, setting up a sharp drop. Weekly shows a fading uptrend. Daily’s got a strong bearish candle, full body, no buyer fight. 4H trendline broke and... more on this video:)
👀Beware of fakeouts this week—volatility’s high! Trade smart, keep risk tight, and don’t FOMO. Share your thoughts in the comments, boost if it helps <3

XAUUSD – Bears in Control, but Watch for a Rebound FirstYesterday, after a small bounce from the ascending trendline, Gold broke down and printed an intraday low around $3300.
Right now, the market appears bear-dominated, and further downside continuation is likely in the coming days.
________________________________________
📉 But there’s a catch:
From last week's top, Gold has dropped over 1400 pips without any meaningful correction.
That opens the door for a possible short-term rebound, which could be just a setup for new short entries.
________________________________________
📌 Key levels to watch:
• First resistance: $3350
• Major resistance: $3375 – Only a daily close above this level would shift control back to the bulls
🎯 Until then, any bounce is an opportunity to sell into strength.
A break below $3300 opens the path to $3280, with a likely extension toward $3250.
________________________________________
Conclusion:
The trend is bearish, but don’t chase.
Wait for a corrective rally, then look to sell the rip—unless bulls reclaim $3375, it’s still a bear market.
Let’s see if Gold gives us the setup. 🎯
Disclosure: I am part of TradeNation's Influencer program and receive a monthly fee for using their TradingView charts in my analyses and educational articles.
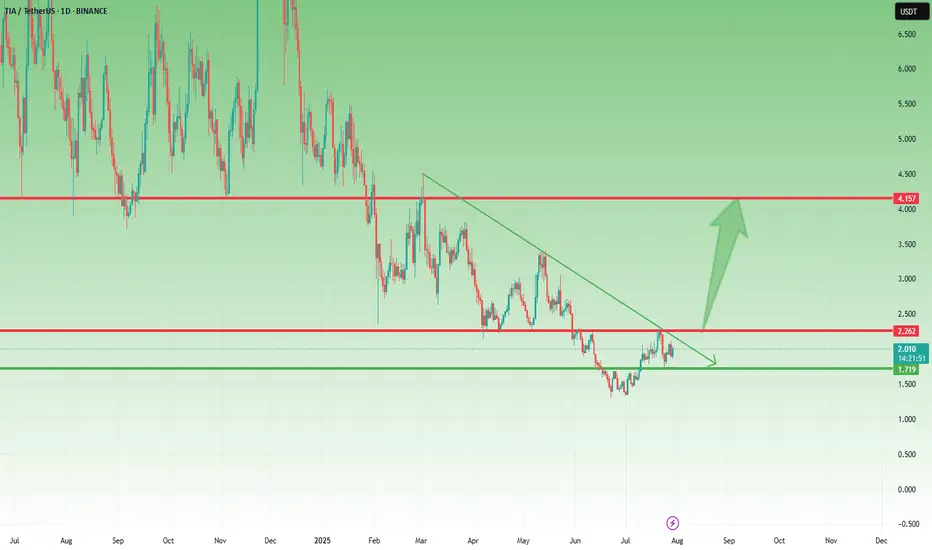
TIA Holding Support – Break Above $2.20 Could Trigger Big MoveLast week, I mentioned that TIA could be preparing for a move and that buying dips around $1.75 might be a good opportunity.
Well, price dropped exactly into that support zone, bounced slightly, and is now consolidating, which could be the calm before the next wave.
________________________________________
📌 Here’s what I’m watching:
• The $2.10–$2.20 zone is now a confluence resistance area (horizontal + descending pressure)
• A break and daily close above this level could trigger a strong leg up, with the next major target around $4.00
________________________________________
📈 Bias remains bullish
As long as $1.70 holds, this setup stays valid, and dips continue to be buyable.
________________________________________
🎯 Trading Plan:
• Looking to buy dips toward $1.80–1.85
• Acceleration expected only above $2.20
• Bearish invalidation only below $1.70
________________________________________
Conclusion:
TIA is respecting structure perfectly. If it breaks above $2.20, we could be looking at a potential double in price toward $4.
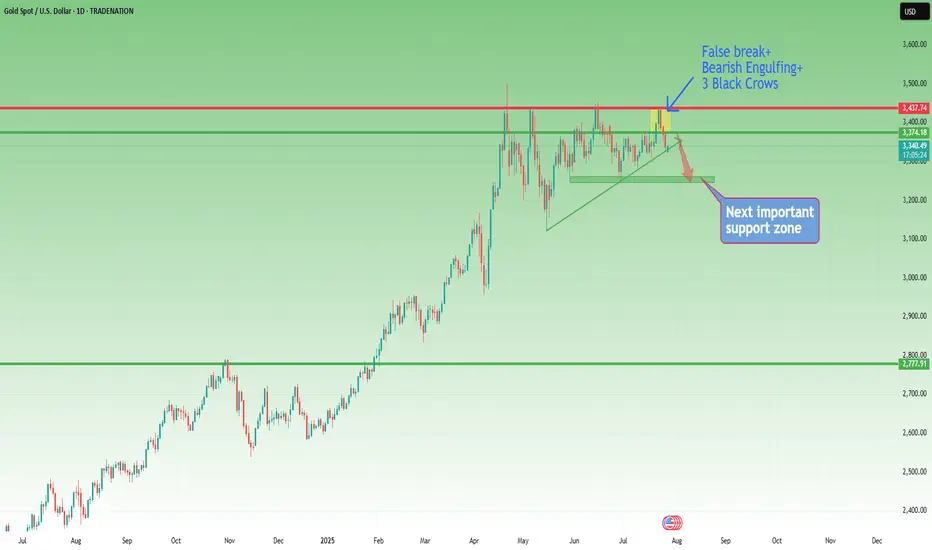
Gold Breakout Failed – Bearish Reversal in Play?Last week was both interesting and revealing for Gold.
After breaking above the key $3375 resistance—which also marked the upper boundary of a large triangle—price quickly accelerated higher, reaching the $3440 resistance zone.
However, instead of a bullish continuation, we witnessed a false breakout and sharp reversal. What initially looked like a healthy pullback turned into a full bearish rejection by week’s end.
________________________________________
📉 Current Technical Picture:
• On the daily chart, we now see a clear Three Black Crows formation
• On the weekly chart, a strong bearish Pin Bar confirms rejection
• And if we add the failed breakout above 3375, the bias tilts decisively bearish
________________________________________
📌 Key Zones and Trading Plan:
• Gold is currently bouncing from the ascending trendline zone, which is natural after dropping more than 1,000 pips in just 3 days
• The $3375–3380 area has regained importance as a key resistance zone, and that’s where I’ll be looking to sell rallies
• A bullish invalidation would only come if price manages to stabilize above $3400
Until then, this remains a bear-dominated market, and a drop below $3300 is on the table.
________________________________________
🧭 Support levels to watch:
• First support: $3280
• Major support: $3250 zone
________________________________________
📉 Conclusion:
The failed breakout, bearish candle formations, and current price structure all point to a market that's shifting in favor of sellers.
I’m looking to sell spikes into resistance, with a clear invalidation above $3400.
Disclosure: I am part of TradeNation's Influencer program and receive a monthly fee for using their TradingView charts in my analyses and educational articles.
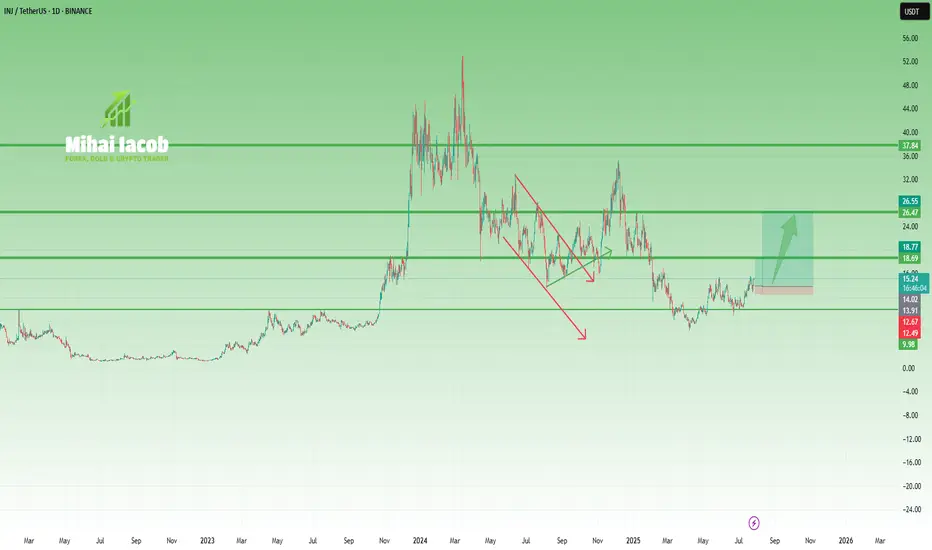
INJ – From Overhyped to Reasonable OpportunityA year and a half ago, INJ was in full hype mode, with fantasmagorical predictions of $200+, even though the coin had already done a 40x move.
(And not to brag—but at that moment, with INJ trading around $40, I said that $10 was far more likely than $200. It actually dropped to $6.5...)
Fast forward to today, and things are starting to look more constructive—at least, if you're not aiming for the moon:
🔹 After the local low at $6.5, price formed a small inverted Head & Shoulders
🔹 Then it confirmed new support at $10, a key psychological level and neckline zone
🔹 Now it's pressing into the $15.5 resistance
From my perspective, the setup is starting to favor the bulls.
If we get a clean breakout above $15.5, the next resistance is around $20, but I wouldn’t be surprised to see a push to $25–26, or even slightly above $30, if momentum builds.
📌 Not a hype call.
It’s a realistic technical setup, built on structure—not dreams.
SEI Breakout Setup: Buy the Dip Before the Next Leg UpAfter the low around 0.13 in April, SEI started to recover, and although the first attempt to reclaim the 0.25–0.26 zone failed in mid-May, that key area—a former support from last year—was finally broken at the end of June.
Now, this previous resistance has turned into support, and even though gains have so far been capped by the falling trendline, price is consolidating above support – which could be a sign of bullish pressure building.
If we get a clean break above this descending trendline, momentum could accelerate, opening the way for a push toward the 0.75 resistance.
This is exactly the scenario I’m working with.
I'm looking to buy dips, with an ideal entry around 0.30, while keeping in mind that a move below 0.25 would invalidate the setup.
✅ Risk-reward? With a stop below 0.25, this setup offers a 1:4 R:R, and even a realistic chance at a 2x trade, which would be quite reasonable under current market conditions.

XAUUSD – The Structure Is Still Bullish... But Barely Holding 📌 In yesterday’s analysis, I mentioned that although Gold corrected deeper than expected, dropping below 3400, the bullish structure remained intact — and I stayed true to that view by buying dips.
🎯 The trade didn’t go as planned. Fortunately, the New York rebound from 3350 helped me exit at breakeven.
🧭 So now the big question is:
Is Gold reversing to the downside?
The answer: Not confirmed yet.
The structure is technically still bullish, but the chart is far from pretty.
🧨 What’s going wrong?
❌ Bearish engulfing candle on Wednesday – I chose to ignore it yesterday, but it’s still there.
❌ The breakout above 3375 (ascending triangle resistance) is failing – and could now turn into a false breakout trap.
❌ The ascending trendline from January 2025 is under pressure.
❌ And if today we close near 3350, the weekly chart will show a bearish Pin Bar – not exactly a sign of strength.
📉 My current plan:
- If price rallies back above 3380 → I’m looking to sell into strength, not buy.
- If we break below 3350 → I’ll also look to sell the breakdown.
Right now, for Gold to regain bullish momentum, it needs to reclaim 3400. No compromise.
⚠️ Summary:
Yes, the bigger structure is still bullish.
But momentum is fading, and price action is starting to turn against the bulls.
We need confirmation, not hope.
If 3350 breaks cleanly – things could accelerate to the downside.
Disclosure: I am part of TradeNation's Influencer program and receive a monthly fee for using their TradingView charts in my analyses and educational articles.

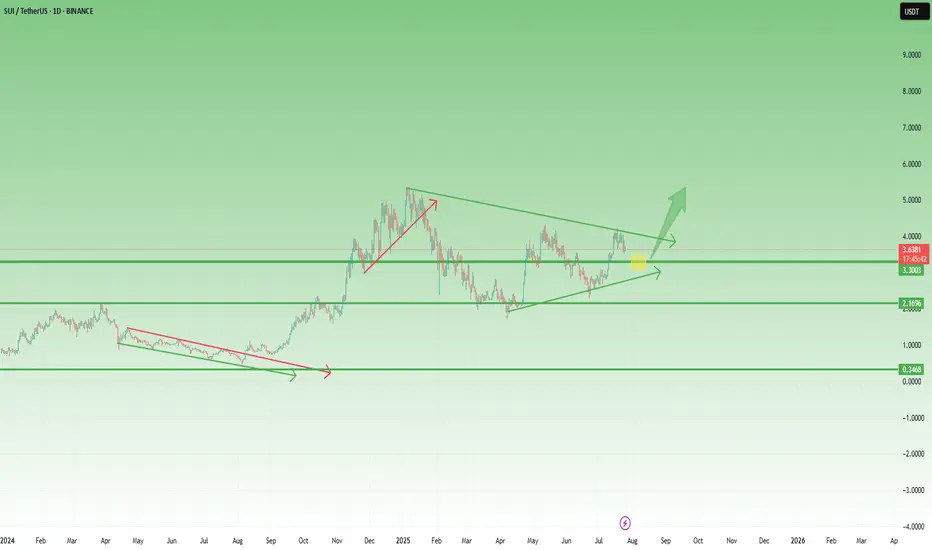
SUI – Preparing for a Breakout? Symmetrical Triangle in PlaySince the beginning of the year, SUI has been consolidating inside a classic symmetrical triangle — marked by higher lows and lower highs, a sign of tightening price action and growing pressure.
This kind of structure doesn’t last forever.
Usually, it ends with a strong breakout — especially if supported by volume.
🔍 What to watch:
- A break above the upper trendline could trigger a strong move, with potential targets in the $5 area and even a new ATH, if altcoins enter a real revival phase.
- On the flip side, $2.80 remains the key support level.
As long as it holds, bulls remain in control of the structure.
📍 My game plan:
I’m watching the $3.25 area as a potential buy zone —a great spot inside the pattern, offering tight risk and strong upside if the breakout comes.
Until then, it’s all about patience.
Pressure is building. The triangle is tightening.
And the market is waiting for a reason to move.
Gold Correction Went Deeper, but the Bullish Structure Intact📌 Quick recap from yesterday:
In my previous analysis, I mentioned that I was looking to buy dips around 3400, expecting a continuation move toward the ATH near 3500.
That was the plan.
But as the day unfolded, I removed my pending buy order — and explained exactly why in an educational post on how context can override entry levels.
If you read that, you already understand:
It’s not where price goes. It’s how it gets there.
________________________________________
📉 So… where are we now?
The big question is:
Was this just a deeper correction, or is Gold preparing to shift direction entirely?
In my opinion, we’re still in a healthy correction, not a reversal.
Why?
• Price remains above the horizontal support — the same level that acted as resistance last week
• The market is still above the trendline from mid-May
• No breakdown, no major structure violation — just deeper retracement after a sharp impulsive move
________________________________________
📈 What’s the plan going forward?
As long as these two supports hold, I believe the buy-the-dip narrative remains valid — even at better prices.
In fact, I already entered a new long position about an hour ago, which is currently up around 90 pips at the time of writing.
My bias stays bullish unless proven otherwise.
________________________________________
📌 Conclusion:
Yes, the correction went deeper than expected.
Yes, I removed a pending order — because the reaction was not what I wanted to see.
But structure still supports continuation, and I remain in the buy-the-dip camp as long as key support holds. 🚀
Disclosure: I am part of TradeNation's Influencer program and receive a monthly fee for using their TradingView charts in my analyses and educational articles.
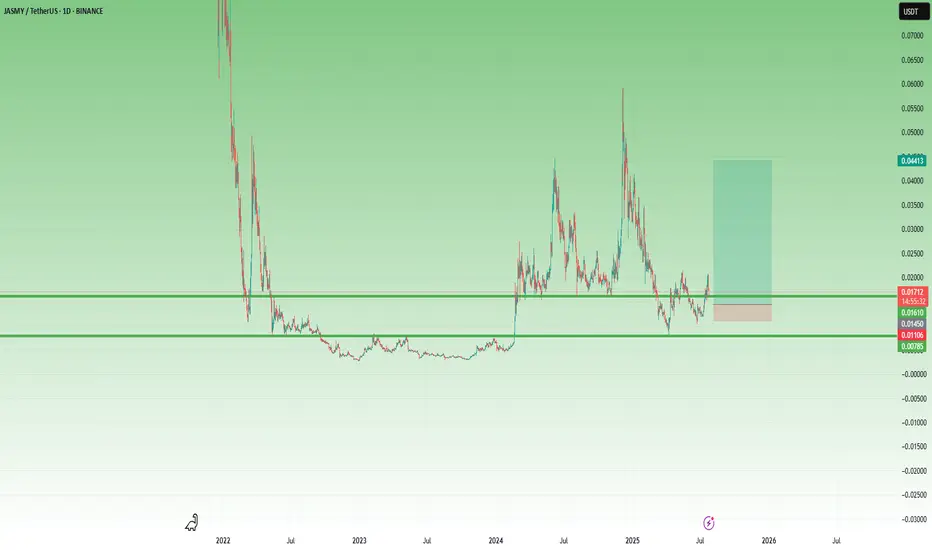
JASMY – A Volatile Setup with x3 Potential 🔸 After bottoming out at 0.003 and spending over a year in accumulation, JASMY finally broke above the key 0.008 resistance zone in February 2024. That breakout triggered a series of explosive moves – but just as violent were the drops that followed.
🔸 What stands out:
• The first post-breakout spike found a new support at 0.015.
• Then came a second vertical move toward 0.06, followed (of course) by a brutal drop.
• But… 0.008 held, and by late June, the chart printed a higher low, showing that buyers became interested.
📍 Right now, the price has reclaimed the 0.015 zone and is trying to stabilize above it. If this level holds, it could become the new base for the next wave.
💡 My plan?
This is very speculative, but I like the setup.
I’m looking to buy around 0.015–0.016, with clear negation below 0.010.
Target? Around 0.045, for a potential x3 move and a tasty 1:8 risk/reward.
⚠️ I’m not the guy who repeats the cliché “ only trade what you can afford to lose, ”
but seriously – this one is for clubbing money, not summer vacation money.
Let the volatility work in our favor. 🚀
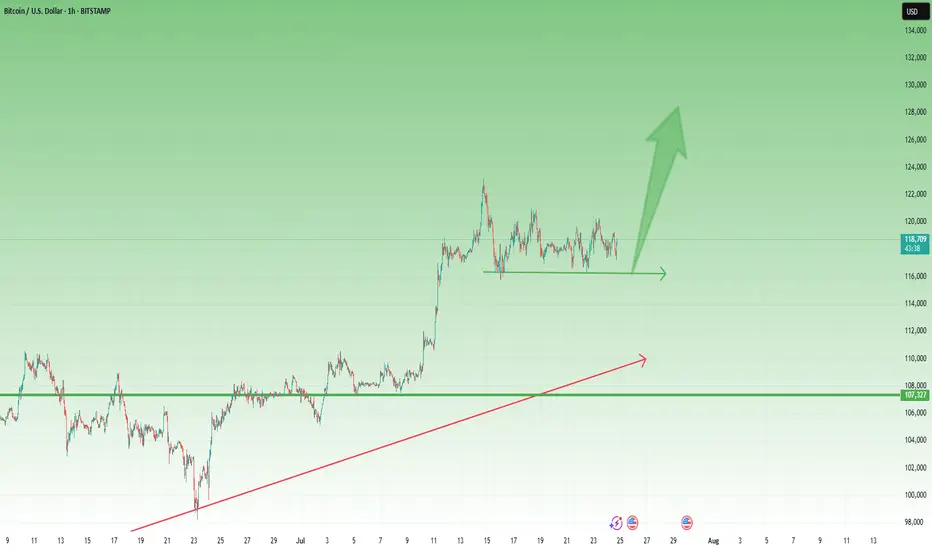
BTCUSD – Bulls Still in Control After New ATH 🔸 After the new All-Time High printed 10 days ago, Bitcoin entered a consolidation phase. So far, the market looks healthy and seems to be waiting for a trigger to continue the uptrend.
🔸 A clear support zone has formed around 116k, and as long as this level holds, bulls remain in full control of the market.
📉 For short-term traders and speculators:
Buying dips near 117.5k could offer solid risk/reward setups, with a target around 125k in case of a breakout.
Let’s see if the market gives us the trigger we’re waiting for. 🚀
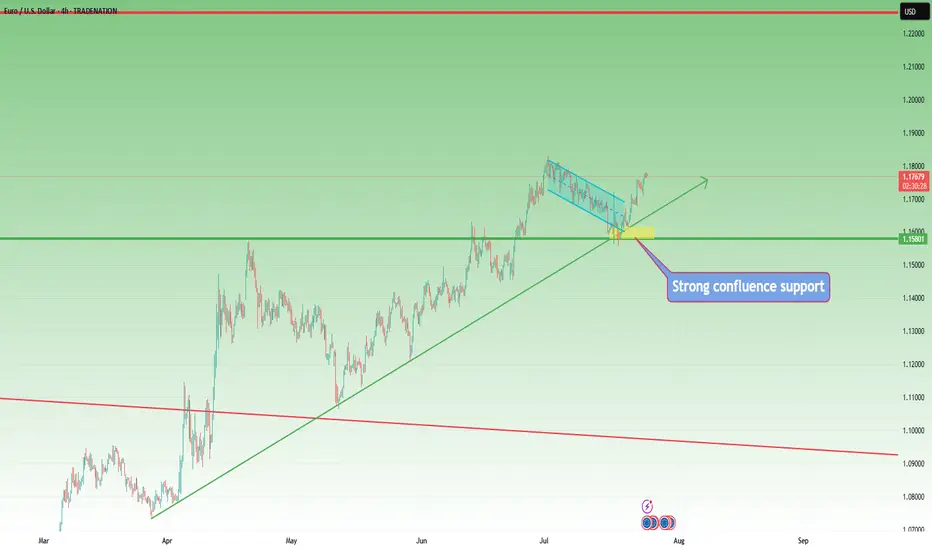
EURUSD – Bulls Still in Control, Trend ResumesIn my previous EURUSD analysis, I pointed out that the pair was nearing an important confluence support around 1.1620, and that – given the overall bullish trend – this zone could offer solid long opportunities.
What followed?
The market briefly dipped below that zone, even challenging the psychological 1.1600 round number. But instead of breaking down, bulls regrouped, stepped in with force, and pushed the pair aggressively higher.
📍 At the time of writing, EURUSD is trading at 1.1770, and my long trade is running with a comfortable 150 pips profit.
🔍 W hat’s Next?
The current structure suggests a continuation of the uptrend, and the logical technical target is the recent high at 1.1830.
Until proven otherwise, this is still a buy-the-dip market.
✅ Buying around 1.1700 could be a valid setup, especially if we see buying power on the intraday chart
⚠️ The Warning Sign
Despite the bullish bias, keep in mind:
If EURUSD drops and closes below 1.1670, the structure begins to shift — and this could signal a deeper correction or even trend reversal.
📌 Until then, the bias remains bullish, dips are to be watched for entries, and 1.1830 is the next checkpoint.
D isclosure: I am part of TradeNation's Influencer program and receive a monthly fee for using their TradingView charts in my analyses and educational articles.
Total3 – Back Above 1T, but Will It Offer a Second Chance?📈 What happened since April?
After the sharp low in early April, Total3 began to recover steadily.
Toward the end of the month, it broke above the falling trendline that had been holding since January — a key technical shift.
This triggered a strong recovery rally, pushing total altcoin capitalization (excluding BTC & ETH) to the 930–940B resistance zone.
📉 Then came the pullback…
Price printed a double top near resistance, followed by a drop — but not a bearish one.
Instead, the correction was orderly, forming a bullish flag, with the low landing right on the 61.8% Fibonacci retracement. Classic healthy structure.
🚀 The latest breakout
Earlier this month, Total3 launched a very impulsive leg up, reclaiming the 1 trillion level with strength.
At the time of writing, we’re trading back above 1T, and momentum remains on the bulls’ side.
However, the chart does look a bit overextended in the short term, suggesting a correction could follow soon.
🧭 Trading Plan – Will We Get a Retest?
The textbook play would be to wait for a deep pullback toward previous support levels.
BUT – I don’t believe we’ll get a full retest of the breakout. Altcoins may stay elevated or correct only modestly.
Instead, I’ll be watching the 1T zone and slightly below — that’s where I’ll look to load up on interesting altcoins.
📌 Conclusion:
Total3 has broken structure, reclaimed key levels, and is showing classic bullish continuation behavior.
The market may not offer you the perfect entry — but small dips near 1T could be all we get before another move higher. 🚀
Be prepared. Don’t wait for perfection in a market because rarely gives it.
XAGUSD Outlook – 40 Remains the Next TargetIn my previous XAGUSD analysis, I argued that the trend was strongly bullish and that a move toward 40 was the next logical outcome. At the time, price was correcting, and I highlighted the 37.50 zone as a key area to look for long opportunities.
✅ Indeed, Silver respected that zone perfectly —
It retested the broken consolidation, found support, and then surged higher, marking a new multi-year high in yesterday’s session.
________________________________________
🔍 What Now?
Nothing has changed in the broader view:
• Trend: Strongly bullish
• Structure: Higher highs and higher lows remain intact
• Behavior: Dips are being bought aggressively
As long as the recent 37.50 low is not broken, the strategy remains straightforward:
Buy dips within bullish continuation
________________________________________
🎯 40 in Sight — But Don’t Be Surprised if It Goes Further
The 40 zone remains the natural next target — a major psychological level.
But based on current momentum and breakout strength, Silver could go even higher in the coming weeks and months. If buyers keep control, we might even see new ATH test by year's end (50 zone).
________________________________________
🟢 Conclusion
This breakout confirms the larger trend.
The pullback to 37.50 was bought, as expected, and now Silver is making its move.
Strategy should remain the same:
Stay long above 37.50
Buy the dips
Watch how price reacts near 40 — but keep an open mind for higher levels
Disclosure: I am part of TradeNation's Influencer program and receive a monthly fee for using their TradingView charts in my analyses and educational articles.

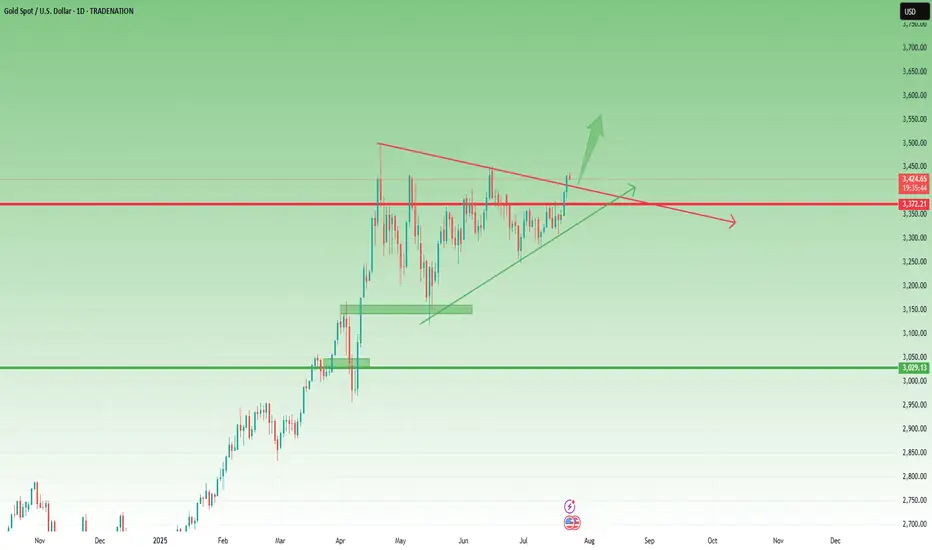
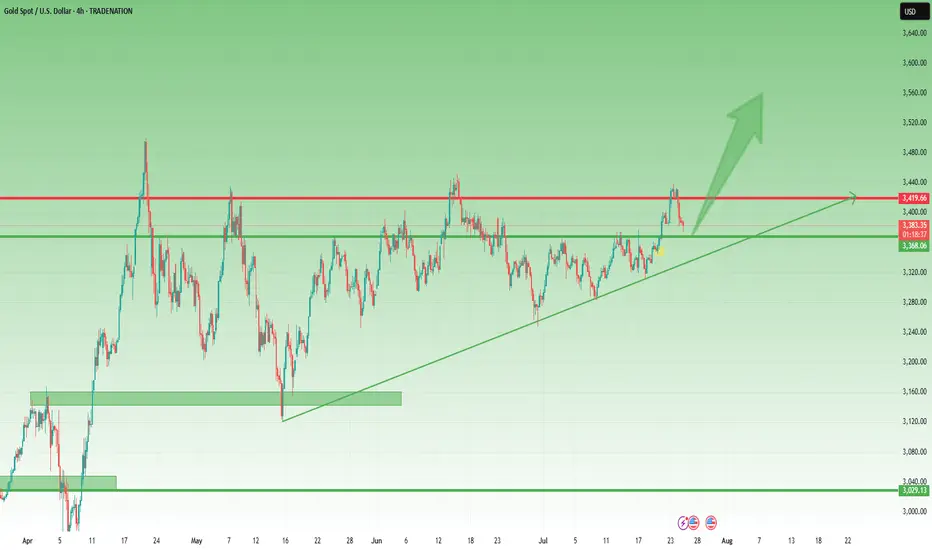
Gold Update – Strong Breaks, Strong BullsYesterday, after the break of the key 3370 resistance, Gold corrected slightly toward 3383, then consolidated briefly in that area. From there, it launched into a strong new leg up, closing the day once more near the highs, around 3430.
📌 What’s important here is that the price did not even come back to retest the broken resistance — now turned support. Combined with the strong daily close near the high of the range, this gives us a clear message:
➡️ Bulls are in full control.
________________________________________
🔍 This Week – Three Key Breaks
So far this week, Gold has delivered three major breakouts:
• ✅ A clean breakout from the box consolidation that kept price stuck and indecisive last week
• ✅ A decisive break above the 3400 psychological figure
• ✅ A breakout above the symmetrical triangle resistance, which had been forming since late April
Each of these is significant on its own. Together, they suggest a shift toward a more aggressive bullish scenario.
________________________________________
🔮 What’s Next?
All these breakouts point to the potential for more gains ahead.
In fact, the next logical step could be an attempt to mark a new All-Time High.
My view remains the same:
Buying dips remains the strategy of choice, with a focus on the 3400 zone as a key support area, and a swing target around 3500.
Disclosure: I am part of TradeNation's Influencer program and receive a monthly fee for using their TradingView charts in my analyses and educational articles.