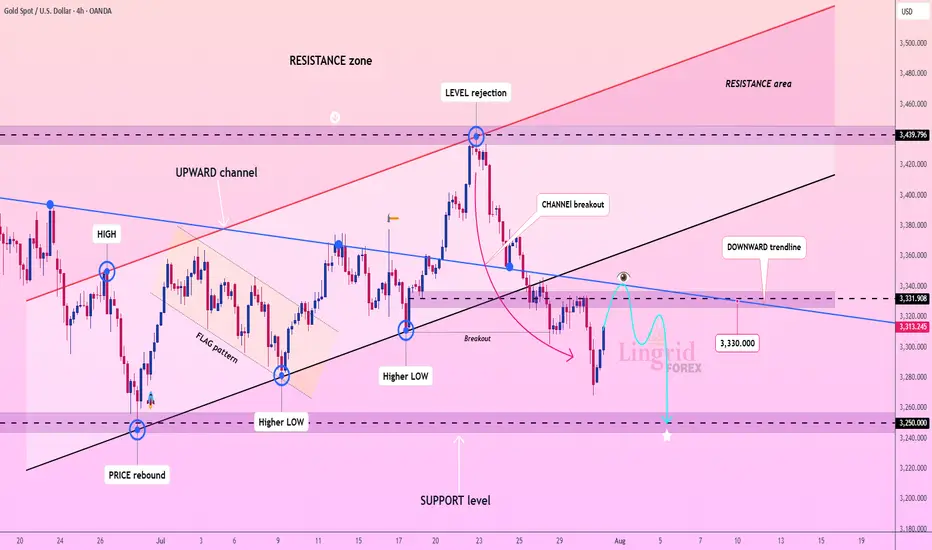
Lingrid | GOLD Possible Retest of the Major Support ZoneThe price perfectly fulfilled my previous idea . OANDA:XAUUSD is bouncing from recent lows but remains under pressure below the key resistance at 3,331.90 and the downward trendline. The prior rejection near 3,440 led to a steep selloff with a clean break below the upward channel. Current action shows a potential lower high forming near the broken trendline. A rejection there could send gold tumbling toward the 3,250.00 support zone.
📌 Key Levels
Sell trigger: Failure to reclaim 3,331.90
Sell zone: 3,330 – 3,340
Target: 3,250.00
Invalidation: Strong bullish breakout above 3,340 and descending trendline
💡 Risks
Bullish reversal breaking above downward trendline
Dovish Fed news boosting gold
Unexpected macroeconomic shocks increasing safe-haven demand
If this idea resonates with you or you have your own opinion, traders, hit the comments. I’m excited to read your thoughts!
Signals
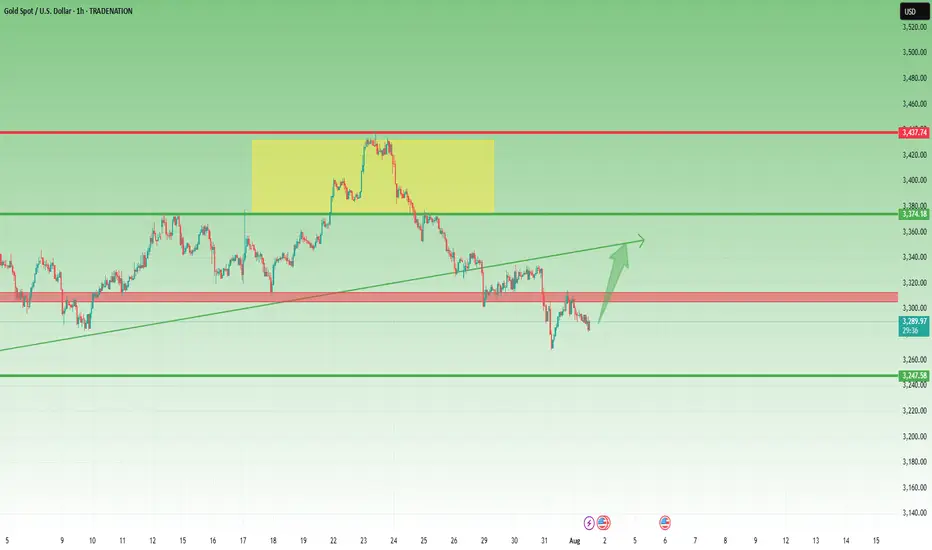
Gold Rejected at 3315 – But Bulls Might Not Be Done Yet📌 What happened yesterday?
During the Asian session, Gold printed a fresh local low at 3268, continuing the downtrend that already dropped over 1700 pips in just one week. However, that move quickly reversed, and we saw a natural corrective bounce.
📈 Resistance holds firm
The correction took price back up into the 3310 zone, which acted as confluence resistance. After two taps into that area, price failed to sustain above 3300, indicating sellers are still active there.
❓ Is the upside correction over?
I don't think so. The recent drop has been choppy, lacking the strong momentum of previous legs. This type of price action often signals that we are still within a correction, not in a clean continuation.
📊 What am I watching?
I’m actively monitoring for:
• Exhaustion signs on the downside
• Upside reversal signals
My plan is to open long trades only when I see confirmation, aiming for a move back toward the 3330 zone, which could act as resistance.
Disclosure: I am part of TradeNation's Influencer program and receive a monthly fee for using their TradingView charts in my analyses and educational articles.
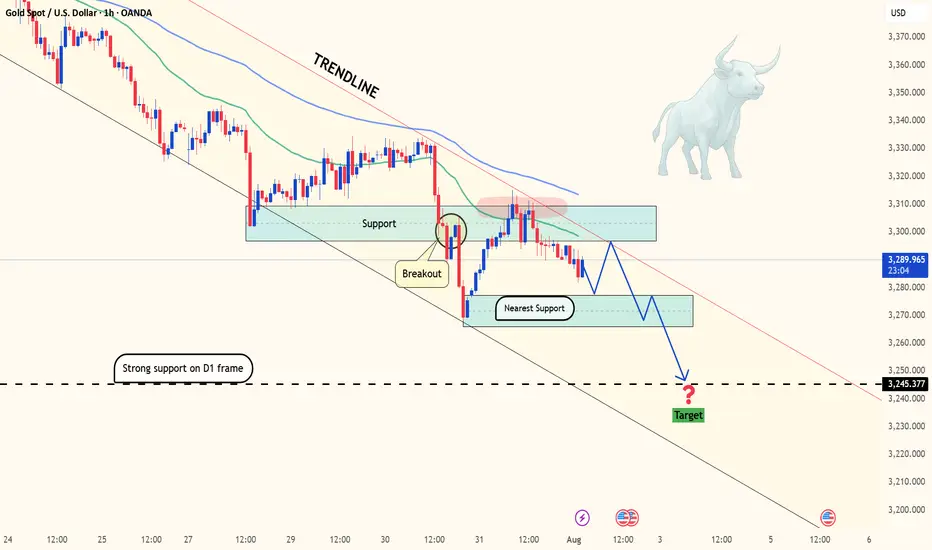
Gold on the edge: Will 3,270 break as Fed pressure builds?Hello traders, what’s your view on XAUUSD?
Yesterday, gold remained under pressure as a series of fresh U.S. economic data reinforced expectations that the Federal Reserve will keep interest rates higher for longer. As a result, U.S. Treasury yields surged, the dollar strengthened, and gold came under renewed selling pressure. Currently, XAUUSD is trading around 3,288 USD, down 0.04% on the day.
From a technical standpoint, gold is clearly trading within a well-defined downward-sloping channel, confirming the dominance of bearish momentum. Moreover, both the EMA34 and EMA89 are acting as dynamic resistance levels, repeatedly rejecting any short-term recovery attempts—highlighting the strength of the current downtrend.
If a pullback occurs before the next leg lower, the confluence of resistance and the EMA zone will be crucial to watch. It could offer ideal conditions for potential short setups in line with the trend.
Looking ahead, the next key support lies at 3,270 USD. A break below this level could open the door for a deeper move toward the 32XX area.
What do you think? Will gold continue to drop further?
Good luck and trade safe!
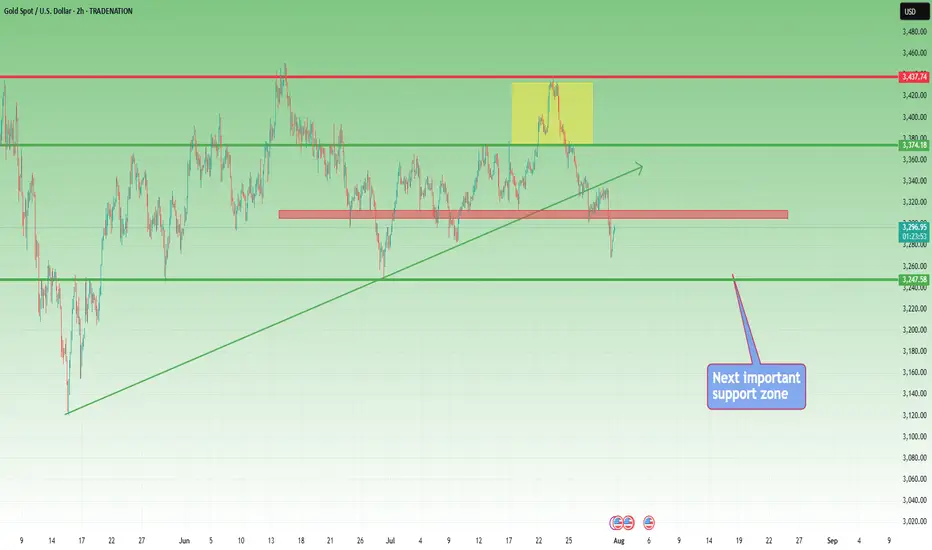
XAUUSD Update – Down Continuation to 3250?1. What Happened Yesterday
After an anemic correction that formed a bearish flag, Gold finally broke below 3300 and even dipped under the 3280 support zone — which was my primary downside target. While the move during the day didn’t have enough momentum to reach my second sell limit, I was already in a low-volume short position, so I didn’t miss the move entirely.
2. The Key Question
Has the drop ended, or are we looking at further downside?
3. Why I Expect More Downside
• The overall structure remains bearish.
• The newly formed resistance (previous support) is now the new sell zone.
• If the price drops towards 3280 again, continuation to 3250 becomes very probable.
4. Trading Plan
Selling rallies remains the preferred strategy, especially on spikes into resistance. As long as the price stays below 3335-3340 zone, the bearish outlook remains intact.
5. Conclusion
Sell the rallies. The technical picture still favors downside continuation — no need to overcomplicate it. 🚀
Disclosure: I am part of TradeNation's Influencer program and receive a monthly fee for using their TradingView charts in my analyses and educational articles.
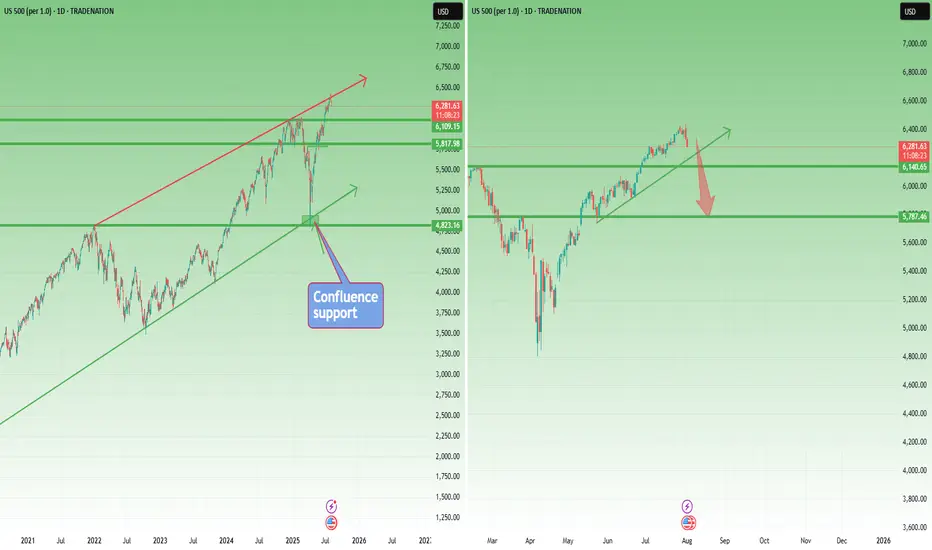
Correction Ahead? SP500 Prints Reversal Signal at Key Resistance📘 This market moves like a textbook chart
SP500 is acting like a perfect case study from a trading manual. Back in early April, the index dipped just below 5,000, right into a confluence support zone ( I had spoken about this at the time ) – formed by the long-term ascending trendline and the 2022 all-time high. Just like other U.S. indices, the market reversed aggressively from that area.
🚀 A 30% rally in 4 months
From that low, SP500 rallied around 30% in just four months. An incredible move that brought the index straight to the upper boundary of the yearly rising channel.
🕯️ Bearish signal at the top
And just like in NAS100’s case , the index printed a strong Bearish Engulfing candle exactly at that resistance level. This kind of signal, after such a rise, shouldn’t be ignored.
📉 A correction is not only probable – it’s needed
A pullback from here is not just likely, but in my opinion, healthy and necessary . Short-term speculators could look for a move toward the 6,150 zone, which would already offer decent room for profit.
🔍 What if it goes deeper?
I wouldn’t be surprised to see a correction down to 5,750–5,800. That’s about a 10% decline, which wouldn't even classify as a bear market, just a normal reset after a euphoric rally.
🧠 Perspective matters
In a market that gained 30% in four months, a 10% correction is not a crash — it’s discipline being restored.
Disclosure: I am part of TradeNation's Influencer program and receive a monthly fee for using their TradingView charts in my analyses and educational articles.
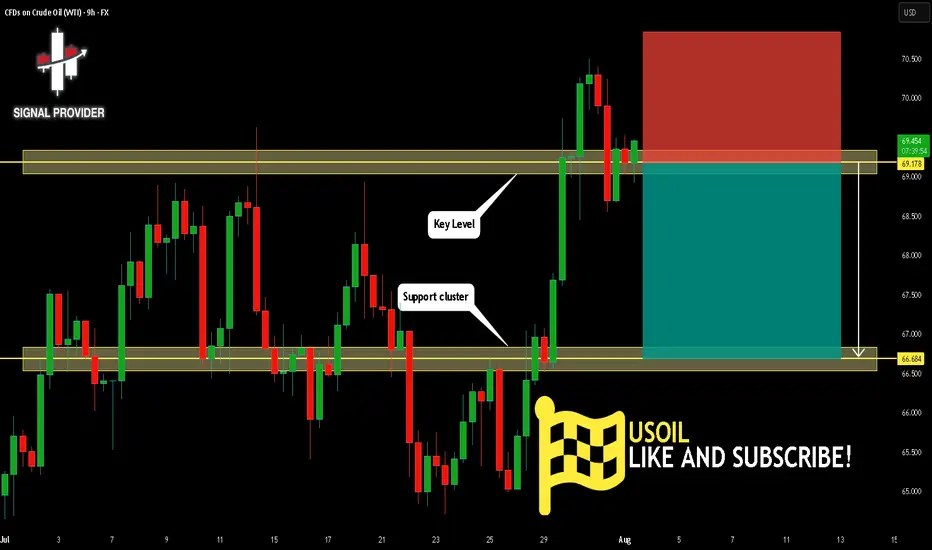
USOIL Is Bearish! Short!
Please, check our technical outlook for USOIL.
Time Frame: 9h
Current Trend: Bearish
Sentiment: Overbought (based on 7-period RSI)
Forecast: Bearish
The market is approaching a significant resistance area 69.178.
Due to the fact that we see a positive bearish reaction from the underlined area, I strongly believe that sellers will manage to push the price all the way down to 66.684 level.
P.S
The term oversold refers to a condition where an asset has traded lower in price and has the potential for a price bounce.
Overbought refers to market scenarios where the instrument is traded considerably higher than its fair value. Overvaluation is caused by market sentiments when there is positive news.
Disclosure: I am part of Trade Nation's Influencer program and receive a monthly fee for using their TradingView charts in my analysis.
Like and subscribe and comment my ideas if you enjoy them!
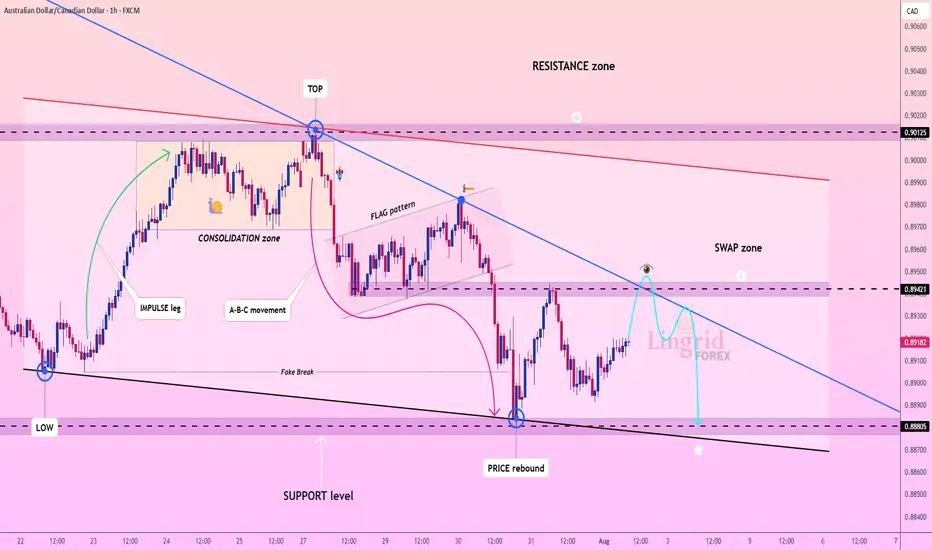
Lingrid | AUDCAD Swap Zone. Potential Selling OpportunityThe price perfectly fulfilled my last idea . FX:AUDCAD is rebounding from a strong support area after a fake break below 0.88805 and is now moving toward the descending trendline. The price is expected to test the swap zone near 0.89421, where prior support may flip to resistance. This setup favors a SELL scenario from the lower high structure within the flag and downtrend. A rejection from the trendline could resume the bearish continuation back toward support.
📌 Key Levels
Sell zone: 0.89421 – 0.89500
Buy zone: 0.88805 – 0.88600
Target: 0.88805
Invalidation: Break and close above 0.89550
💡 Risks
Bullish breakout through the descending trendline
Sharp reversal from macroeconomic news
Short-term consolidation above 0.89100 weakening momentum
If this idea resonates with you or you have your own opinion, traders, hit the comments. I’m excited to read your thoughts!
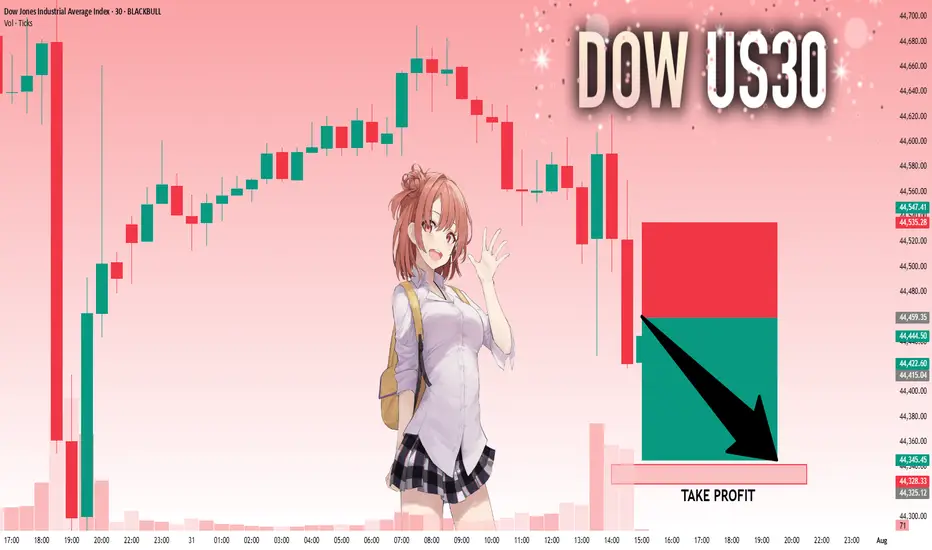
US30: Absolute Price Collapse Ahead! Short!
My dear friends,
Today we will analyse US30 together☺️
The in-trend continuation seems likely as the current long-term trend appears to be strong, and price is holding below a key level of 44,459.35 So a bearish continuation seems plausible, targeting the next low. We should enter on confirmation, and place a stop-loss beyond the recent swing level.
❤️Sending you lots of Love and Hugs❤️
GOLD falls sharply, fundamental analysis and technical positionOANDA:XAUUSD fell sharply below the $3,300/oz price level as Chairman Jerome Powell did not signal any rate cuts at his next press conference on September 16-17. He only said that “no decision has been made on September” and that “more data will be evaluated in the coming months.” Economic data undermined the case for a rate cut, while geopolitical play remained a potential support.
The Fed and Interest Rates
The Federal Reserve kept interest rates unchanged for a fifth straight meeting on Wednesday, defying persistent pressure from President Donald Trump and White House officials.
However, two members of the central bank's board dissented, a rare move in three decades that underscored growing divisions within the central bank over the impact of Trump's tariff policies.
At the meeting, the Fed kept its benchmark federal funds rate in a range of 4.25% to 4.5%, in line with policy through 2025. Last fall, the Fed cut rates by a total of 100 basis points.
However, Federal Reserve Board Governors Christopher Waller and Michelle Bowman opposed cutting interest rates by another 25 basis points, marking the first time since Alan Greenspan in 1993 that two board members have opposed a majority resolution at a meeting.
At the press conference, Chairman Jerome Powell did not signal a rate cut at the next interest rate meeting on September 16-17, saying only that “no decision has been made about September” and that “more data will be evaluated in the coming months.” Powell also noted that despite Trump’s call for a sharp 3% rate cut to reduce interest costs on US debt and stimulate the housing market, the Fed will continue to monitor the longer-term impact of tariffs on the path of inflation and economic recovery.
Market expectations for a Fed rate cut in September fell to 47% in Powell's speech.
Economic data
ADP jobs data beats expectations and is bearish
US ADP payrolls jumped 104,000 in July, beating market expectations of 75,000 and marking the biggest gain since March. The data showed continued strength in the labor market, reinforcing the Federal Reserve’s stance on keeping interest rates high. Meanwhile, the preliminary estimate of annual GDP growth in the second quarter came in at 3% (2.4% expected), and the core personal consumption expenditures price index rose 2.5% year-on-year (2.3% expected), indicating both economic resilience and inflation stability, further weakening expectations for a rate cut.
Keep an eye on the ISM manufacturing PMI and non-farm payrolls data on August 1. If the jobs numbers continue to be strong, this could reinforce the Fed’s dovish stance.
Geopolitical and Policy Plays
News of a 90-day extension of the US-China tariff deal has eased some safe-haven demand, but Trump’s August 8 deadline for a new Russia-Ukraine deal, coupled with tensions in the Middle East, continue to provide potential support for gold.
Continued purchases by central banks (such as China and India) are a positive signal in the medium to long term, but are unlikely to offset short-term pressure from the Federal Reserve’s policies.
Technical outlook for OANDA:XAUUSD
On the daily chart, gold has been sold below the $3,300 level and now the $3,300 level has become the nearest resistance at present. For now, gold will be limited by the area of the 0.382% Fibonacci retracement with the original price point of $3,300, along with that it has formed a short-term downtrend with the price channel, the next target will be around $3,246 in the short term followed by the Fibonacci retracement level noted with readers in previous publications.
On the momentum front, the Relative Strength Index is operating below 50 and is far from the oversold zone (20-0), indicating that there is still plenty of room for downside ahead.
In addition, the gold trend will also be pressured by the EMA21, as long as gold remains below the EMA21, the current technical conditions continue to favor the downside.
For the day, the technical outlook for gold is bearish with notable positions listed as follows.
Support: 3,246 – 3,228 USD
Resistance: 3,300 USD
SELL XAUUSD PRICE 3345 - 3343⚡️
↠↠ Stop Loss 3349
→Take Profit 1 3337
↨
→Take Profit 2 3331
BUY XAUUSD PRICE 3240 - 3242⚡️
↠↠ Stop Loss 3236
→Take Profit 1 3248
↨
→Take Profit 2 3254

Lingrid | DOGEUSDT Pullback and Continuation OpportunityBINANCE:DOGEUSDT is currently testing the intersection of its upward channel support and a critical horizontal zone near 0.21378, after a steep corrective decline from the 0.28628 resistance area. The recent price action formed a rounded pullback, suggesting potential accumulation near trendline confluence. A bullish bounce here could trigger a strong rally toward 0.26350 as shown by the projected upward path. Failure to hold the 0.21000 area would expose the pair to deeper downside toward the 0.15706 support.
📌 Key Levels
Buy zone: 0.21000–0.21700
Buy trigger: Break and close above 0.23000
Target: 0.26350
Invalidation: Break below 0.21000
⚠️ Risks
Breakdown of ascending trendline support
Weak volume on upward breakout
Broader market weakness impacting altcoins
If this idea resonates with you or you have your own opinion, traders, hit the comments. I’m excited to read your thoughts!

Top in Place? NASDAQ100 Signals Exhaustion After Incredible Run📈 The crazy run since April
NASDAQ100 has had a spectacular run since early April, when the index dipped to 16,300 amid rising tensions caused by Trump’s tax war. From that low, we’ve seen a mind-blowing rally of over 7,000 points, which translates to a 40% gain in just 4 months.
Such a rise is not just impressive— it’s overextended , especially by historical standards. Markets don’t move in straight lines forever, and this one might be showing signs of fatigue.
🕯️ Bearish signal at the top
Fast forward to this week: yesterday, the index marked a new all-time high at 23,700, but closed the day with a strong bearish engulfing candle — one that wipes out the gains of the previous 4 trading sessions.
This is not a small technical detail. Such candles, when appearing after an extended rally, often signal exhaustion and a potential shift in momentum.
❗ Top in place?
In my opinion, there's a high probability that a top has been set, at least temporarily. We might be looking at the beginning of a healthy correction, or even something more meaningful, depending on follow-through in the next sessions.
📉 Where to next?
The first major support to watch is the 22,200 level.
I expect that zone to be tested soon — and honestly, considering how much the index has gone up, this shouldn’t surprise anyone. It’s nothing more than a minor pullback, all things considered.
🧠 Stay smart!
When markets go vertical, it pays to stay disciplined and realistic. Tops rarely announce themselves, but when signals like this appear, it’s wise to listen.
Disclosure: I am part of TradeNation's Influencer program and receive a monthly fee for using their TradingView charts in my analyses and educational articles.

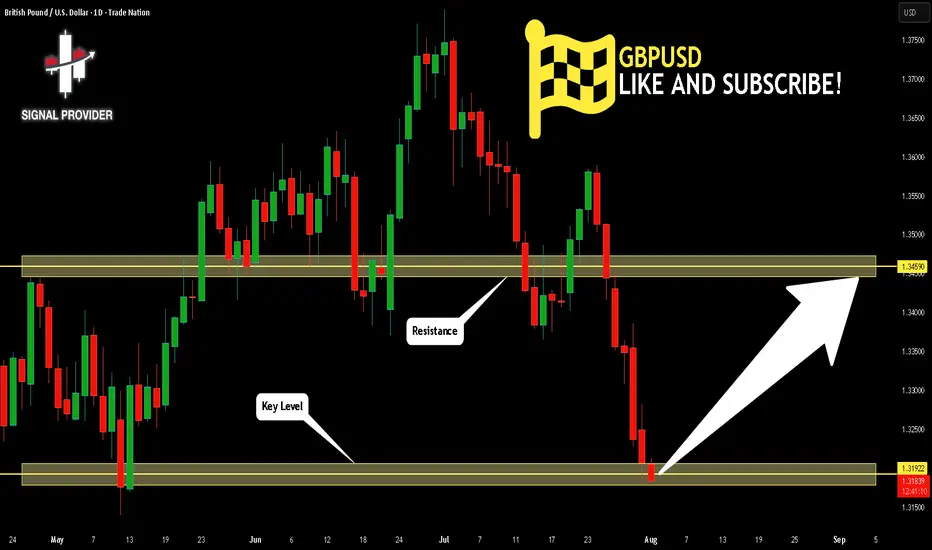
GBPUSD Is Going Up! Buy!
Take a look at our analysis for GBPUSD.
Time Frame: 1D
Current Trend: Bullish
Sentiment: Oversold (based on 7-period RSI)
Forecast: Bullish
The price is testing a key support 1.319.
Current market trend & oversold RSI makes me think that buyers will push the price. I will anticipate a bullish movement at least to 1.345 level.
P.S
Overbought describes a period of time where there has been a significant and consistent upward move in price over a period of time without much pullback.
Disclosure: I am part of Trade Nation's Influencer program and receive a monthly fee for using their TradingView charts in my analysis.
Like and subscribe and comment my ideas if you enjoy them!
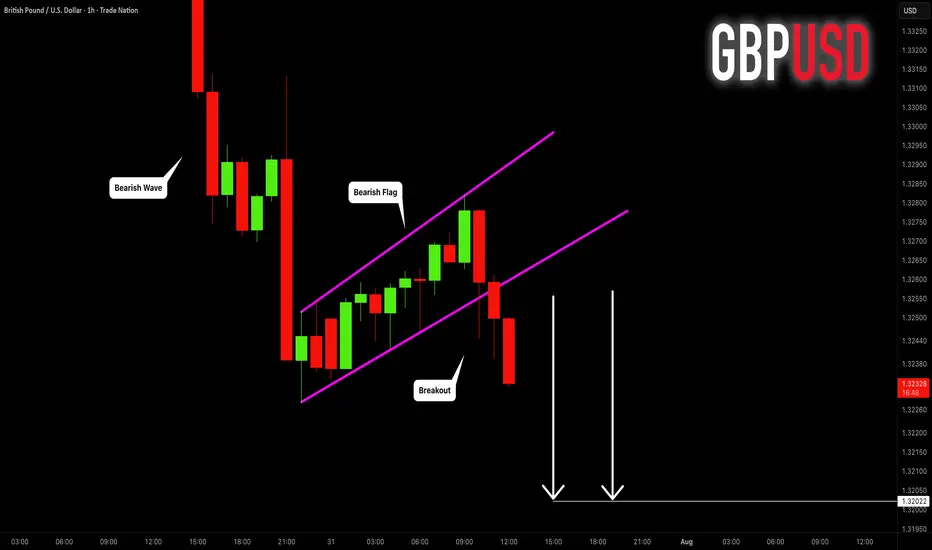
GBPUSD: Strong Trend-Following Pattern 🇬🇧🇺🇸
GBPUSD is going to drop lower.
The market has completed a correctional movement within
a bearish flag.
Its support violation provides a strong bearish confirmation.
I expect a drop to 1.3202 level.
❤️Please, support my work with like, thank you!❤️
I am part of Trade Nation's Influencer program and receive a monthly fee for using their TradingView charts in my analysis.
Lingrid | TONUSDT Potential Long From the KEY ZoneThe price perfectly fulfilled my last idea . OKX:TONUSDT is pulling back from a fake breakout above 3.590 but holding within the boundaries of an upward channel. The price is approaching strong confluence support near 3.250, where both the trendline and horizontal zone align. A rebound from this level could launch a new bullish leg toward the resistance zone. Buyers will look for confirmation at the bounce area to aim for 3.590 and beyond.
📌 Key Levels
Buy zone: 3.250 – 3.300
Sell trigger: Break below 3.250
Target: 3.590 – 3.700
Buy trigger: Bullish engulfing or breakout from local consolidation near 3.300
💡 Risks
Loss of support at 3.250 trendline
Bearish pressure from broader market sentiment
Another fakeout or choppy move around 3.300–3.400 zone
If this idea resonates with you or you have your own opinion, traders, hit the comments. I’m excited to read your thoughts!

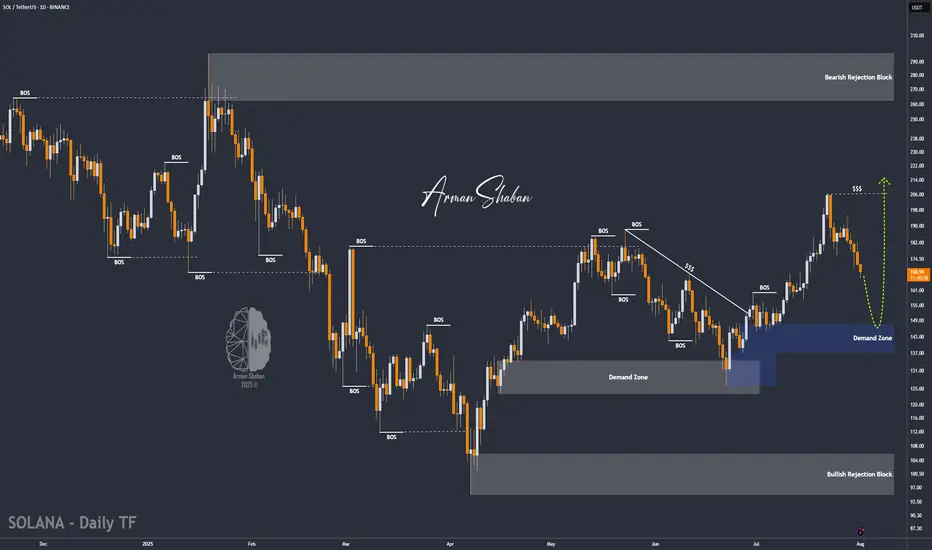
SOL/USDT | NFP Volatility Could Trigger Drop Toward $154!By analyzing the Solana chart on the daily timeframe, we can see that the price is currently trading around $169. If it fails to hold above the $168 level, a deeper drop could follow. With the upcoming NFP data release, increased volatility is expected across the markets. If Solana begins to decline, the potential correction targets are $163, $157, and $154. Watch the $145–$154 zone closely for a possible bullish reaction and buy opportunity.
Please support me with your likes and comments to motivate me to share more analysis with you and share your opinion about the possible trend of this chart with me !
Best Regards , Arman Shaban
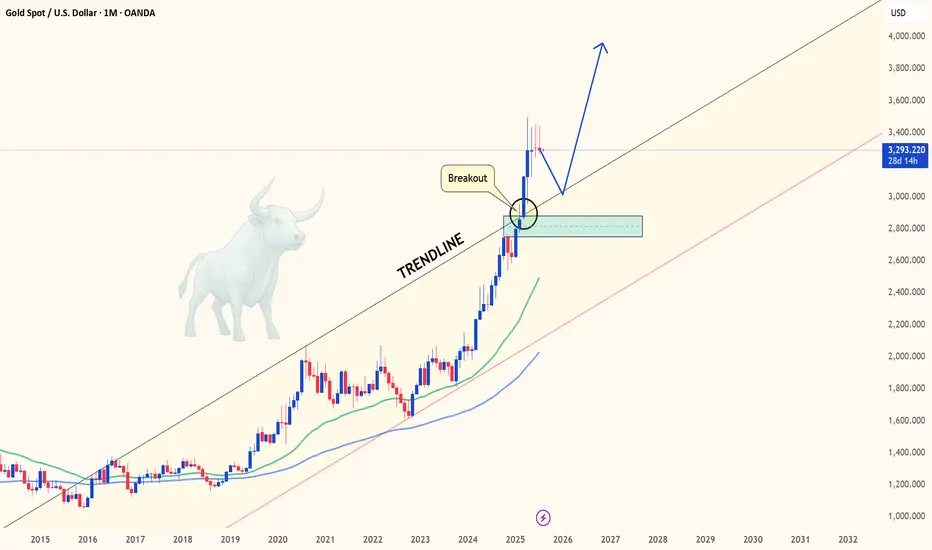
GOLD - Monthly breakout retest may confirm multi-year bull cycleHello everyone, what are your thoughts on the long-term outlook for XAUUSD?
Looking at the monthly chart (1M), we can clearly see that XAUUSD has broken out of the long-standing ascending channel that has held since 2015 — a major signal suggesting the start of a new bullish cycle. Price is now retesting the previously broken trendline, hinting at the possibility of a fresh upward leg to resume the longer-term bullish trend we've seen recently.
Personally, I'm targeting $3,600 in the medium term, and potentially $4,000 by 2026–2028 if institutional capital continues to rotate back into safe-haven assets like gold.
What about you — do you think BTC/USD will rise or fall in the coming years?
And what’s your target for it?
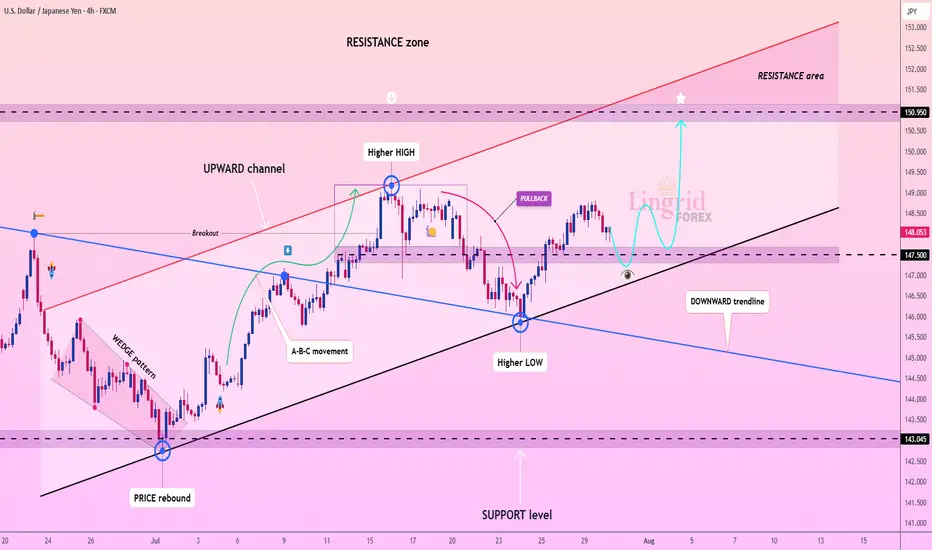
Lingrid | USDJPY Possible Strong Bullish RallyThe price perfectly fulfilled my previous idea . FX:USDJPY is trading within an upward channel after forming a higher low near the 147.50 zone, bouncing from the support trendline. Price action suggests a bullish structure continuation toward the 150.95 resistance, especially if the recent consolidation breaks higher. The overall formation aligns with a healthy correction phase before a potential push into the resistance area. Confirmation above 148.60 would likely accelerate the bullish move.
📌 Key Levels Buy zone: 147.50–147.25
Sell trigger: Below 147.00
Target: 150.95
Buy trigger: Break above 148.80
⚠️ Risks
Break below 147.50 may shift sentiment bearish
Strong resistance awaits near 150.00
Broader market volatility could invalidate pattern
If this idea resonates with you or you have your own opinion, traders, hit the comments. I’m excited to read your thoughts!
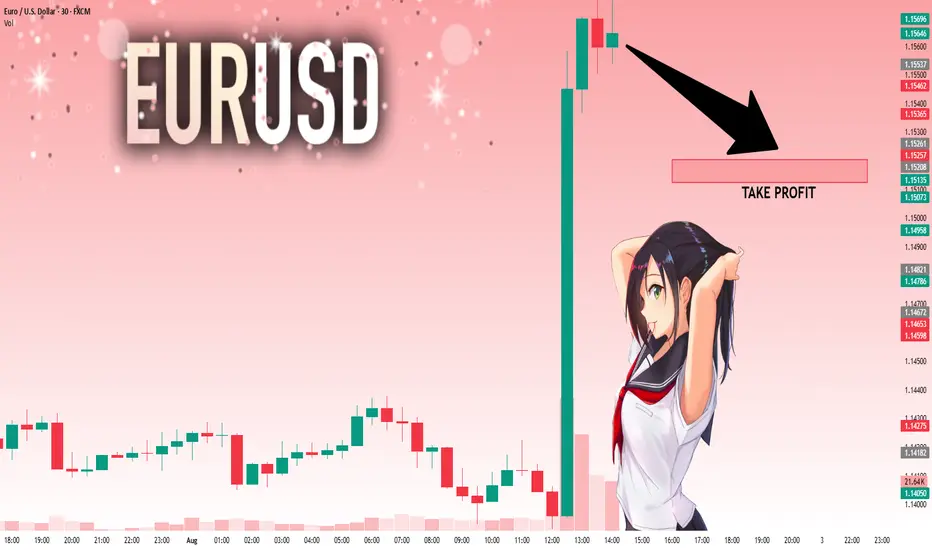
EURUSD: Move Down Expected! Short!
My dear friends,
Today we will analyse EURUSD together☺️
The price is near a wide key level
and the pair is approaching a significant decision level of 1.15337 Therefore, a strong bullish reaction here could determine the next move up.We will watch for a confirmation candle, and then target the next key level of 1.15208.Recommend Stop-loss is beyond the current level.
❤️Sending you lots of Love and Hugs❤️
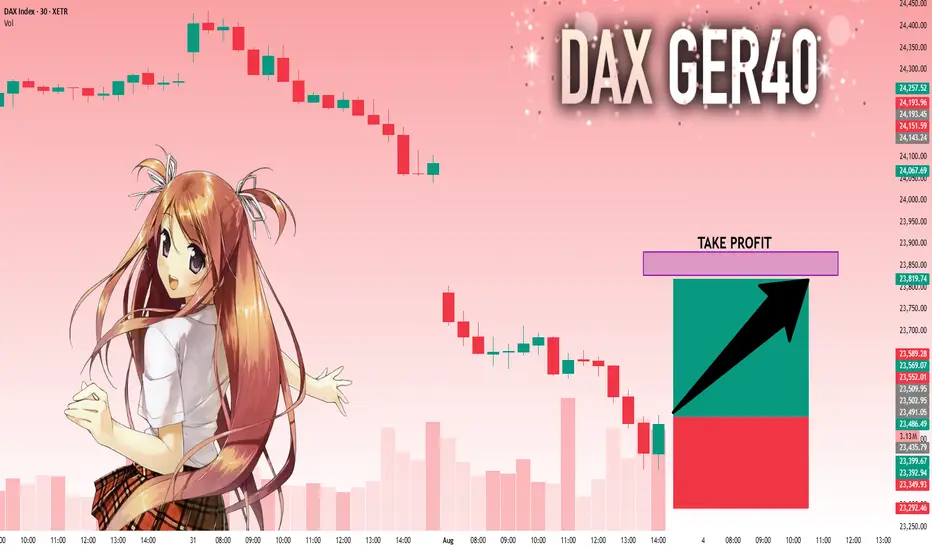
DAX: Next Move Is Up! Long!
My dear friends,
Today we will analyse DAX together☺️
The in-trend continuation seems likely as the current long-term trend appears to be strong, and price is holding above a key level of 23,502.95 So a bullish continuation seems plausible, targeting the next high. We should enter on confirmation, and place a stop-loss beyond the recent swing level.
❤️Sending you lots of Love and Hugs❤️
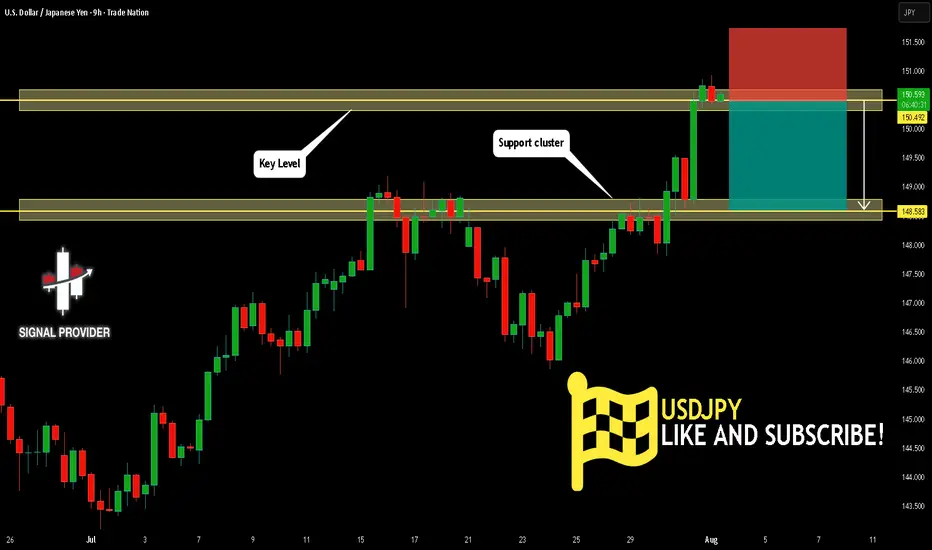
USDJPY Is Very Bearish! Sell!
Here is our detailed technical review for USDJPY.
Time Frame: 9h
Current Trend: Bearish
Sentiment: Overbought (based on 7-period RSI)
Forecast: Bearish
The market is on a crucial zone of supply 150.492.
The above-mentioned technicals clearly indicate the dominance of sellers on the market. I recommend shorting the instrument, aiming at 148.583 level.
P.S
We determine oversold/overbought condition with RSI indicator.
When it drops below 30 - the market is considered to be oversold.
When it bounces above 70 - the market is considered to be overbought.
Disclosure: I am part of Trade Nation's Influencer program and receive a monthly fee for using their TradingView charts in my analysis.
Like and subscribe and comment my ideas if you enjoy them!
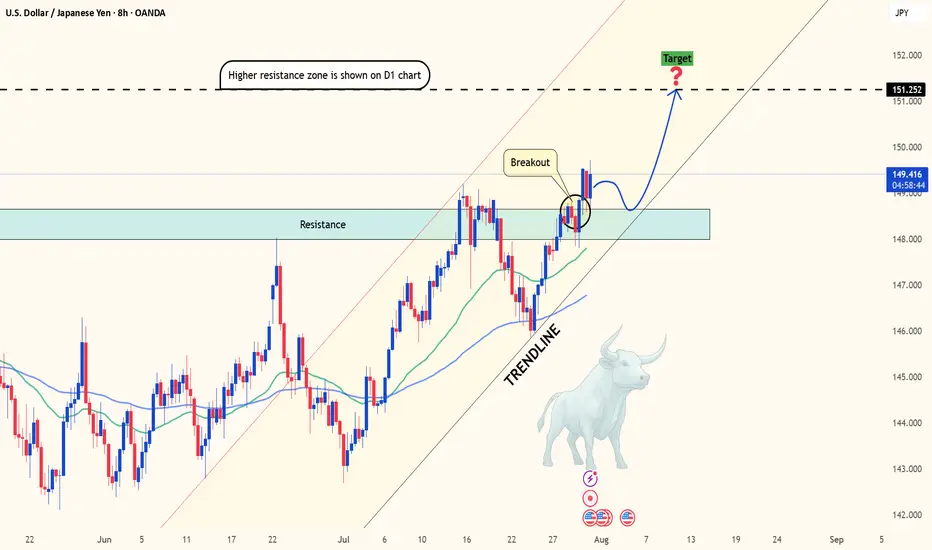
USDJPY breaks out as US data crushes forecastsHello traders! Do you think USDJPY will continue its upward momentum?
From a technical perspective, after several sessions of "building pressure," this pair has finally broken through a key resistance zone—opening the door to what could be the next bullish breakout.
Current price action suggests the uptrend remains firmly intact. The market continues to respect the rising trendline and finds strong support near the 34 & 89 EMA – a powerful technical combination that buyers often rely on. This isn’t just a typical breakout; it could be the start of a brand-new bullish cycle.
On the fundamental side, the U.S. dollar remains strong, supported by a string of solid economic data: employment, PCE, and consumer spending have all exceeded expectations. Meanwhile, the Japanese yen remains in “hibernation” as the Bank of Japan shows no sign of shifting away from its ultra-loose monetary policy. This divergence makes USDJPY one of the hottest pairs on the radar right now.
What’s next? If bullish momentum continues, the 151.25 level is likely the next short-term target. However, if the price encounters strong resistance at that level, a minor pullback could occur before the uptrend resumes.
So, what do you think? Is this the beginning of a major rally – or just a false breakout? Share your thoughts in the comments!
Wishing you successful and well-timed trades ahead!
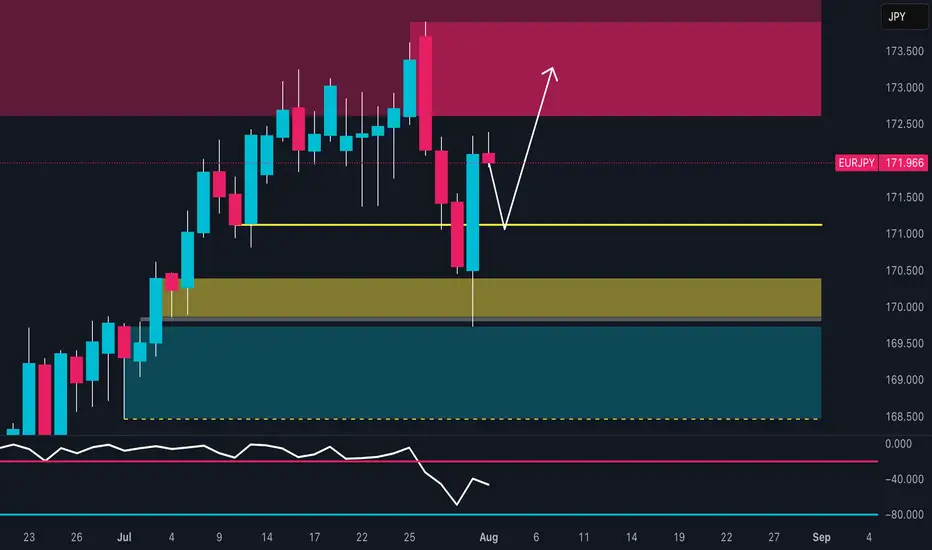
EUR/JPY Setup: Retail is 82% Short – Squeeze First, Drop After?🔹 Technical Context
Price reacted with a strong bullish wick in the 169.50–170.30 demand zone, signaling clear buyer defense. The RSI bounced from weakness but remains subdued, showing limited momentum.
📍 Current price action suggests a potential retest of the 172.50–173.30 area, which aligns with a supply zone, before a possible directional decision is made.
🗓️ Seasonality
Historically, August tends to be bearish for EUR/JPY:
5Y average: -0.48%
10Y average: -0.12%
15Y/20Y averages: -1.3% and -1.2%
📉 Seasonality indicates potential weakness, especially in the second half of the month.
🪙 COT Report (EURO & YEN) – July 22
EURO: Strong long accumulation by non-commercials (+6,284) and commercials (+17,575)
JPY: Net decline in both longs (-1,033) and shorts (-4,096), with a drop in total open interest
🧠 The market is heavily positioned on the Euro, while Yen positioning is fading. This creates a divergence between the two currencies, favoring a short-term technical bounce on EUR/JPY, though downside risks remain in the mid-term.
📉 Sentiment
82% of retail traders are short EUR/JPY
Volume: 1,564 lots short vs 352 lots long
📣 This extreme sentiment imbalance suggests a potential short-term squeeze against retail traders.
📊 Market Mood & DPO
Overall mood: Neutral
DPO at -9.0, Wyckoff score below 50
Momentum remains weak, but not showing a clear divergence.
🧩 Operational Summary
Retest of the 172.50–173.30 supply zone
Likely exhaustion in that area
Ideal setup: rejection + bearish confirmation
→ Targets: 170.30, then 169.00
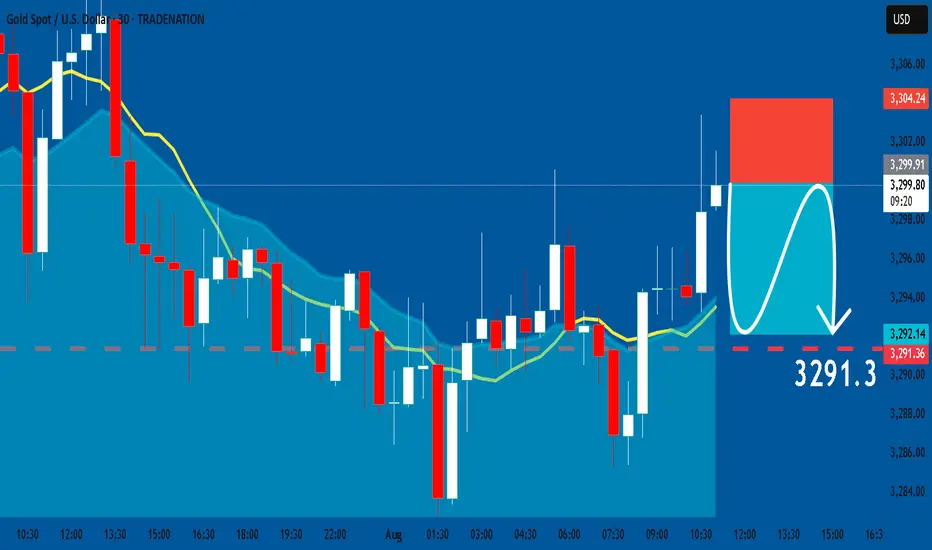
GOLD: Short Trading Opportunity
GOLD
- Classic bearish formation
- Our team expects fall
SUGGESTED TRADE:
Swing Trade
Sell GOLD
Entry Level - 3299.9
Sl - 3304.2
Tp - 3291.3
Our Risk - 1%
Start protection of your profits from lower levels
Disclosure: I am part of Trade Nation's Influencer program and receive a monthly fee for using their TradingView charts in my analysis.
❤️ Please, support our work with like & comment! ❤️