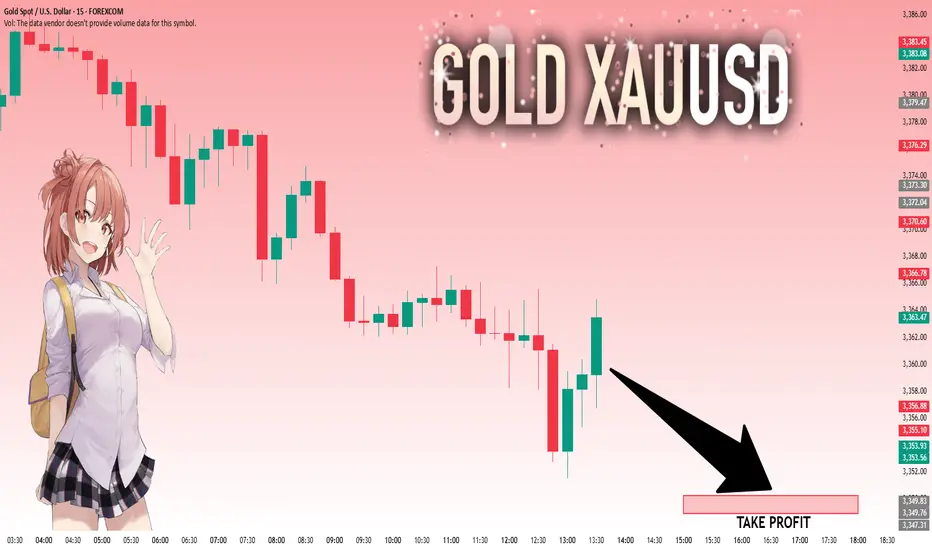
GOLD: Target Is Down! Short!
My dear friends,
Today we will analyse GOLD together☺️
The recent price action suggests a shift in mid-term momentum. A break below the current local range around 3,359.59 will confirm the new direction downwards with the target being the next key level of 3,350.22.and a reconvened placement of a stop-loss beyond the range.
❤️Sending you lots of Love and Hugs❤️
Signals
Trading balanceTrading balance The price of the asset has rebounded from the balance zone. With the prospect of growth into the resistance zone.
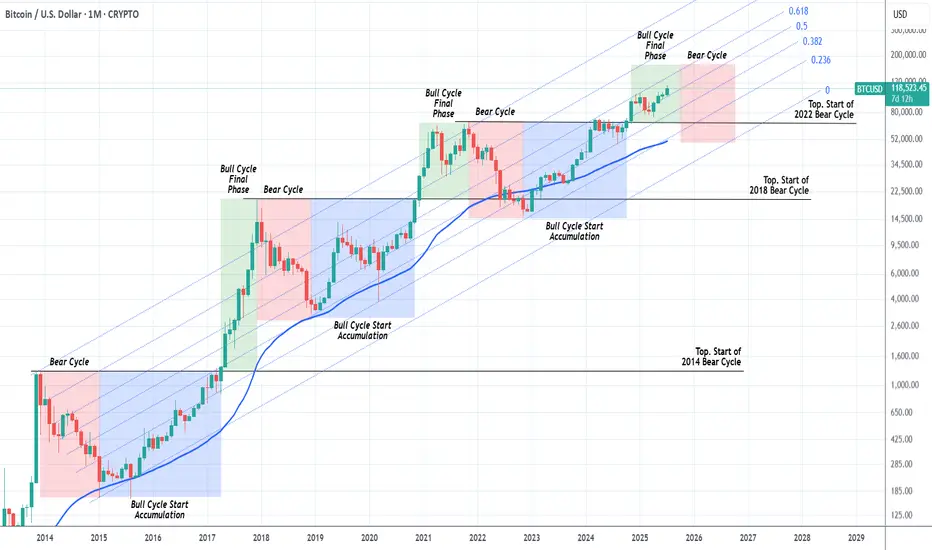
BITCOIN Should we start thinking about the next Bear Cycle yet?Bitcoin (BTCUSD) has had extremely symmetric (time-wise) Cycles in the past +10 years and this is a subject we've analyzed extensively many times. We've spent the last months projecting potential Targets for each stage of the bull run and only the last few are left.
This is exactly why we thought today's chart would be very fitting. The current Bull Cycle isn't over yet but also, based on the 4-year Cycle Theory, isn't far of either. By October 2025, that model suggests that all profit should have been taken.
As you can see, we are in the green zone, the Bull Cycle's Final Phase and since this Cycle has been trading entirely within the 0.236 - 0.618 Fibonacci Channel range, by October the price shouldn't be much higher than $160k.
In any event, this is a good guide, presented to you in a good time, to keep your mindset inside a long-term perspective and prepare you for not only the upcoming Top but also the next (1 year) Bear Cycle, which could again push the price below the 1M MA50 (blue trend-line), which would be a solid level for long-term buy positions again.
So do you think the Top is closer than it looks? Feel free to let us know in the comments section below!
-------------------------------------------------------------------------------
** Please LIKE 👍, FOLLOW ✅, SHARE 🙌 and COMMENT ✍ if you enjoy this idea! Also share your ideas and charts in the comments section below! This is best way to keep it relevant, support us, keep the content here free and allow the idea to reach as many people as possible. **
-------------------------------------------------------------------------------
💸💸💸💸💸💸
👇 👇 👇 👇 👇 👇
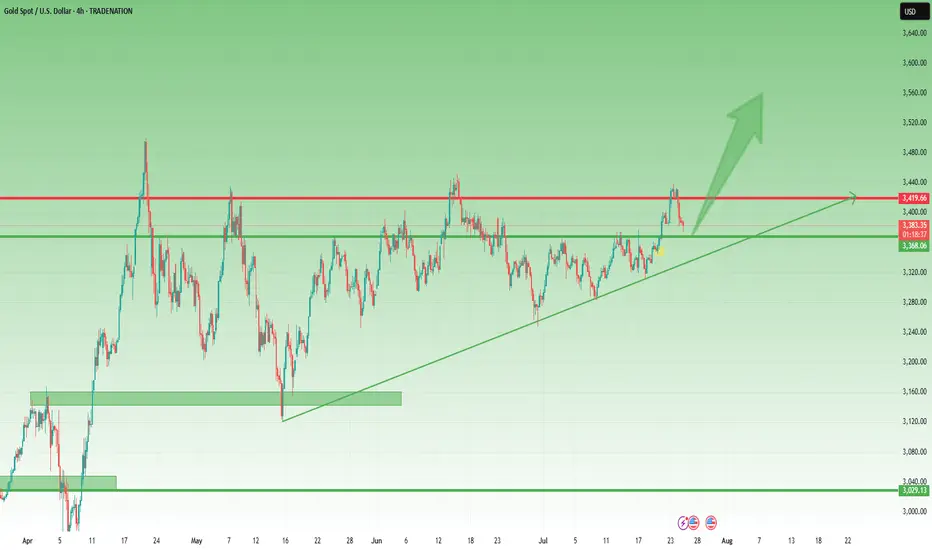
Gold Correction Went Deeper, but the Bullish Structure Intact📌 Quick recap from yesterday:
In my previous analysis, I mentioned that I was looking to buy dips around 3400, expecting a continuation move toward the ATH near 3500.
That was the plan.
But as the day unfolded, I removed my pending buy order — and explained exactly why in an educational post on how context can override entry levels.
If you read that, you already understand:
It’s not where price goes. It’s how it gets there.
________________________________________
📉 So… where are we now?
The big question is:
Was this just a deeper correction, or is Gold preparing to shift direction entirely?
In my opinion, we’re still in a healthy correction, not a reversal.
Why?
• Price remains above the horizontal support — the same level that acted as resistance last week
• The market is still above the trendline from mid-May
• No breakdown, no major structure violation — just deeper retracement after a sharp impulsive move
________________________________________
📈 What’s the plan going forward?
As long as these two supports hold, I believe the buy-the-dip narrative remains valid — even at better prices.
In fact, I already entered a new long position about an hour ago, which is currently up around 90 pips at the time of writing.
My bias stays bullish unless proven otherwise.
________________________________________
📌 Conclusion:
Yes, the correction went deeper than expected.
Yes, I removed a pending order — because the reaction was not what I wanted to see.
But structure still supports continuation, and I remain in the buy-the-dip camp as long as key support holds. 🚀
Disclosure: I am part of TradeNation's Influencer program and receive a monthly fee for using their TradingView charts in my analyses and educational articles.
follow EURUSD LION & PLANE BUY SETUPTHE PRICE has moved as I explained in the last two posts
but we have some update to go along the way
the price could break failing channel
and withdrawal liquidity and filled imbalance
hence reflect from demand zone with zero reflection as i explained in last post with rock and plane
and it will go up to take liquidity in failing channel or downtrend
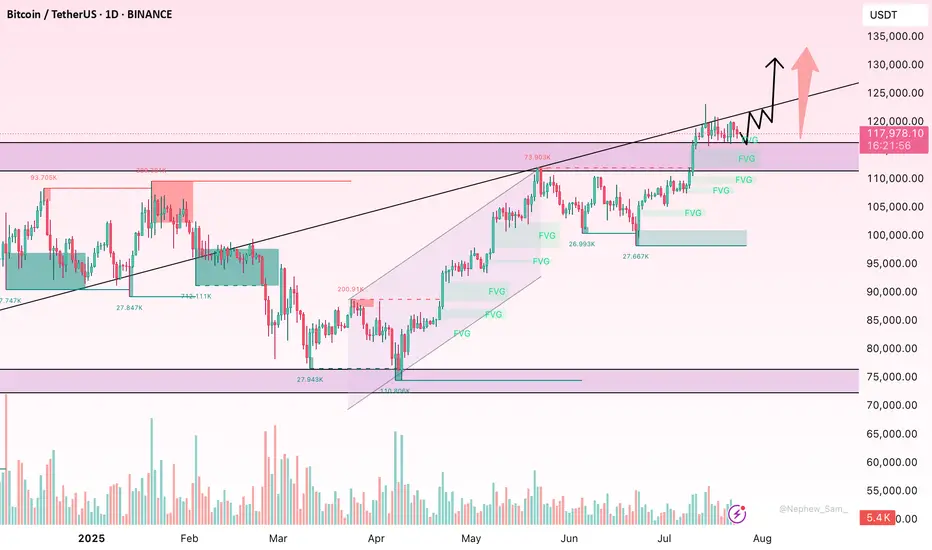
BTC Ready to Start to 125KMorning folks,
Better if you combine this update with previous idea. Now it seems that BTC stands in swamp action, flirting around 116K, which might be looking a bit bearish.
But by our view, this is not quite so. First is, triangle patterns as on daily chart as on 4H chart are look great and quite bullish. Pay attention that on 4H chart all sell-offs were bought out.
Our 1.16 lows that we set as vital ones for this scenario area still intact. So, it means that butterfly with 125K target that we discussed last time is also intact. I would say more. If you take a careful look at 1H chart - you could recognize reverse H&S pattern that could trigger all this stuff. It means that we're not in swamp, but at the point where the decision on long entry has to be made...
Take care
S.
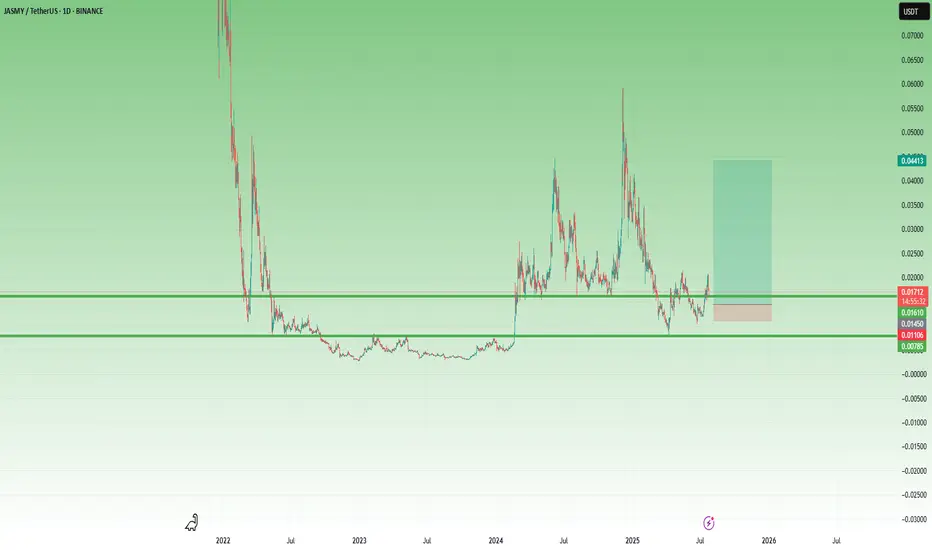
JASMY – A Volatile Setup with x3 Potential 🔸 After bottoming out at 0.003 and spending over a year in accumulation, JASMY finally broke above the key 0.008 resistance zone in February 2024. That breakout triggered a series of explosive moves – but just as violent were the drops that followed.
🔸 What stands out:
• The first post-breakout spike found a new support at 0.015.
• Then came a second vertical move toward 0.06, followed (of course) by a brutal drop.
• But… 0.008 held, and by late June, the chart printed a higher low, showing that buyers became interested.
📍 Right now, the price has reclaimed the 0.015 zone and is trying to stabilize above it. If this level holds, it could become the new base for the next wave.
💡 My plan?
This is very speculative, but I like the setup.
I’m looking to buy around 0.015–0.016, with clear negation below 0.010.
Target? Around 0.045, for a potential x3 move and a tasty 1:8 risk/reward.
⚠️ I’m not the guy who repeats the cliché “ only trade what you can afford to lose, ”
but seriously – this one is for clubbing money, not summer vacation money.
Let the volatility work in our favor. 🚀
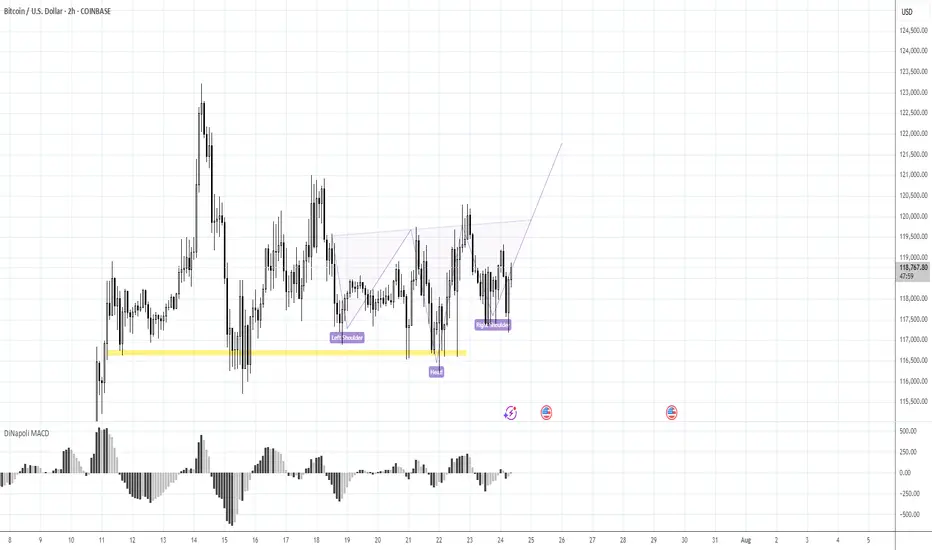
BTCUSD – Bulls Still in Control After New ATH 🔸 After the new All-Time High printed 10 days ago, Bitcoin entered a consolidation phase. So far, the market looks healthy and seems to be waiting for a trigger to continue the uptrend.
🔸 A clear support zone has formed around 116k, and as long as this level holds, bulls remain in full control of the market.
📉 For short-term traders and speculators:
Buying dips near 117.5k could offer solid risk/reward setups, with a target around 125k in case of a breakout.
Let’s see if the market gives us the trigger we’re waiting for. 🚀
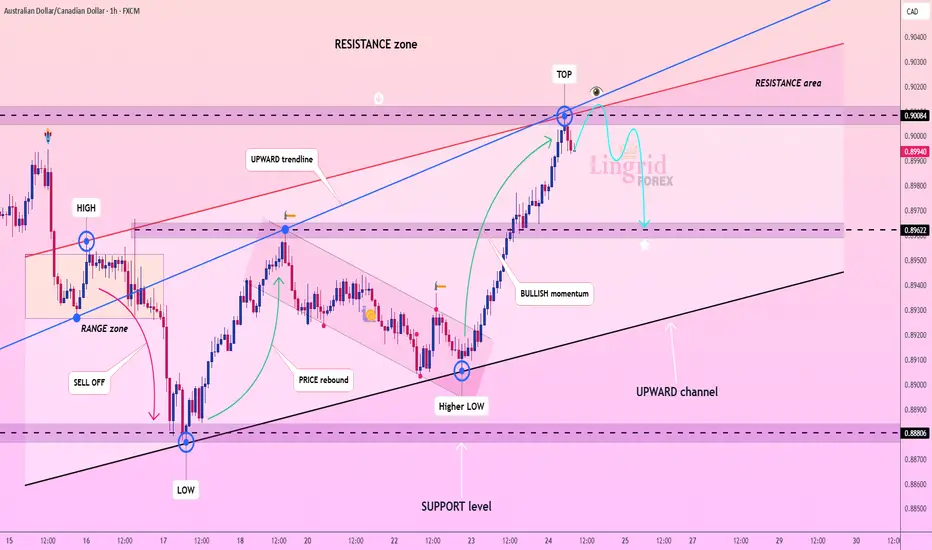
Lingrid | AUDCAD Short Following Resistance Fake Breakout The price perfectly fulfilled my last idea . FX:AUDCAD is rejecting from the top of the resistance zone after a strong bullish impulse and has started forming a rounded top pattern. Price remains inside an upward channel but is showing signs of exhaustion with the blue arrow projecting a pullback. As long as the price stays below 0.9008, we expect a descent toward the 0.8962 region. Momentum is cooling, and a bearish correction is likely before any bullish attempt resumes.
📉 Key Levels
Sell trigger: Break below 0.8990
Sell zone: 0.8995 – 0.9012
Target: 0.8962
Invalidation: Break and close above 0.9025
💡 Risks
Strong bullish momentum may resume if support holds
Failure to break 0.8990 could trap early sellers
Macro data from AUD/CAD region may disrupt the structure
If this idea resonates with you or you have your own opinion, traders, hit the comments. I’m excited to read your thoughts!
Lingrid | SUIUSDT Buying Opportunity from Support ZoneBYBIT:SUIUSDT is pulling back from the recent range top after testing the resistance zone and is approaching the key breakout area. The structure shows an upward channel with a prior consolidation breakout and an ongoing corrective retracement. As long as the price holds above the confluence zone near 3.35, the bullish structure remains intact. Broader momentum supports trend continuation toward the upper resistance boundary and the target area.
📉 Key Levels
Buy trigger: Break above 3.75 with volume
Buy zone: 3.25 – 3.35
Target: 4.24
Invalidation: Break below 3.22
💡 Risks
Breakdown below channel support would flip structure bearish
Fading volume on bounce may signal exhaustion
Broader market weakness could suppress upside momentum
If this idea resonates with you or you have your own opinion, traders, hit the comments. I’m excited to read your thoughts!

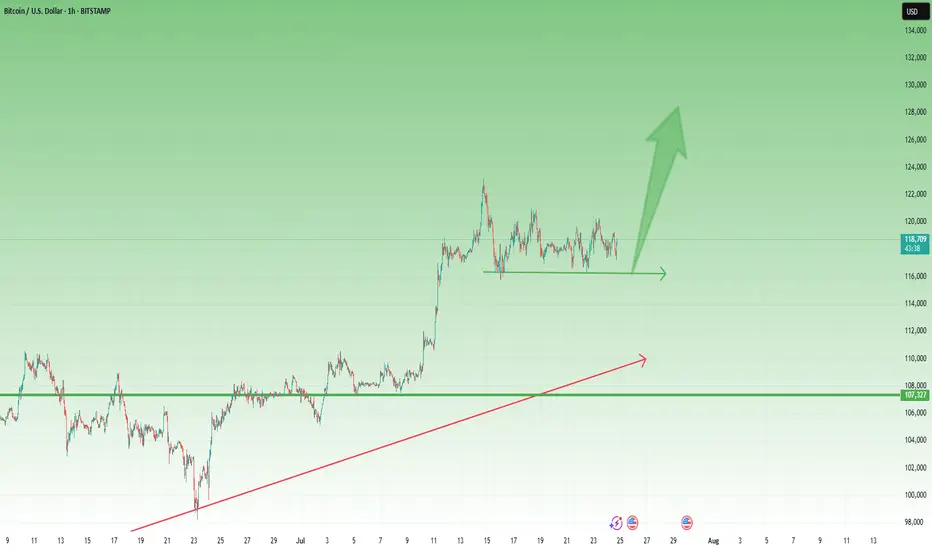
BTC Consolidates Below Key Resistance – Is a Breakout Imminent?Bitcoin is currently consolidating beneath the major psychological resistance near $120,000. The medium-term trend remains bullish, supported by a series of higher highs and higher lows. However, recent candlesticks with long upper wicks reflect hesitation among buyers at elevated levels, pointing to potential exhaustion in short-term momentum.
Despite this, there are no clear signs of bearish divergence or strong reversal patterns. The sideways range between $112,000–$120,000 likely represents a healthy consolidation phase after a strong rally. If the price maintains support around $113,000 and breaks above $120,000 with convincing volume, the next leg higher could follow swiftly.
For now, buyers remain in control, provided BTC holds key structural supports. A breakout confirmation is crucial for bullish continuation.
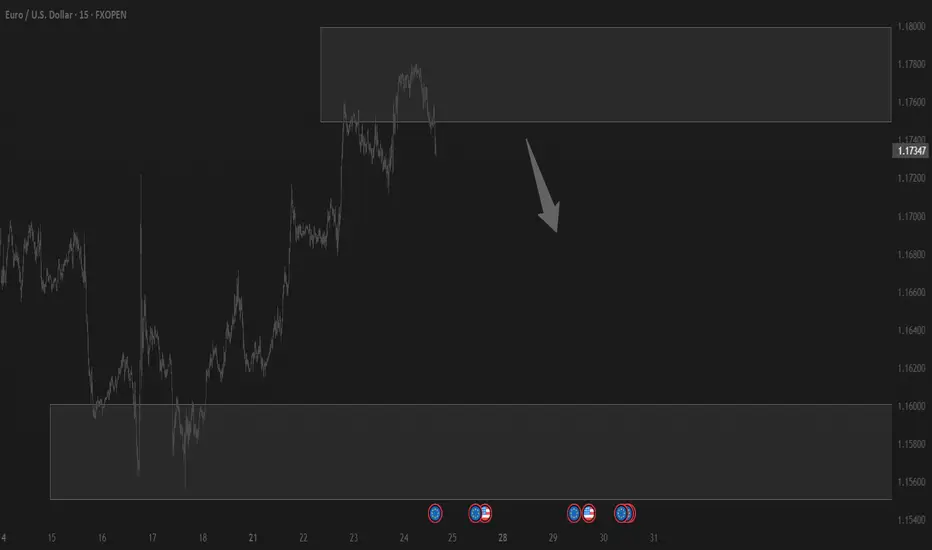
EURUSD – Bulls Still in Control, Trend ResumesIn my previous EURUSD analysis, I pointed out that the pair was nearing an important confluence support around 1.1620, and that – given the overall bullish trend – this zone could offer solid long opportunities.
What followed?
The market briefly dipped below that zone, even challenging the psychological 1.1600 round number. But instead of breaking down, bulls regrouped, stepped in with force, and pushed the pair aggressively higher.
📍 At the time of writing, EURUSD is trading at 1.1770, and my long trade is running with a comfortable 150 pips profit.
🔍 W hat’s Next?
The current structure suggests a continuation of the uptrend, and the logical technical target is the recent high at 1.1830.
Until proven otherwise, this is still a buy-the-dip market.
✅ Buying around 1.1700 could be a valid setup, especially if we see buying power on the intraday chart
⚠️ The Warning Sign
Despite the bullish bias, keep in mind:
If EURUSD drops and closes below 1.1670, the structure begins to shift — and this could signal a deeper correction or even trend reversal.
📌 Until then, the bias remains bullish, dips are to be watched for entries, and 1.1830 is the next checkpoint.
D isclosure: I am part of TradeNation's Influencer program and receive a monthly fee for using their TradingView charts in my analyses and educational articles.
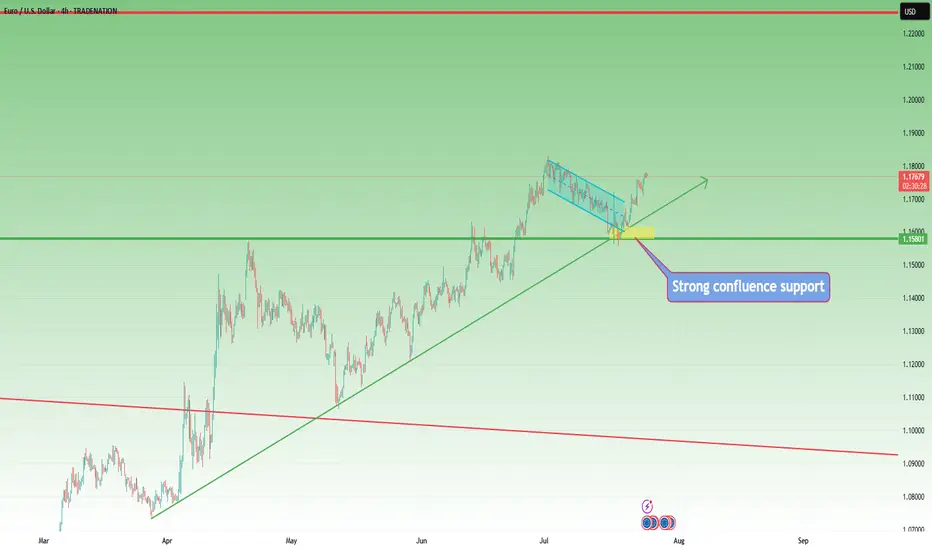
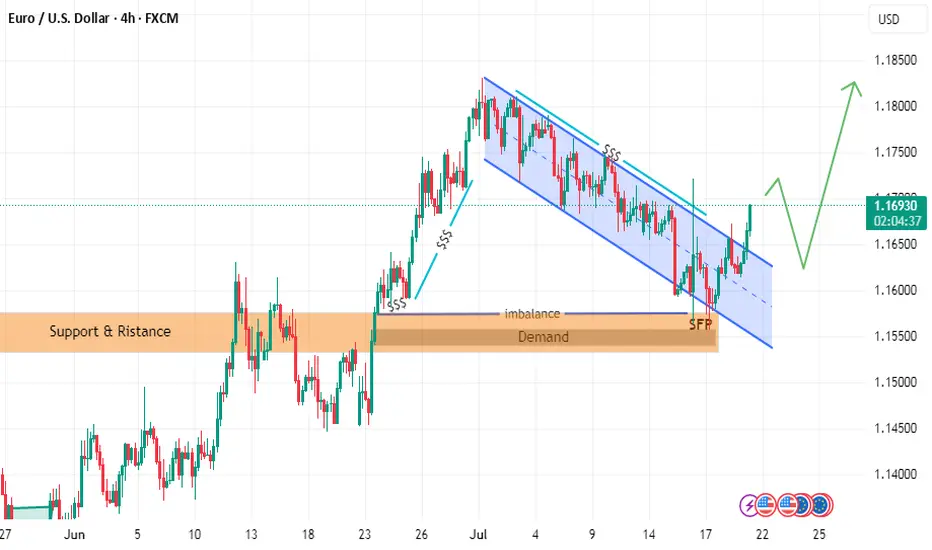
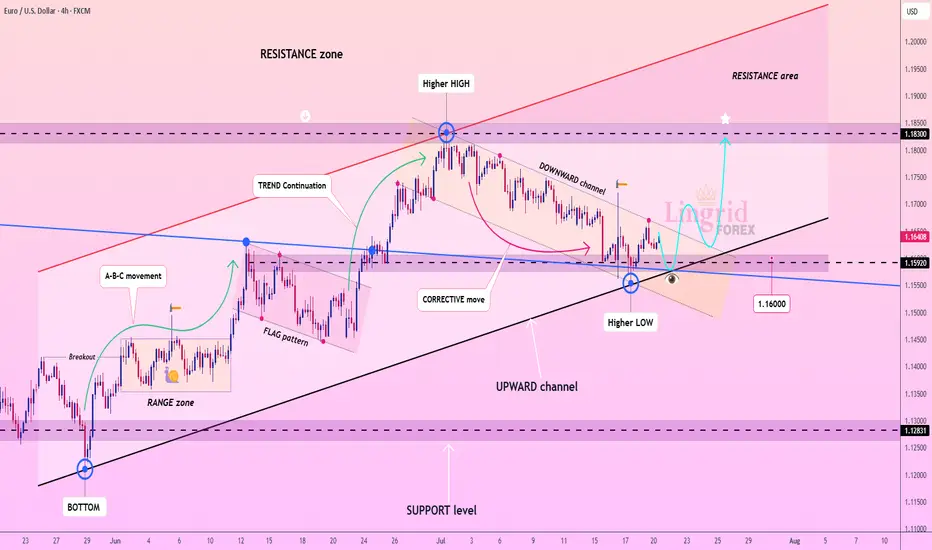
Lingrid | EURUSD Potential Surge Following Channel BreakoutFX:EURUSD is consolidating after bouncing from a key confluence of support around 1.16000 and forming a higher low within the upward channel. The recent corrective pullback through a downward channel now appears complete, with bullish structure resuming. Price is likely to advance toward the 1.18300 resistance as long as the 1.15900 zone holds. Momentum favors a continuation of the A-B-C and trend continuation sequences already established.
📉 Key Levels
Buy trigger: Break above 1.16500
Buy zone: 1.16000–1.16250
Target: 1.18300
Invalidation: Close below 1.14500
💡 Risks
Failure to break the corrective channel resistance
Bearish divergence on lower timeframes
Broader USD strength reversal
If this idea resonates with you or you have your own opinion, traders, hit the comments. I’m excited to read your thoughts!
Lingrid | SOLUSDT Pullback Opportunity From the Support ZoneThe price perfectly fulfilled my previous idea . BINANCE:SOLUSDT is gaining upside traction after a clean breakout from the range zone and reclaim of the upward trendline near the 188.46 area. Bullish momentum from the higher low confirms buyers' control inside the rising channel, and price is now consolidating above key support. As long as the price holds above 188, the bias favors another move into the 220.00 resistance region. This ascending pattern reinforces the bullish structure with a likely continuation toward the upper boundary.
📉 Key Levels
Buy trigger: Break above 202.00
Buy zone: 188.00–194.00
Target: 220.00
Invalidation: Close below 188.46
💡 Risks
Failure to hold above 188.00 support
Loss of momentum after breakout
Macro-driven volatility reversal
If this idea resonates with you or you have your own opinion, traders, hit the comments. I’m excited to read your thoughts!

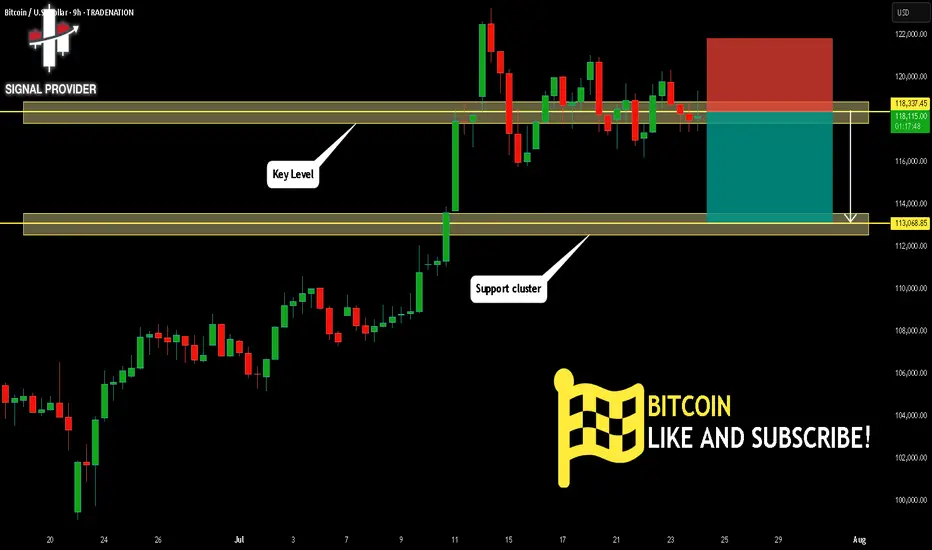
BITCOIN Will Fall! Short!
Take a look at our analysis for BITCOIN.
Time Frame: 9h
Current Trend: Bearish
Sentiment: Overbought (based on 7-period RSI)
Forecast: Bearish
The market is approaching a key horizontal level 118,337.45.
Considering the today's price action, probabilities will be high to see a movement to 113,068.85.
P.S
We determine oversold/overbought condition with RSI indicator.
When it drops below 30 - the market is considered to be oversold.
When it bounces above 70 - the market is considered to be overbought.
Disclosure: I am part of Trade Nation's Influencer program and receive a monthly fee for using their TradingView charts in my analysis.
Like and subscribe and comment my ideas if you enjoy them!
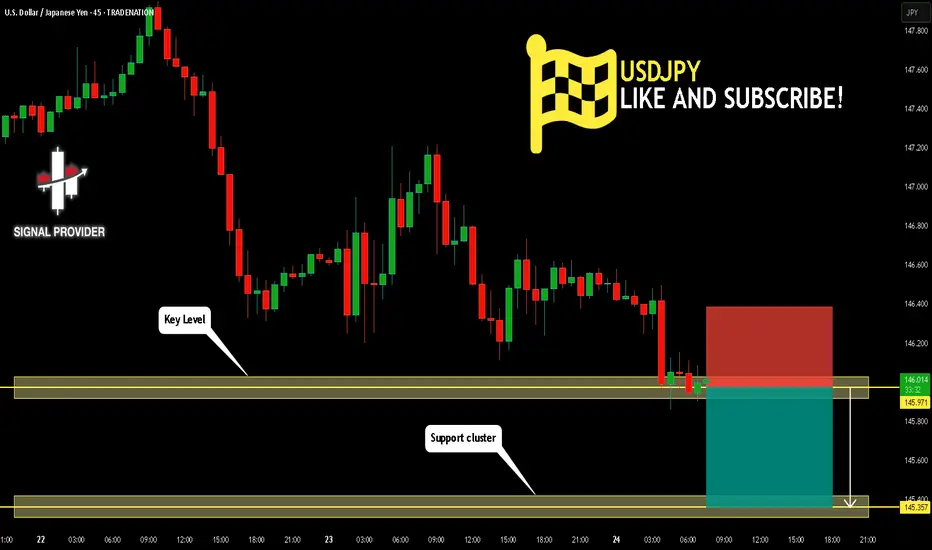
USDJPY Will Go Lower From Resistance! Sell!
Please, check our technical outlook for USDJPY.
Time Frame: 45m
Current Trend: Bearish
Sentiment: Overbought (based on 7-period RSI)
Forecast: Bearish
The market is approaching a significant resistance area 145.971.
Due to the fact that we see a positive bearish reaction from the underlined area, I strongly believe that sellers will manage to push the price all the way down to 145.357 level.
P.S
Overbought describes a period of time where there has been a significant and consistent upward move in price over a period of time without much pullback.
Disclosure: I am part of Trade Nation's Influencer program and receive a monthly fee for using their TradingView charts in my analysis.
Like and subscribe and comment my ideas if you enjoy them!
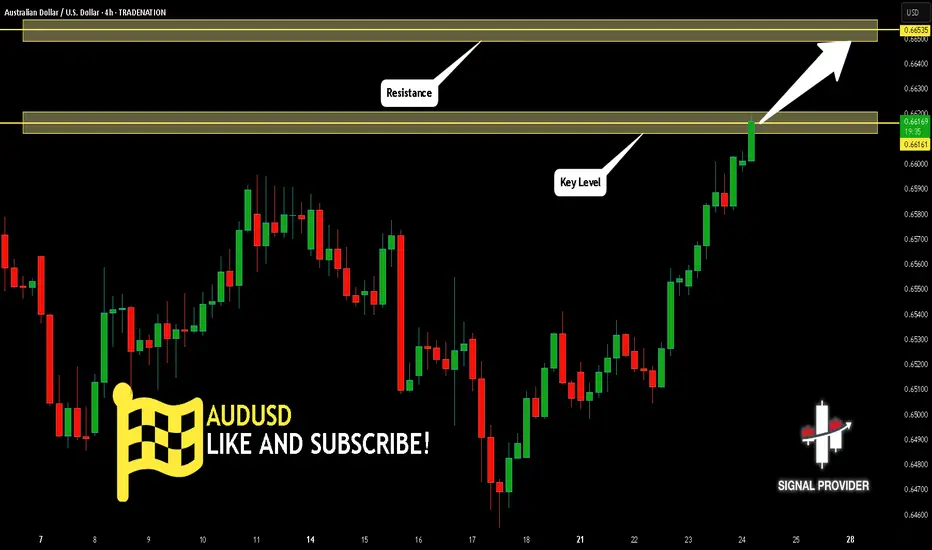
AUDUSD Will Go Up From Support! Long!
Here is our detailed technical review for AUDUSD.
Time Frame: 4h
Current Trend: Bullish
Sentiment: Oversold (based on 7-period RSI)
Forecast: Bullish
The market is on a crucial zone of demand 0.661.
The oversold market condition in a combination with key structure gives us a relatively strong bullish signal with goal 0.665 level.
P.S
Please, note that an oversold/overbought condition can last for a long time, and therefore being oversold/overbought doesn't mean a price rally will come soon, or at all.
Disclosure: I am part of Trade Nation's Influencer program and receive a monthly fee for using their TradingView charts in my analysis.
Like and subscribe and comment my ideas if you enjoy them!
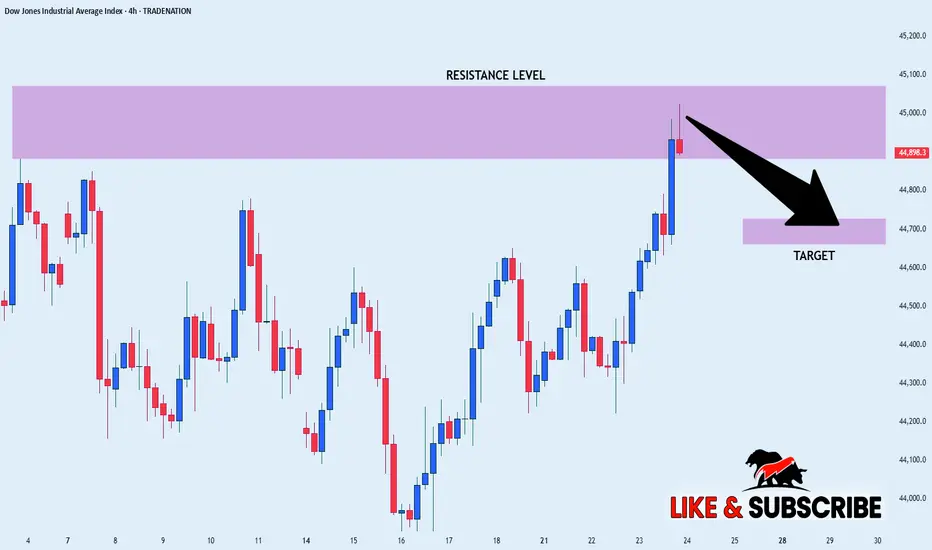
US30 SHORT FORM RESISTANCE|
✅DOW JONES index keeps
Growing in a strong uptrend
And we are bullish biased long-term
However the price has hit an all-time-high
Resistance level of 45,072(which can be seen
Further left you zoom out on higher TF)
So as we are already seeing a local
Bearish reaction we will be
Expecting a local bearish correction
SHORT🔥
✅Like and subscribe to never miss a new idea!✅
Disclosure: I am part of Trade Nation's Influencer program and receive a monthly fee for using their TradingView charts in my analysis.
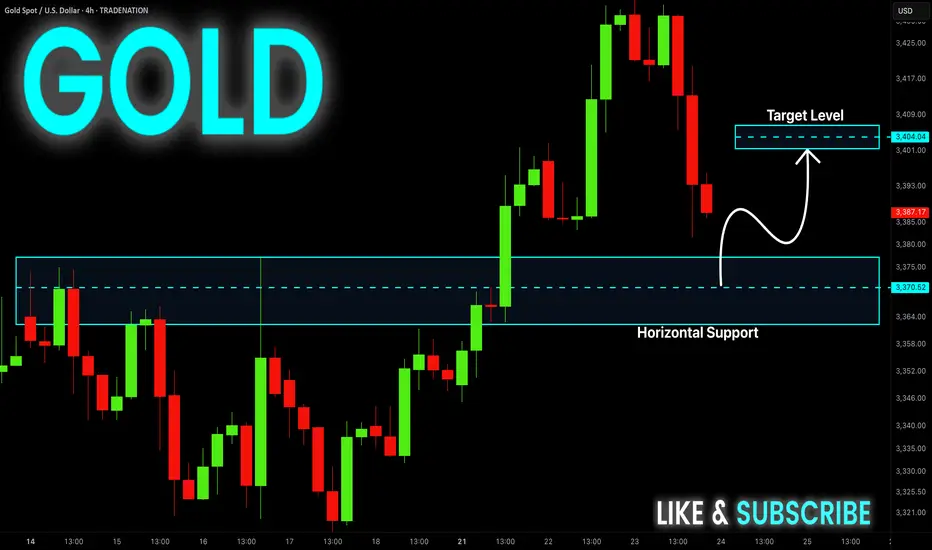
GOLD Rebound Ahead! Buy!
Hello,Traders!
GOLD is falling down now
But will soon hit a horizontal
Support level of 3375$
And as we are bullish biased
We will be expecting a rebound
And a local bullish correction
Buy!
Comment and subscribe to help us grow!
Check out other forecasts below too!
Disclosure: I am part of Trade Nation's Influencer program and receive a monthly fee for using their TradingView charts in my analysis.
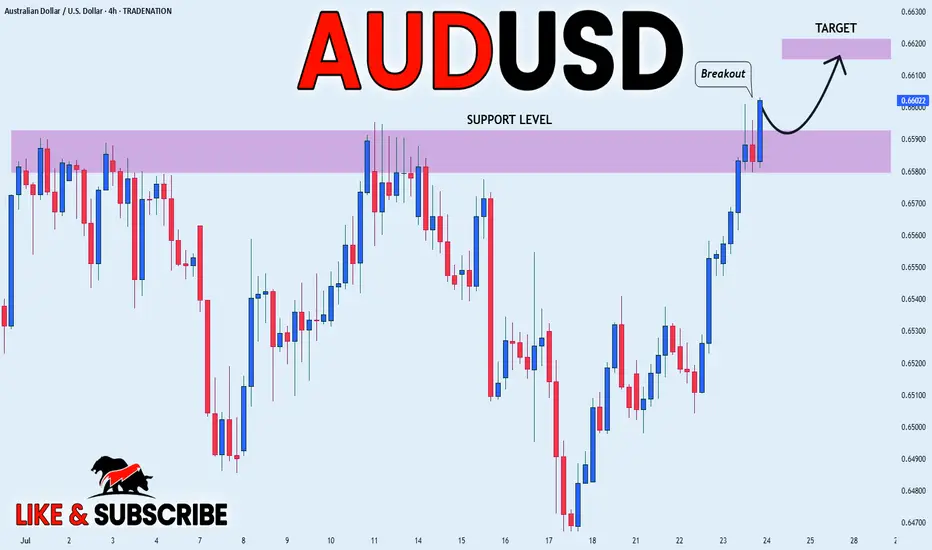
AUD_USD BULLISH BREAKOUT|LONG|
✅AUD_USD is going up
Now and the pair made a bullish
Breakout of the key horizontal
Level of 0.6590 and the breakout
Is confirmed so we are bullish
Biased and we will be expecting
A further bullish move up
LONG🚀
✅Like and subscribe to never miss a new idea!✅
Disclosure: I am part of Trade Nation's Influencer program and receive a monthly fee for using their TradingView charts in my analysis.
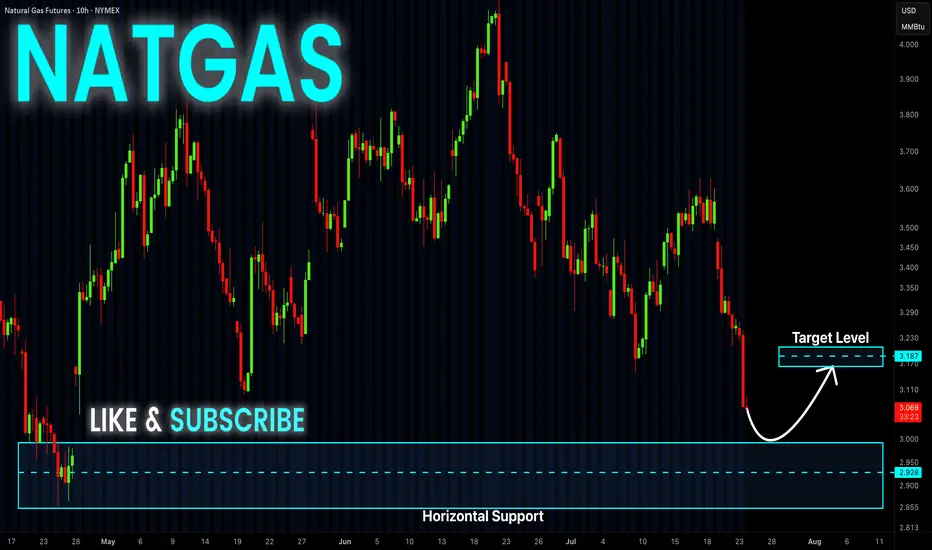
NATGAS Support Ahead! Buy!
Hello,Traders!
NATGAS keeps falling but
A strong horizontal support
Level is ahead at 3.00$ so
After Gas retests the support
We will be expecting a local
Bullish rebound
Buy!
Comment and subscribe to help us grow!
Check out other forecasts below too!
Disclosure: I am part of Trade Nation's Influencer program and receive a monthly fee for using their TradingView charts in my analysis.
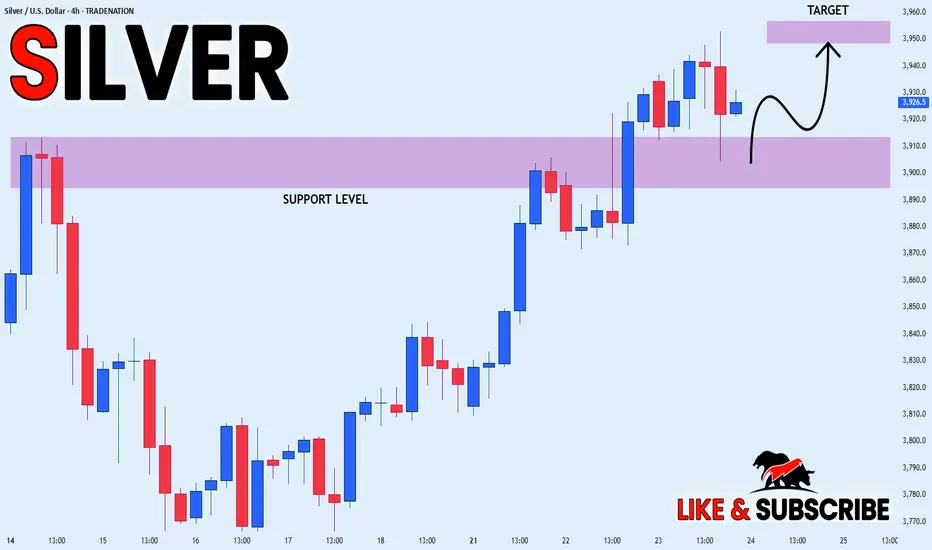
SILVER WILL KEEP GROWING|LONG|
✅SILVER is trading in an
Uptrend and the price made
A retest of the horizontal support
Level of 39.10$ and we are already
Seeing a bullish reaction so we
Are bullish biased and we will be
Expecting a further bullish move up
LONG🚀
✅Like and subscribe to never miss a new idea!✅
Disclosure: I am part of Trade Nation's Influencer program and receive a monthly fee for using their TradingView charts in my analysis.
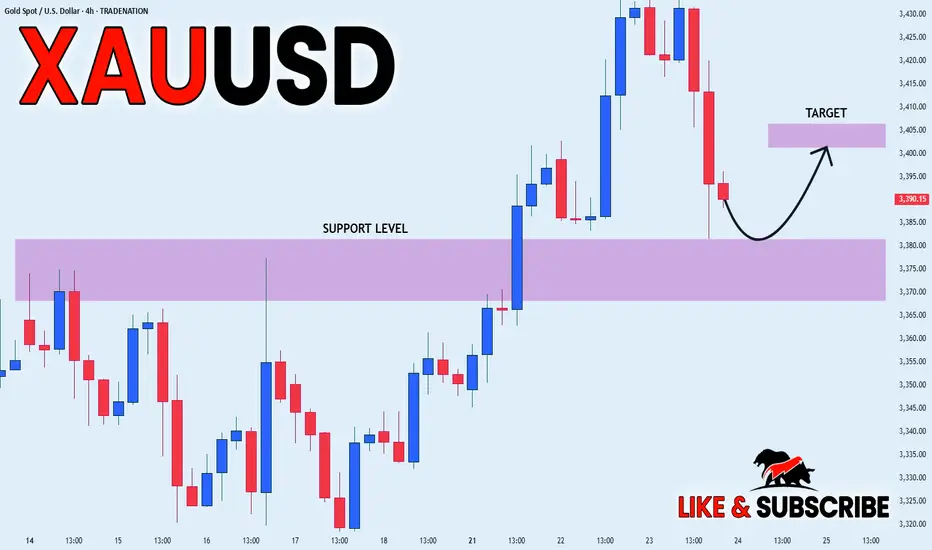
GOLD LOCAL LONG|
✅GOLD went down from
The resistance just as I predicted
But a strong support level is ahead at 3380$
Thus I am expecting a rebound
And a move up towards the target of 3400$
LONG🚀
✅Like and subscribe to never miss a new idea!✅
Disclosure: I am part of Trade Nation's Influencer program and receive a monthly fee for using their TradingView charts in my analysis.