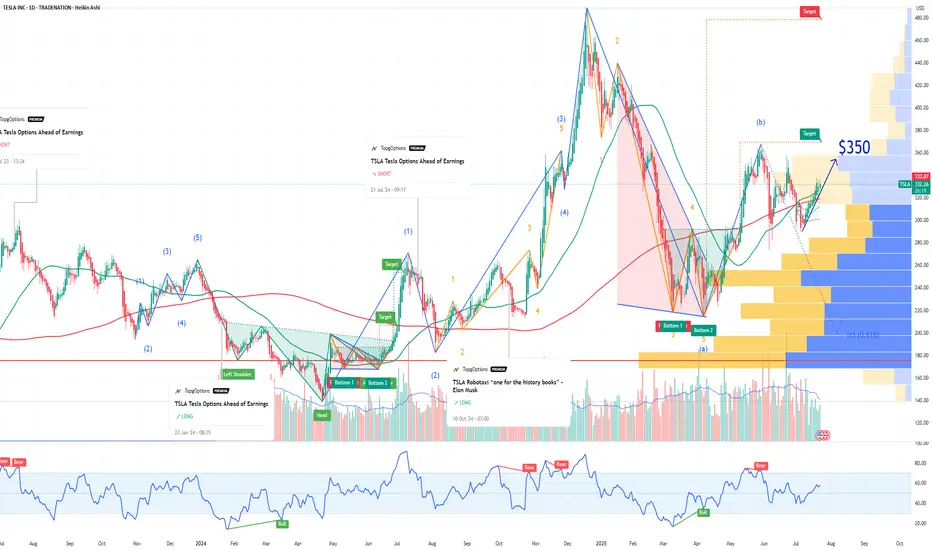
TSLA Tesla Options Ahead of EarningsIf you haven`t bought TSLA before the recent rally:
Now analyzing the options chain and the chart patterns of TSLA Tesla prior to the earnings report this week,
I would consider purchasing the 350usd strike price Calls with
an expiration date of 2025-8-15,
for a premium of approximately $14.90.
If these options prove to be profitable prior to the earnings release, I would sell at least half of them.
Disclosure: I am part of Trade Nation's Influencer program and receive a monthly fee for using their TradingView charts in my analysis.
Signals
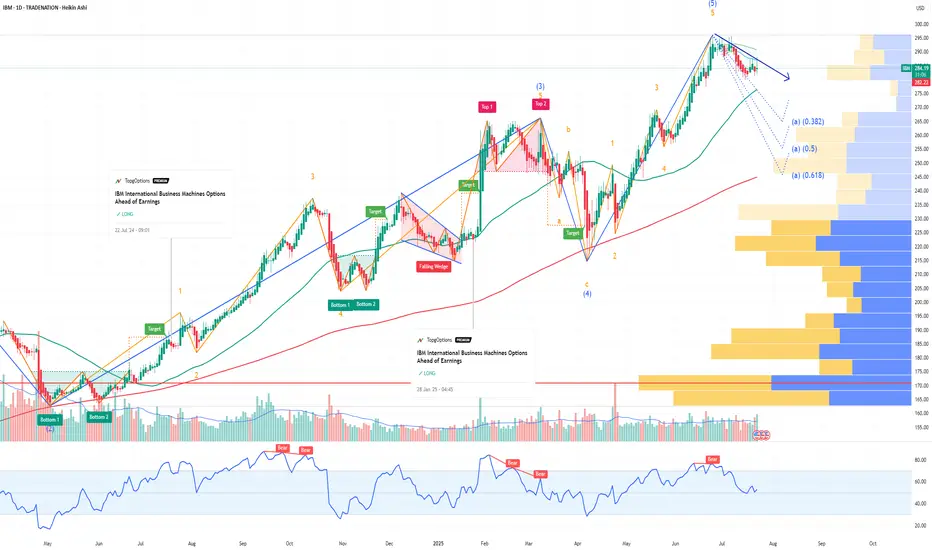
IBM International Business Machines Options Ahead of EarningsIf you haven`t bought IBM before the rally:
Now analyzing the options chain and the chart patterns of IBM International Business Machines prior to the earnings report this week,
I would consider purchasing the 290usd strike price Puts with
an expiration date of 2025-9-19,
for a premium of approximately $17.30.
If these options prove to be profitable prior to the earnings release, I would sell at least half of them.
Disclosure: I am part of Trade Nation's Influencer program and receive a monthly fee for using their TradingView charts in my analysis.
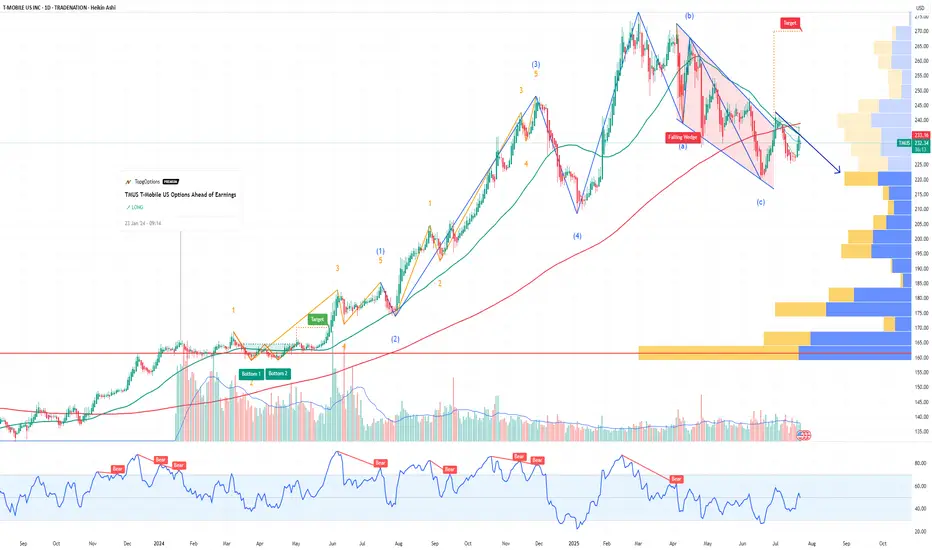
TMUS T-Mobile US Options Ahead of EarningsIf you haven`t bought TMUS before the rally:
Now analyzing the options chain and the chart patterns of TMUS T-Mobile US prior to the earnings report this week,
I would consider purchasing the 227.5usd strike price Puts with
an expiration date of 2025-7-25,
for a premium of approximately $3.50.
If these options prove to be profitable prior to the earnings release, I would sell at least half of them.
Disclosure: I am part of Trade Nation's Influencer program and receive a monthly fee for using their TradingView charts in my analysis.
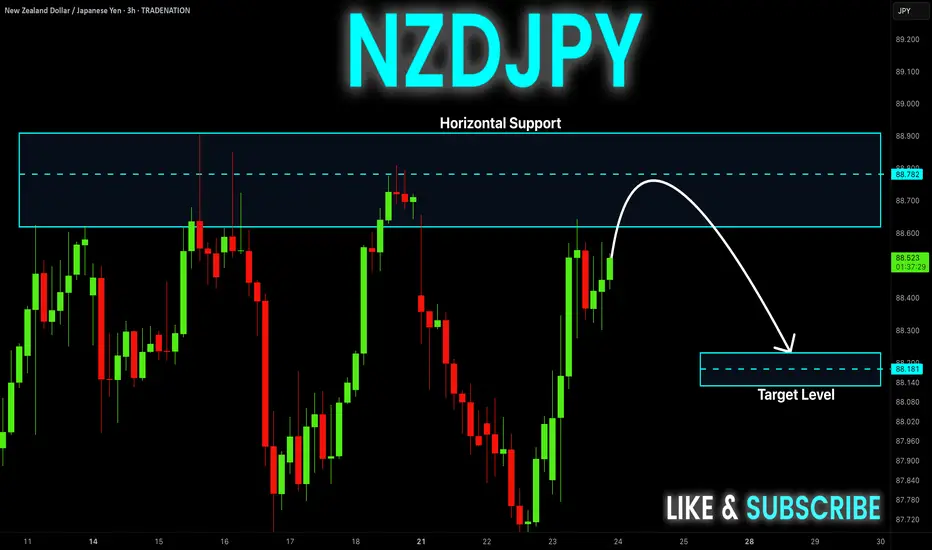
NZD-JPY Resistance Ahead! Sell!
Hello,Traders!
NZD-JPY is trading in an
Uptrend but the pair is locally
Overbought so after the pair
Hits the horizontal resistance
Level of 88.900 we will be
Expecting a local bearish
Move down
Sell!
Comment and subscribe to help us grow!
Check out other forecasts below too!
Disclosure: I am part of Trade Nation's Influencer program and receive a monthly fee for using their TradingView charts in my analysis.
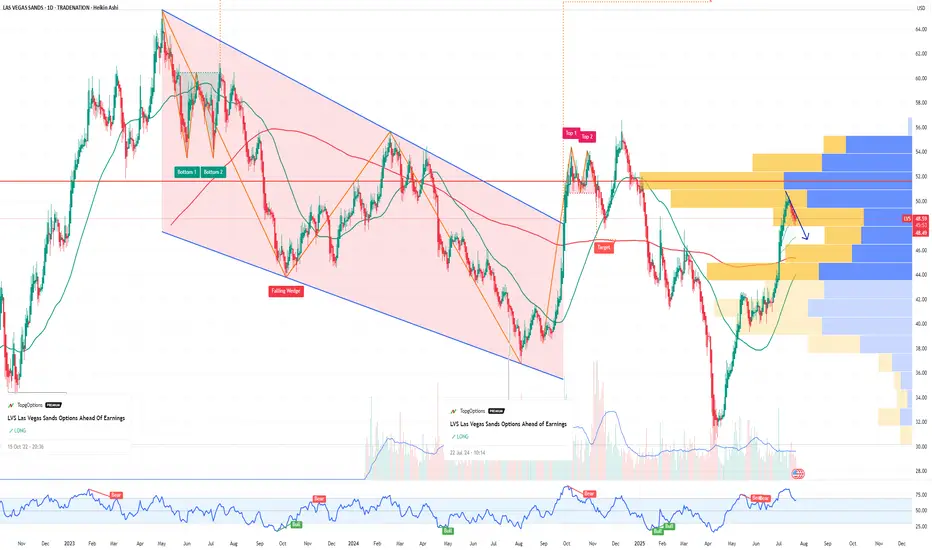
LVS Las Vegas Sands Options Ahead of EarningsIf you haven`t bought LVS before the rally:
Now analyzing the options chain and the chart patterns of LVS Las Vegas Sands prior to the earnings report this week,
I would consider purchasing the 48.5usd strike price Puts with
an expiration date of 2025-7-25,
for a premium of approximately $1.22.
If these options prove to be profitable prior to the earnings release, I would sell at least half of them.
Disclosure: I am part of Trade Nation's Influencer program and receive a monthly fee for using their TradingView charts in my analysis.
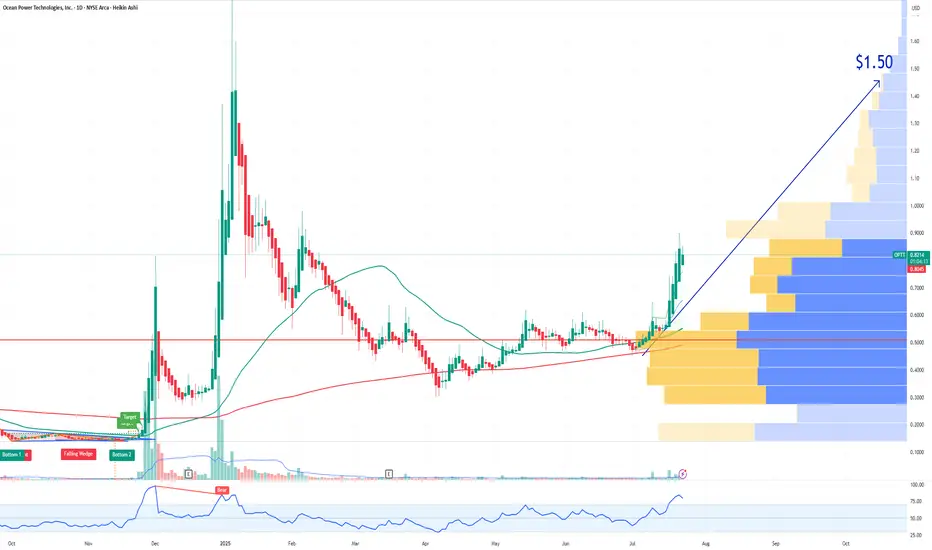
OPTT Ocean Power Technologies Options Ahead of EarningsAnalyzing the options chain and the chart patterns of OPTT Ocean Power Technologies prior to the earnings report this week,
I would consider purchasing the 1.50usd strike price Calls with
an expiration date of 2025-11-21,
for a premium of approximately $0.25.
If these options prove to be profitable prior to the earnings release, I would sell at least half of them.
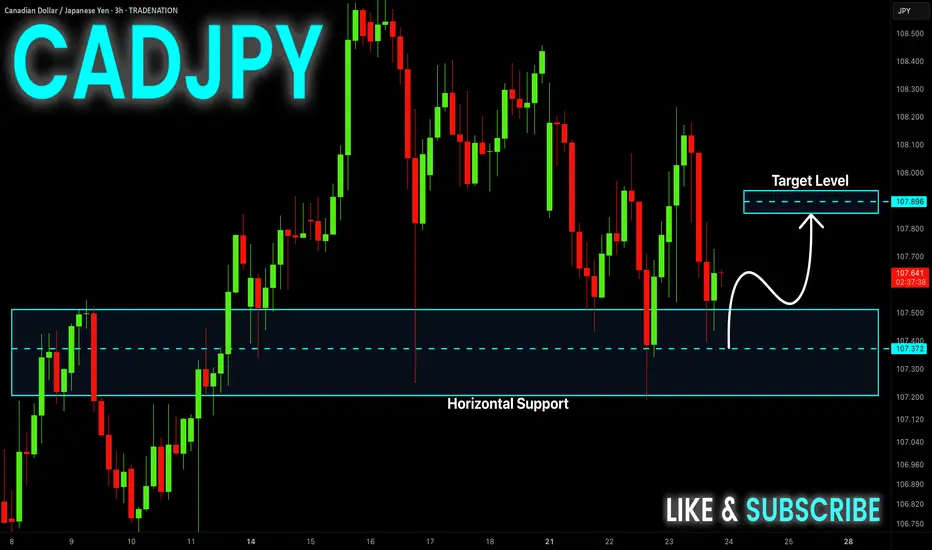
CAD-JPY Local Long! Buy!
Hello,Traders!
CAD-JPY made a retest
Of the horizontal support
Level of 107.400 and we
Are already seeing a bullish
Rebound and we will be
Expecting a further local
Bullish move up
Buy!
Comment and subscribe to help us grow!
Check out other forecasts below too!
Disclosure: I am part of Trade Nation's Influencer program and receive a monthly fee for using their TradingView charts in my analysis.
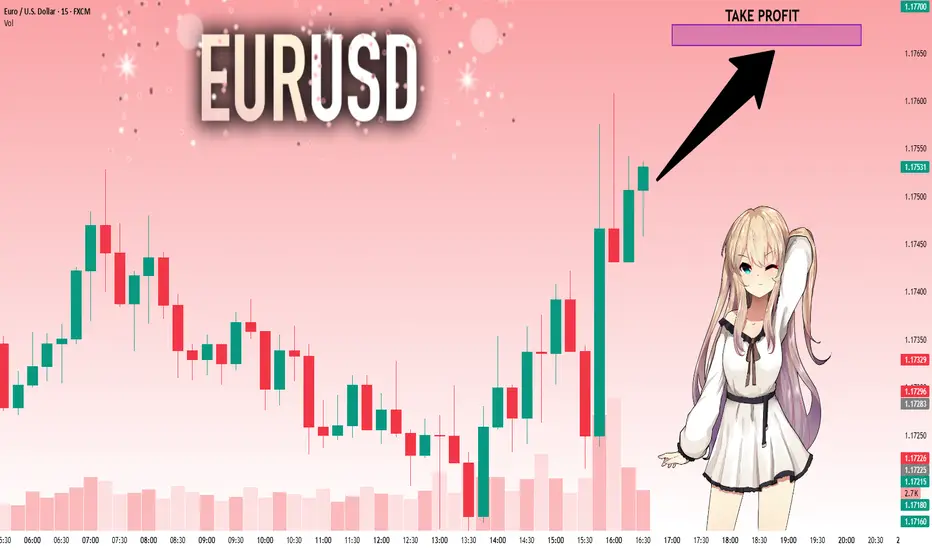
EURUSD: Strong Growth Ahead! Long!
My dear friends,
Today we will analyse EURUSD together☺️
The market is at an inflection zone and price has now reached an area around 1.17463 where previous reversals or breakouts have occurred.And a price reaction that we are seeing on multiple timeframes here could signal the next move up so we can enter on confirmation, and target the next key level of 1.17589.Stop-loss is recommended beyond the inflection zone.
❤️Sending you lots of Love and Hugs❤️
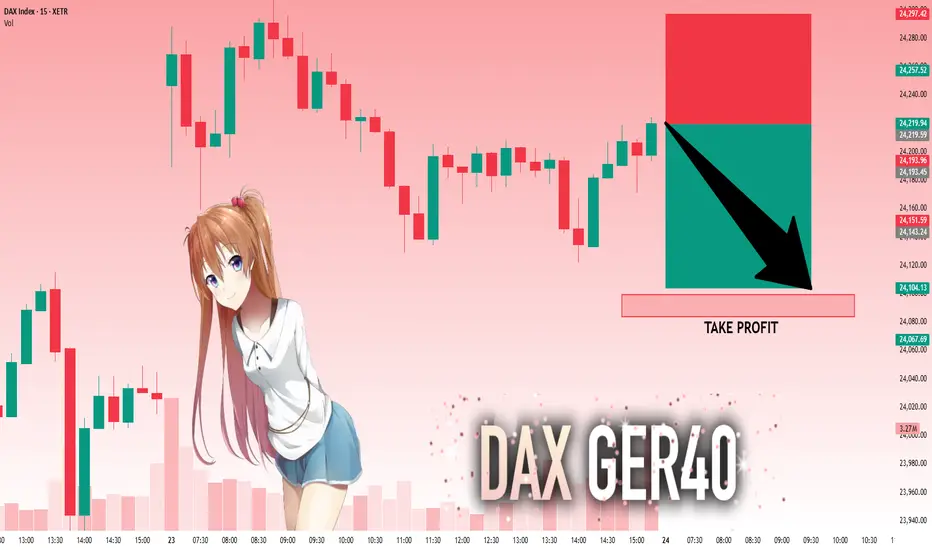
DAX: Target Is Down! Short!
My dear friends,
Today we will analyse DAX together☺️
The recent price action suggests a shift in mid-term momentum. A break below the current local range around 24,219.59 will confirm the new direction downwards with the target being the next key level of 24,099.27.and a reconvened placement of a stop-loss beyond the range.
❤️Sending you lots of Love and Hugs❤️
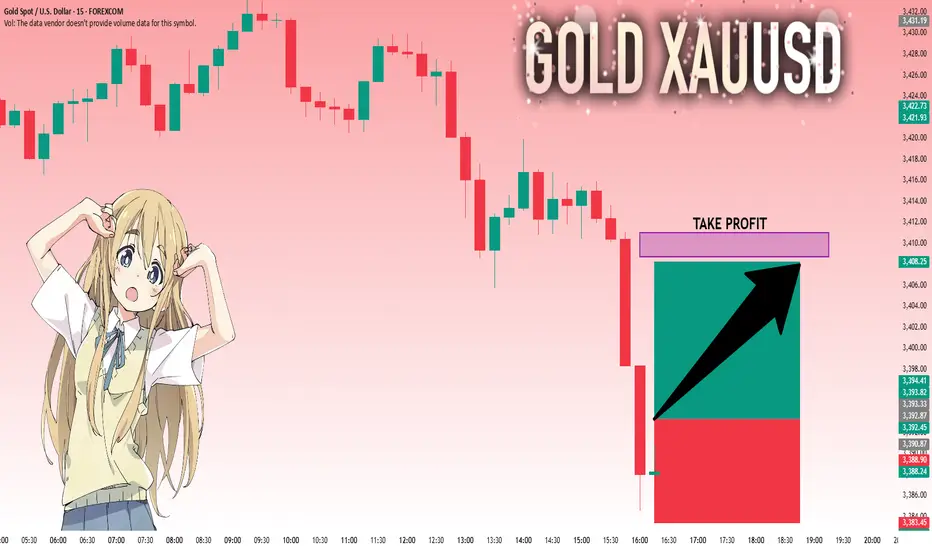
GOLD: Move Up Expected! Long!
My dear friends,
Today we will analyse GOLD together☺️
The in-trend continuation seems likely as the current long-term trend appears to be strong, and price is holding above a key level of 3,393.33 So a bullish continuation seems plausible, targeting the next high. We should enter on confirmation, and place a stop-loss beyond the recent swing level.
❤️Sending you lots of Love and Hugs❤️
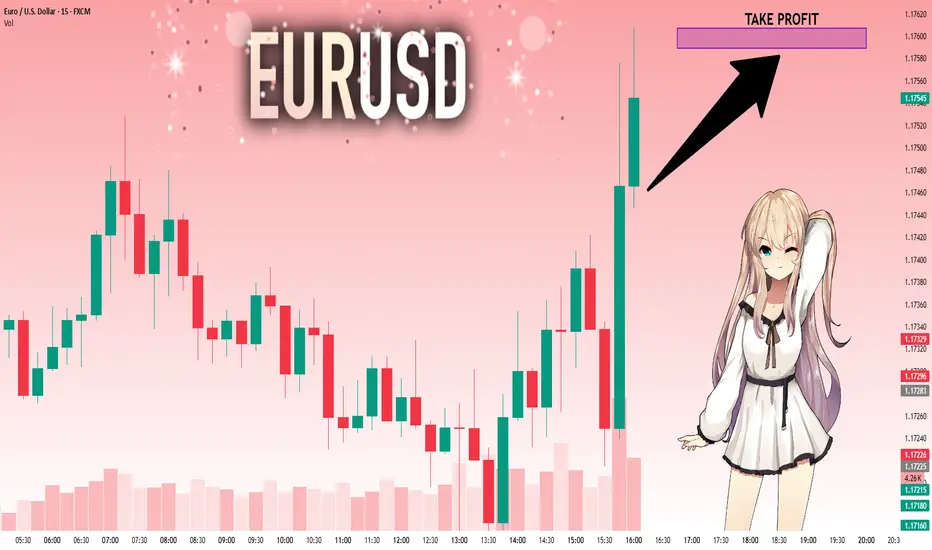
EURUSD: Strong Growth Ahead! Long!
My dear friends,
Today we will analyse GOLD together☺️
The market is at an inflection zone and price has now reached an area around 1.17463 where previous reversals or breakouts have occurred.And a price reaction that we are seeing on multiple timeframes here could signal the next move up so we can enter on confirmation, and target the next key level of 1.17589.Stop-loss is recommended beyond the inflection zone.
❤️Sending you lots of Love and Hugs❤️
SILVER: Will Go Down! Short!
My dear friends,
Today we will analyse SILVER together☺️
The price is near a wide key level
and the pair is approaching a significant decision level of 39.520 Therefore, a strong bearish reaction here could determine the next move down.We will watch for a confirmation candle, and then target the next key level of 39.416..Recommend Stop-loss is beyond the current level.
❤️Sending you lots of Love and Hugs❤️

$TMO, Long, TP>15-25%NYSE:TMO , Long, TP>15-25%
Fundamentally the stock is good.
Choose an entry point and do not forget about a protective order if you are trading with leverage.
Don't risk it if you're not sure.
Good luck to everyone.
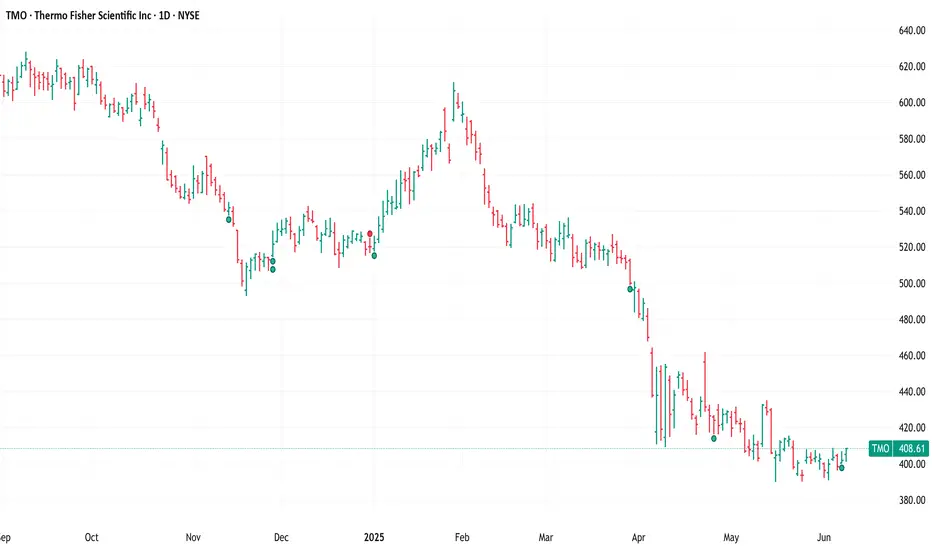
Trading balanceTrading balance The price of the asset has rebounded from the balance zone. With the prospect of growth into the resistance zone.
EUR/USD - Holding Bullish Structure Above Key Fibs and TrendlineTechnical Overview:
EUR/USD continues to respect its ascending channel structure, currently rebounding from the lower trendline support while trading above the 50 EMA and 200 EMA. After a healthy retracement to the monthly support (1.16128), the pair has shown strong buying interest, supported by bullish RSI divergence from oversold conditions on the 8H chart.
Key Levels:
Support Zone: 1.1613 – 1.1634 (Fib Cluster + Channel Support + Monthly Support)
Resistance Zone: 1.1755 (Weekly Resistance) followed by 1.1816 (0.27 Fib Extension) and 1.1887 (0.618 Extension)
Invalidation Level: Below 1.1533 (1.272 Fib + Structural Breakdown)
Confluences:
Price broke above a descending correctional trendline, indicating a potential bullish continuation.
Multiple Fibonacci levels (0.382, 0.5, 0.618) have stacked around the previous consolidation area, increasing probability of a sustained move.
RSI bounce from below 40 suggests short-term momentum reversal.
Trade Idea:
We may see a minor pullback into the 1.16344–1.1659 area before a potential continuation higher. Conservative bulls may wait for a retest of this zone with a bullish engulfing or pin bar confirmation before entering long.
Targets:
First target at 1.1755 (prior weekly resistance)
Second target at 1.1816 (Fib extension)
Final target near 1.1887 (major resistance / upper channel boundary)
Risk Management:
A break and close below 1.1533 would invalidate the bullish setup and signal potential bearish pressure returning to the pair.

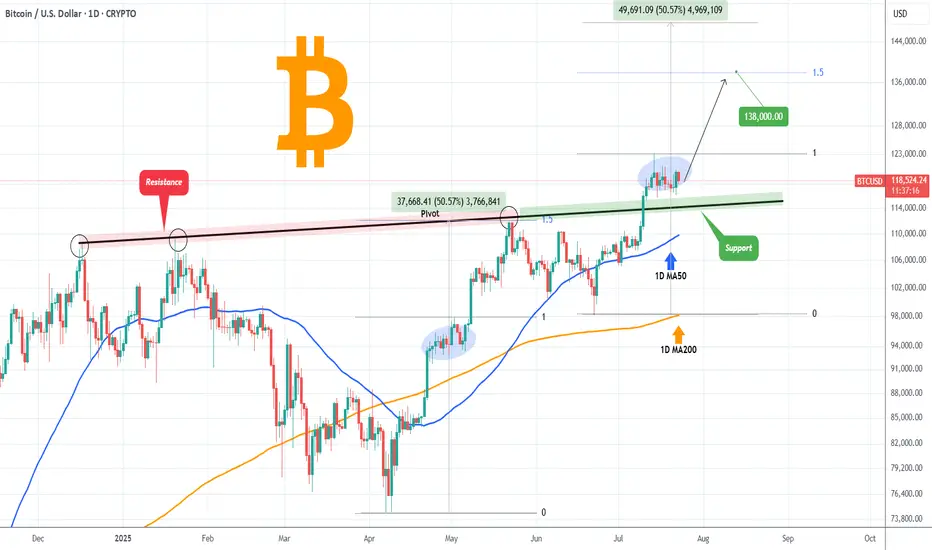
BITCOIN Former Resistance turned Support!Bitcoin (BTCUSD) is consolidating right above the December 17 2024 Pivot trend-line, a level that started off as a massive Resistance delivering two strong rejections but has now been turned into Support, holding this consolidation.
The 1D MA50 (blue trend-line) will soon cross this Pivot trend-line and will confirm it as a Support with the price technically looking for a new Bullish Leg towards the 1.5 Fibonacci extension at least ($138000), similar to the April - May uptrend, which also consisted of an Accumulation Phase much like the current.
Can the Pivot trend-line provide the necessary support for such a rebound? Feel free to let us know in the comments section below!
-------------------------------------------------------------------------------
** Please LIKE 👍, FOLLOW ✅, SHARE 🙌 and COMMENT ✍ if you enjoy this idea! Also share your ideas and charts in the comments section below! This is best way to keep it relevant, support us, keep the content here free and allow the idea to reach as many people as possible. **
-------------------------------------------------------------------------------
💸💸💸💸💸💸
👇 👇 👇 👇 👇 👇
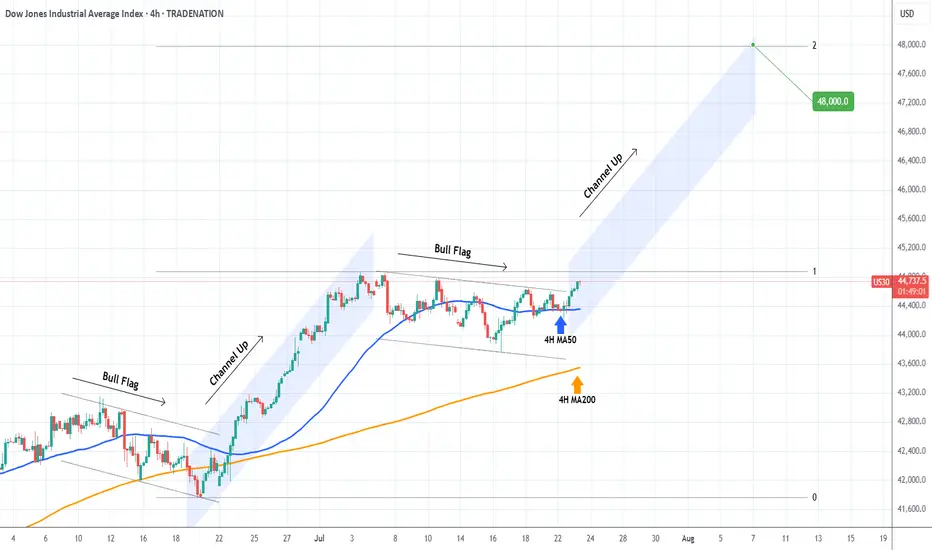
DOW JONES Strong rebound on its 4H MA50.Dow Jones (DJI) is having a strong rebound exactly on its 4H MA50 (blue trend-line). This is taking place just after the price broke above the Bull Flag that served as the accumulation pattern following the previous Channel Up.
This is a repetitive pattern and most likely we will now see the new Channel Up starting. The technical Target on such formations is the 2.0 Fibonacci extension at 48000.
-------------------------------------------------------------------------------
** Please LIKE 👍, FOLLOW ✅, SHARE 🙌 and COMMENT ✍ if you enjoy this idea! Also share your ideas and charts in the comments section below! This is best way to keep it relevant, support us, keep the content here free and allow the idea to reach as many people as possible. **
-------------------------------------------------------------------------------
Disclosure: I am part of Trade Nation's Influencer program and receive a monthly fee for using their TradingView charts in my analysis.
💸💸💸💸💸💸
👇 👇 👇 👇 👇 👇
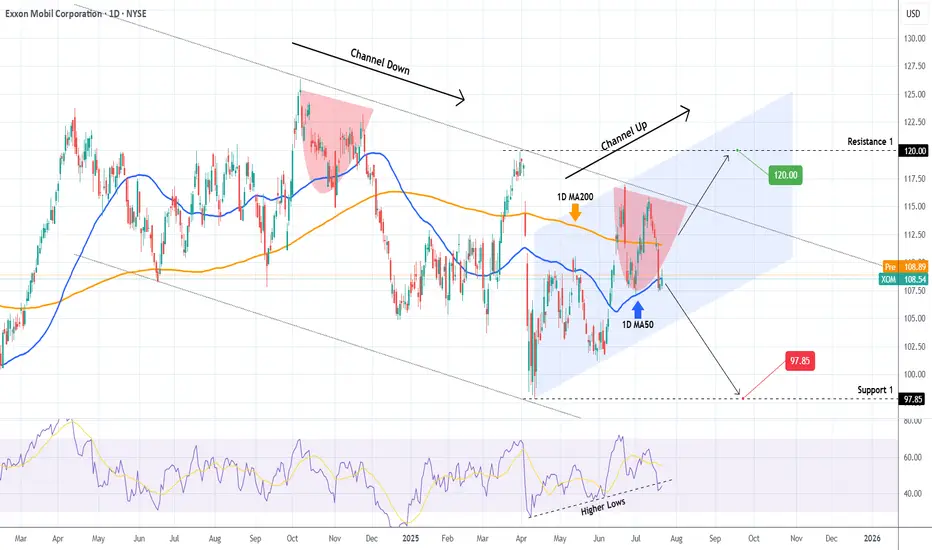
EXXON MOBIL Critical crossroads.Exxon Mobil (XOM) has been trading within a Channel Down since the June 17 2024 Low and just recently on the July 11 2025 High, it made a Lower High pattern similar to November 22 2024.
As long as the price trades below the 1D MA200 (orange trend-line), we expect to start the new Bearish Leg and test at least Support 1 (97.85).
If however it breaks above the 1D MA200 it will invalidate all prior Lower High patterns, and will most likely follow the (blue) Channel Up to break above the Channel Down. In that case, we will be targeting Resistance 1 (120.00).
-------------------------------------------------------------------------------
** Please LIKE 👍, FOLLOW ✅, SHARE 🙌 and COMMENT ✍ if you enjoy this idea! Also share your ideas and charts in the comments section below! This is best way to keep it relevant, support us, keep the content here free and allow the idea to reach as many people as possible. **
-------------------------------------------------------------------------------
💸💸💸💸💸💸
👇 👇 👇 👇 👇 👇
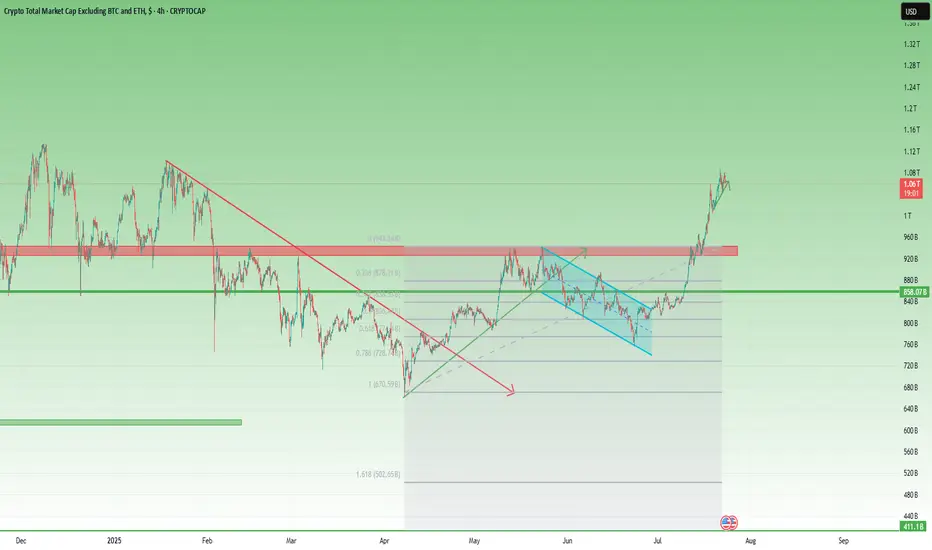
Total3 – Back Above 1T, but Will It Offer a Second Chance?📈 What happened since April?
After the sharp low in early April, Total3 began to recover steadily.
Toward the end of the month, it broke above the falling trendline that had been holding since January — a key technical shift.
This triggered a strong recovery rally, pushing total altcoin capitalization (excluding BTC & ETH) to the 930–940B resistance zone.
📉 Then came the pullback…
Price printed a double top near resistance, followed by a drop — but not a bearish one.
Instead, the correction was orderly, forming a bullish flag, with the low landing right on the 61.8% Fibonacci retracement. Classic healthy structure.
🚀 The latest breakout
Earlier this month, Total3 launched a very impulsive leg up, reclaiming the 1 trillion level with strength.
At the time of writing, we’re trading back above 1T, and momentum remains on the bulls’ side.
However, the chart does look a bit overextended in the short term, suggesting a correction could follow soon.
🧭 Trading Plan – Will We Get a Retest?
The textbook play would be to wait for a deep pullback toward previous support levels.
BUT – I don’t believe we’ll get a full retest of the breakout. Altcoins may stay elevated or correct only modestly.
Instead, I’ll be watching the 1T zone and slightly below — that’s where I’ll look to load up on interesting altcoins.
📌 Conclusion:
Total3 has broken structure, reclaimed key levels, and is showing classic bullish continuation behavior.
The market may not offer you the perfect entry — but small dips near 1T could be all we get before another move higher. 🚀
Be prepared. Don’t wait for perfection in a market because rarely gives it.
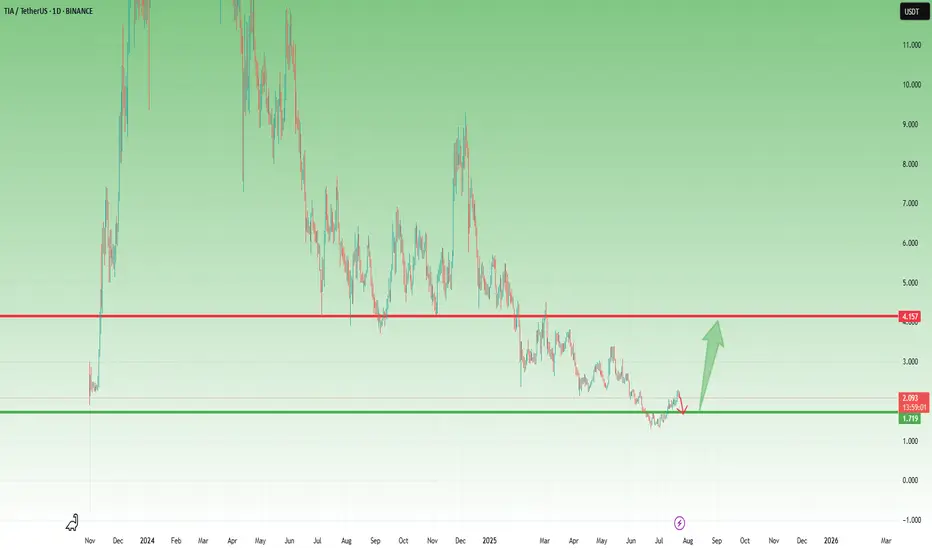
TIA- Is the Coin Finally Ready to Wake Up?After its launch on Binance in November 2023 and the immediate 10x pump, BINANCE:TIAUSDT has been, to put it mildly, a constant disappointment.
Since then, the hype has faded, and the price slowly deflated — leaving holders frustrated and the chart uninspiring.
🔍 Recent Signs of Life
However, something has started to shift.
After a fresh dip to 1.35, the coin formed a small double bottom and managed to recover above the 2.00 zone.
⚠️ Important to note: the rise hasn’t been impulsive.
But in the context of a broader altcoin revival — which I've outlined in my recent dominance analyses — TIA could become a decent candidate for a relief rally.
🔽 What I’m Watching
The recent structure looks like a bearish flag, and there’s a decent chance the pattern breaks down first before any real rally begins.
That’s why I’m watching the 1.70 area closely.
If price dips into that zone and gives a positive reversal signal, I’ll look to buy the dip.
🎯 Target and Potential
My upside target for this move is around 4.00, which would represent over 100% potential from the entry zone.
No moon calls. Just technical setup + potential market rotation + favorable risk/reward.
✅ Conclusion
TIA isn’t a favorite.
But sometimes, unloved charts offer the cleanest reversals.
I’ll let the market speak near 1.70.
If it holds and gives confirmation — I’m in. 🚀
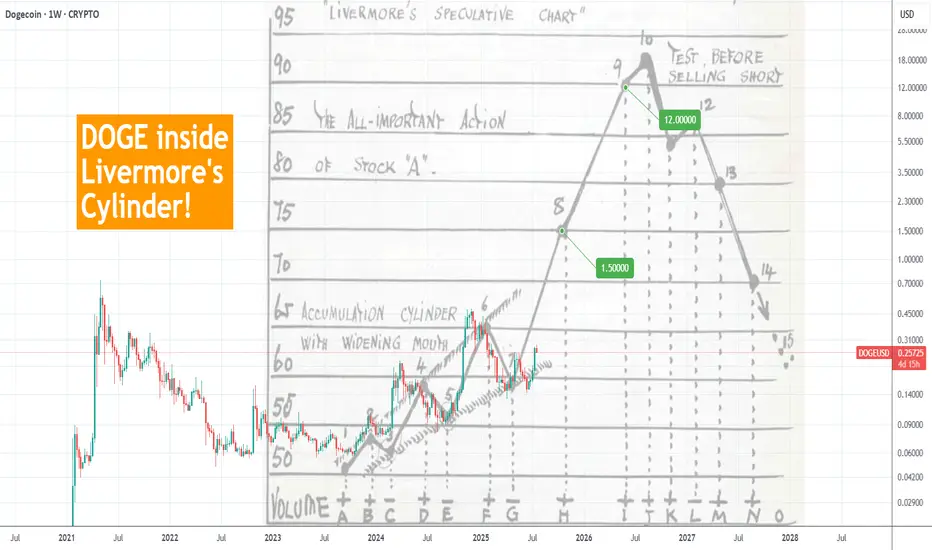
DOGEUSD Is that a textbook Livermore Cylinder to $1.5 ??Doge (DOGEUSD) has been trading within a Bullish Megaphone for the majority of its Bull Cycle since the October 09 2023 Low. We may technically claim that this has been so far one massive Accumulation Phase, along with the rest of the altcoin market.
A pattern that draws strong comparisons with that Megaphone has been 'Livermore's Accumulation Cylinder'. Jesse Livermore, an American stock trader, came with a revolutionary trading pattern a century ago, whose principles often apply perfectly to today's financial assets.
This is what we do on today's Dogecoin analysis, we apply this Accumulation Cyclinder on Doge's Bullish Megaphone. Even though not a perfect fit obviously, the main characteristics apply, with clearly visible Bullish and Bearish Legs.
Based on this model, the market is right now starting the aggressive break-out phase above the Cylinder. Technically the Accumulation is over and the price may pursue levels 8 and 9, which give price Targets of $1.50 and $12.00 respectively.
Now, even though $12.00 falls well after (6 months or so) the expected duration of the current Bull Cycle, $1.50 is well within its limits (October - November 2025) and exactly double the price of the previous Cycle High. This makes it a very attractive Top candidate.
So do you think Doge is inside a Livermore Cylinder that is about to break out parabolically?
-------------------------------------------------------------------------------
** Please LIKE 👍, FOLLOW ✅, SHARE 🙌 and COMMENT ✍ if you enjoy this idea! Also share your ideas and charts in the comments section below! This is best way to keep it relevant, support us, keep the content here free and allow the idea to reach as many people as possible. **
-------------------------------------------------------------------------------
💸💸💸💸💸💸
👇 👇 👇 👇 👇 👇
Lingrid | GOLD Key Resistance Zone. Possible Short-Term TradeThe price perfectly fulfilled my last idea . OANDA:XAUUSD has reached the upper boundary of the resistance zone around 3,445 after a strong impulse leg from the support trendline and the breakout of consolidation. Price action shows signs of exhaustion just below the June high, forming a potential reversal pattern near the channel top. If gold fails to hold above this resistance, a short-term pullback toward the 3,385 level becomes likely. The setup favors a short-term corrective decline unless bulls reclaim control with a breakout above the red trendline.
📉 Key Levels
Sell trigger: Rejection below 3,445
Sell zone: 3,430–3,445
Target: 3,385
Invalidation: Close above 3,480
💡 Risks
Breakout continuation toward 3,480
Sustained momentum from recent impulse leg
DXY weakness boosting gold's appeal
If this idea resonates with you or you have your own opinion, traders, hit the comments. I’m excited to read your thoughts!

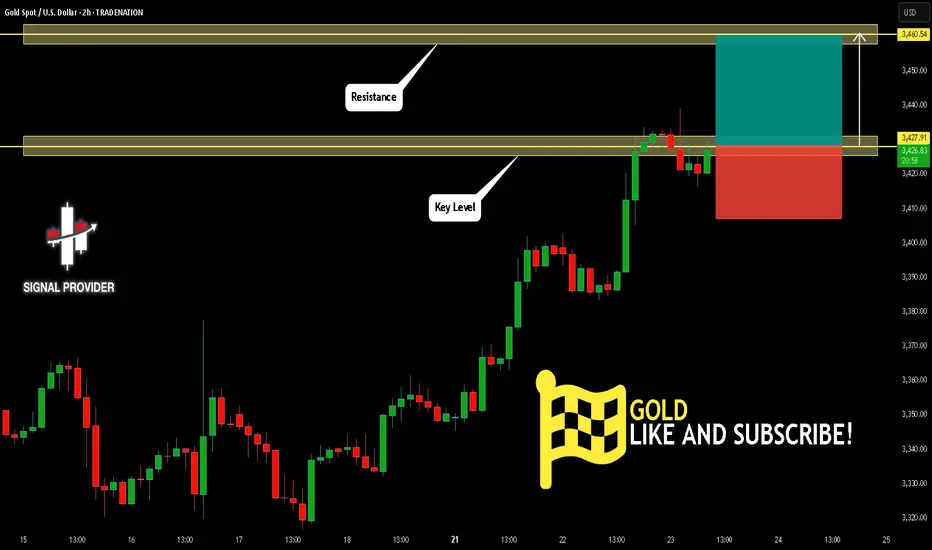
GOLD Will Go Up! Buy!
Please, check our technical outlook for GOLD.
Time Frame: 2h
Current Trend: Bullish
Sentiment: Oversold (based on 7-period RSI)
Forecast: Bullish
The market is trading around a solid horizontal structure 3,427.91.
The above observations make me that the market will inevitably achieve 3,460.54 level.
P.S
We determine oversold/overbought condition with RSI indicator.
When it drops below 30 - the market is considered to be oversold.
When it bounces above 70 - the market is considered to be overbought.
Disclosure: I am part of Trade Nation's Influencer program and receive a monthly fee for using their TradingView charts in my analysis.
Like and subscribe and comment my ideas if you enjoy them!