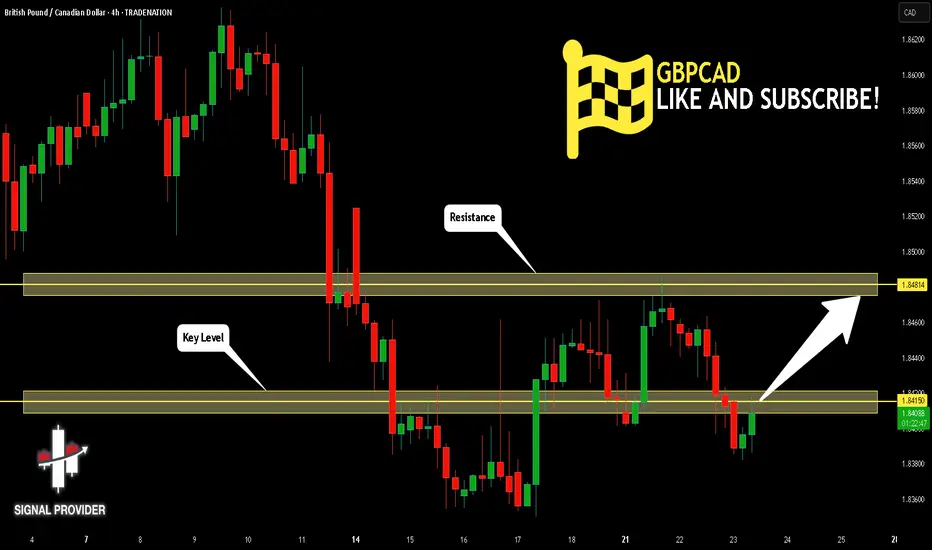
GBPCAD Is Very Bullish! Buy!
Please, check our technical outlook for GBPCAD.
Time Frame: 4h
Current Trend: Bullish
Sentiment: Oversold (based on 7-period RSI)
Forecast: Bullish
The market is approaching a significant support area 1.841.
The underlined horizontal cluster clearly indicates a highly probable bullish movement with target 1.848 level.
P.S
The term oversold refers to a condition where an asset has traded lower in price and has the potential for a price bounce.
Overbought refers to market scenarios where the instrument is traded considerably higher than its fair value. Overvaluation is caused by market sentiments when there is positive news.
Disclosure: I am part of Trade Nation's Influencer program and receive a monthly fee for using their TradingView charts in my analysis.
Like and subscribe and comment my ideas if you enjoy them!
Signals
Lingrid | TRXUSDT Pullback Following the Bullish Momentum BINANCE:TRXUSDT is consolidating after retreating from the 0.3350 resistance, following a higher high within the upward channel. Despite short-term bearish momentum, price has rebounded off the key 0.3128 support near the blue trendline. A break above recent highs may open a move back toward the resistance zone and upper channel. As long as the ascending structure holds, bullish continuation remains favored.
📉 Key Levels
Buy trigger: Break above 0.3190
Buy zone: 0.3128–0.3160
Target: 0.3350
Invalidation: Break below 0.3090
💡 Risks
Failure to reclaim breakout structure
Channel support breakdown
Broader market weakness in altcoins
If this idea resonates with you or you have your own opinion, traders, hit the comments. I’m excited to read your thoughts!

"Handle Tightening… Is RPSG Ready to Explode?"Once upon a trend, RPSG Ventures brewed a picture-perfect Cup & Handle—a structure born not out of coincidence, but crowd psychology and silent accumulation.
After nearly 9 months of consolidation, the stock crafted a deep, symmetrical cup (between November 2024 and May 2025). Traders forgot about it. Volumes dried. Hope faded.
But quietly, the handle formed—short, shallow, and tight. It’s not just a chart pattern—it’s a test of patience. And now, the breakout zone at ₹971.80 is like the rim of a boiling kettle: silent… until the whistle.
🧭 Possible Future?
If it breaks out: A rally toward ₹1,264 isn't just possible—it’s logical.
If it fakes out: Back to base, retest near ₹890.
💬 What makes this unique?
This isn’t just technical analysis. It’s a behavioral pattern. Fear, exhaustion, optimism—they're all baked into this structure. Cup & Handle isn’t bullish because of lines—it's bullish because it reflects crowd hesitation turning into confidence.
🚨 "Spill or Serve?" — comment below .
🧠 Watch the volume.
🛑 Don't jump the gun.
✅ Let the breakout come to you.
📜 Disclaimer:
This is not trading advice—this is pattern psychology in motion. Always consult your financial advisor before making real trades. This story is meant to provoke thought, not profits.

XAGUSD Outlook – 40 Remains the Next TargetIn my previous XAGUSD analysis, I argued that the trend was strongly bullish and that a move toward 40 was the next logical outcome. At the time, price was correcting, and I highlighted the 37.50 zone as a key area to look for long opportunities.
✅ Indeed, Silver respected that zone perfectly —
It retested the broken consolidation, found support, and then surged higher, marking a new multi-year high in yesterday’s session.
________________________________________
🔍 What Now?
Nothing has changed in the broader view:
• Trend: Strongly bullish
• Structure: Higher highs and higher lows remain intact
• Behavior: Dips are being bought aggressively
As long as the recent 37.50 low is not broken, the strategy remains straightforward:
Buy dips within bullish continuation
________________________________________
🎯 40 in Sight — But Don’t Be Surprised if It Goes Further
The 40 zone remains the natural next target — a major psychological level.
But based on current momentum and breakout strength, Silver could go even higher in the coming weeks and months. If buyers keep control, we might even see new ATH test by year's end (50 zone).
________________________________________
🟢 Conclusion
This breakout confirms the larger trend.
The pullback to 37.50 was bought, as expected, and now Silver is making its move.
Strategy should remain the same:
Stay long above 37.50
Buy the dips
Watch how price reacts near 40 — but keep an open mind for higher levels
Disclosure: I am part of TradeNation's Influencer program and receive a monthly fee for using their TradingView charts in my analyses and educational articles.

Gold Update – Strong Breaks, Strong BullsYesterday, after the break of the key 3370 resistance, Gold corrected slightly toward 3383, then consolidated briefly in that area. From there, it launched into a strong new leg up, closing the day once more near the highs, around 3430.
📌 What’s important here is that the price did not even come back to retest the broken resistance — now turned support. Combined with the strong daily close near the high of the range, this gives us a clear message:
➡️ Bulls are in full control.
________________________________________
🔍 This Week – Three Key Breaks
So far this week, Gold has delivered three major breakouts:
• ✅ A clean breakout from the box consolidation that kept price stuck and indecisive last week
• ✅ A decisive break above the 3400 psychological figure
• ✅ A breakout above the symmetrical triangle resistance, which had been forming since late April
Each of these is significant on its own. Together, they suggest a shift toward a more aggressive bullish scenario.
________________________________________
🔮 What’s Next?
All these breakouts point to the potential for more gains ahead.
In fact, the next logical step could be an attempt to mark a new All-Time High.
My view remains the same:
Buying dips remains the strategy of choice, with a focus on the 3400 zone as a key support area, and a swing target around 3500.
Disclosure: I am part of TradeNation's Influencer program and receive a monthly fee for using their TradingView charts in my analyses and educational articles.
USOIL POTENTIAL LONG|
✅CRUDE OIL has retested a key support level of 65.00$
And as the pair is already making a bullish rebound
A move up to retest the supply level above at 66.27$ is likely
LONG🚀
✅Like and subscribe to never miss a new idea!✅
Disclosure: I am part of Trade Nation's Influencer program and receive a monthly fee for using their TradingView charts in my analysis.

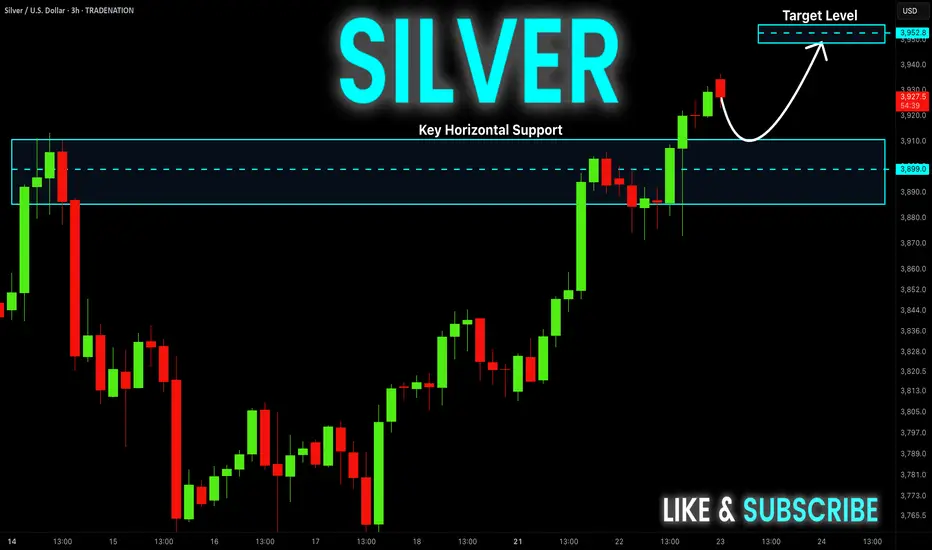
SILVER Bullish Breakout! Buy!
Hello,Traders!
SILVER is trading in a strong
Uptrend and the price made a
Bullish breakout of the key
Horizontal level of 39.10$
So we are bullish biased
And we will be expecting a
Further bullish move up
Buy!
Comment and subscribe to help us grow!
Check out other forecasts below too!
Disclosure: I am part of Trade Nation's Influencer program and receive a monthly fee for using their TradingView charts in my analysis.
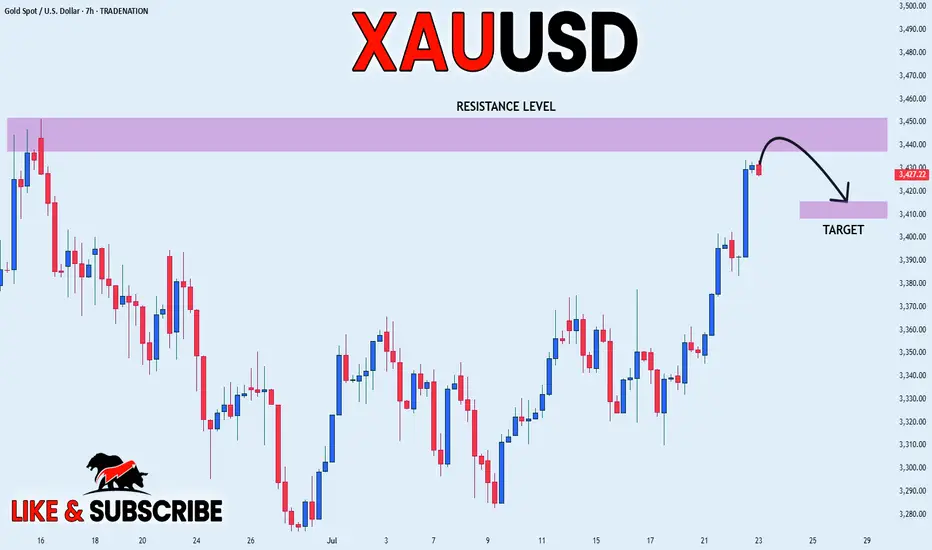
GOLD SHORT FROM RESISTANCE|
✅GOLD is set to retest a
Strong resistance level above at 3450$
After trading in an uptrend for some time
Which makes a bearish pullback a likely scenario
With the target being a local support below at 3414$
SHORT🔥
✅Like and subscribe to never miss a new idea!✅
Disclosure: I am part of Trade Nation's Influencer program and receive a monthly fee for using their TradingView charts in my analysis.
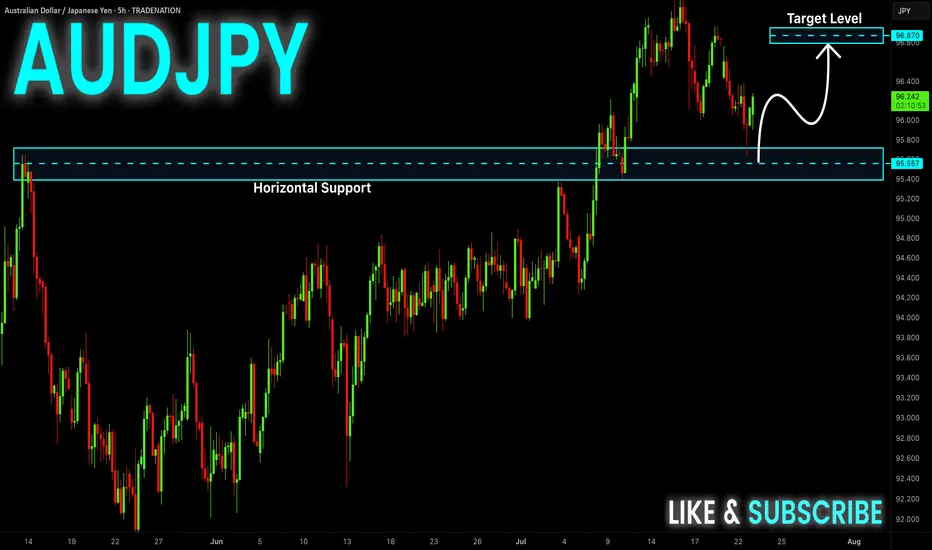
AUD-JPY Will Grow! Buy!
Hello,Traders!
AUD-JPY already made a
Bullish rebound from the
Strong horizontal support
Of 95.610 and as we are
Bullish biased we will be
Expecting a further bullish
Move up
Buy!
Comment and subscribe to help us grow!
Check out other forecasts below too!
Disclosure: I am part of Trade Nation's Influencer program and receive a monthly fee for using their TradingView charts in my analysis.
Crude Oil Rebound Incoming? Key Demand Zone 📈 1. Technical Analysis – Daily Chart (CL1!)
The price has returned to a demand zone between 64.60 and 65.30, an area that previously triggered strong bullish reactions.
The July 22nd candle shows a clear lower wick, indicating potential buyer absorption and a possible short-term reversal.
The next key resistance lies between 67.80 and 68.80, which aligns with a well-defined supply zone.
Daily RSI remains weak but shows signs of bullish divergence, suggesting potential accumulation.
Bias: bullish from current levels, targeting 67.50 – 68.00. Invalidation on a daily close below 64.40.
2. Institutional Sentiment – COT Report (CFTC, July 15, 2025)
Non-Commercials (Speculators)
Long: 308,915 (↓ -24,223)
Short: 146,488 (↑ +22,724)
Net Position: sharply declining → bearish divergence in speculative sentiment
Commercials (Hedgers)
Long: 857,803 (↑ +66,342)
Short: 1,046,199 (↑ +18,118)
Net Position: still negative, but improving → reduced hedging = less downside pressure
📉 Interpretation:
Funds are closing longs and adding shorts, showing bearish positioning. However, commercials are slowly reducing their hedging exposure, which could indicate short-term stabilization if the technical support holds.
3. Seasonality
Periods analyzed: 20, 15, 10, 5, and 2 years
July historically shows negative average returns:
-0.71% (20Y)
-1.26% (15Y)
-1.37% (10Y)
The seasonal pattern indicates continued cyclical weakness into August.
📌 Interpretation:
The summer period typically brings seasonal bearish pressure, which aligns with current 2025 performance.
🌐 4. Macro & Fundamentals
EIA inventory builds for 3 consecutive weeks → demand weakness in the U.S.
No additional OPEC+ cuts announced → supply remains ample
Stable inflation data in the U.S. and China → no uptick in energy demand
Overall macro data is neutral with a slightly bearish short-term bias

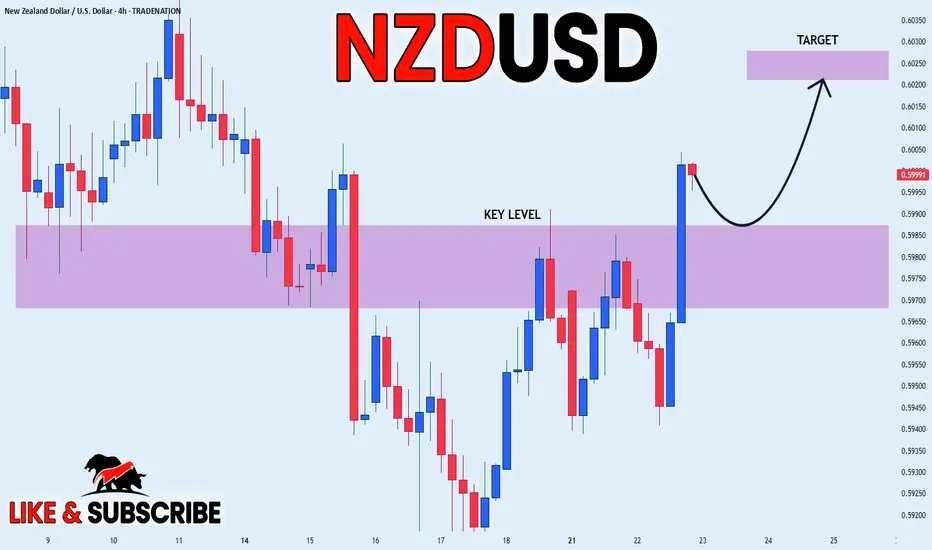
NZD_USD BULLISH BREAKOUT|LONG|
✅NZD_USD is going up
Now and the pair made a bullish
Breakout of the key horizontal
Level of 0.5980 and the breakout
Is confirmed so we are bullish
Biased and we will be expecting
A further bullish move up
LONG🚀
✅Like and subscribe to never miss a new idea!✅
Disclosure: I am part of Trade Nation's Influencer program and receive a monthly fee for using their TradingView charts in my analysis.
USOIL Long From Support! Buy!
Hello,Traders!
USOIL made a retest of
The horizontal support
Level of 64.86$ from where
We are already seeing a bullish
Reaction so we will be expecting
A further local move up
Buy!
Comment and subscribe to help us grow!
Check out other forecasts below too!
Disclosure: I am part of Trade Nation's Influencer program and receive a monthly fee for using their TradingView charts in my analysis.

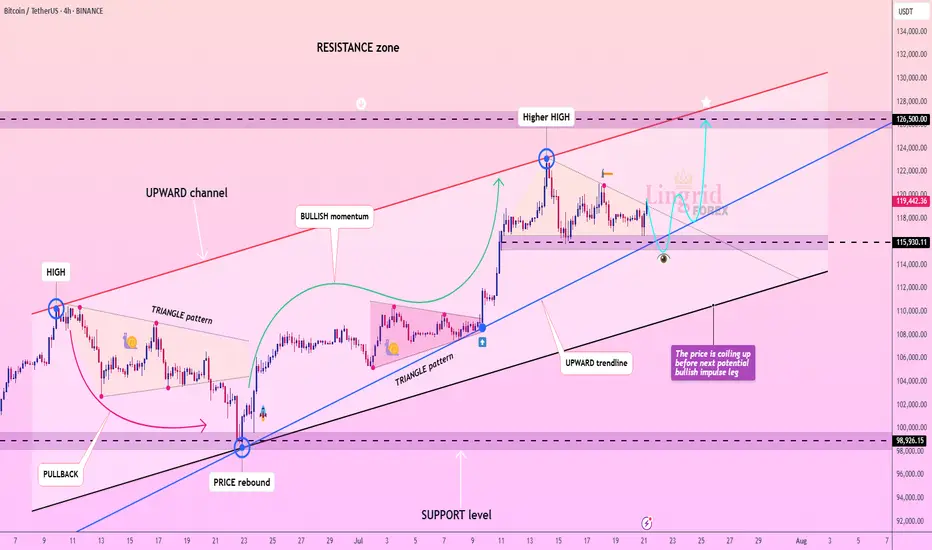
Lingrid | BTCUSDT Consolidation Expansion ScenarioBINANCE:BTCUSDT is coiling within a bullish continuation zone after rebounding strongly from the 115,930 support and holding above the blue ascending trendline. Price formed a higher high inside the rising channel, followed by sideways consolidation, suggesting preparation for another bullish leg. The triangle pattern breakout and price stability above the trendline favor upward continuation toward the resistance at 126,500. Momentum remains intact while the structure supports the next breakout push.
📉 Key Levels
Buy trigger: Break and hold above 120,000
Buy zone: 117,500–118,200
Target: 126,500
Invalidation: Close below 115,930
💡 Risks
Loss of support at the trendline
Strong rejection near red channel resistance
Weak market sentiment or macro news shocks
If this idea resonates with you or you have your own opinion, traders, hit the comments. I’m excited to read your thoughts!
GBP/USD — Potential Bullish Reversal Setup | Long Bias Above Sup🧠 Thesis:
GBP/USD is showing early signs of a potential bullish reversal from a key confluence zone. While price has recently tested short-term descending channel, we’re currently testing a strong ascending trendline support and prior demand zone. This setup offers a favorable long-risk scenario — so long as price remains above 1.3335 (invalid level).
🔍 Technical Breakdown:
Descending Channel: Price has been in a corrective downward channel since early July. This pullback appears orderly and corrective rather than impulsive.
Support Zone: We are seeing strong reactions from the 1.3400–1.3440 area, which aligns with:
Previous consolidation zone (mid-May).
200 EMA on the 4H.
Long-term ascending trendline support (from April lows).
Bullish RSI Divergence: RSI is testing oversold territory (~32) with potential for bullish divergence forming — a classic early signal for a bounce.
EMA Cluster: 50 EMA has been breached but price is testing the 200 EMA as last-resort dynamic support. If held, this further adds to the bullish case.
🧭 Scenarios:
✅ Bullish Bias (Preferred)
If price holds above the trendline support and breaks out of the descending channel, we could see a bullish impulse toward:
🎯 TP1: 1.3600 (prior structure)
🎯 TP2: 1.3770 (trendline extension & fib confluence)
Confirmation trigger: Break and close above 1.3500 resistance (channel breakout).
❌ Invalidation:
A decisive break below 1.3335 (marked in red) invalidates this idea and shifts bias back to bearish — potential deeper pullback toward 1.3200s.
⚠️ Risk Management:
Entry zone: 1.3430–1.3450 (near support)
Stop loss: Below 1.3335
Risk-reward: >2.5:1 on a successful breakout
📝 Conclusion:
This is a classic trend-continuation play with clean structure and a logical invalidation point. The market is offering a textbook “buy-the-dip” scenario off strong multi-timeframe support. Patience is key — wait for confirmation before sizing in.

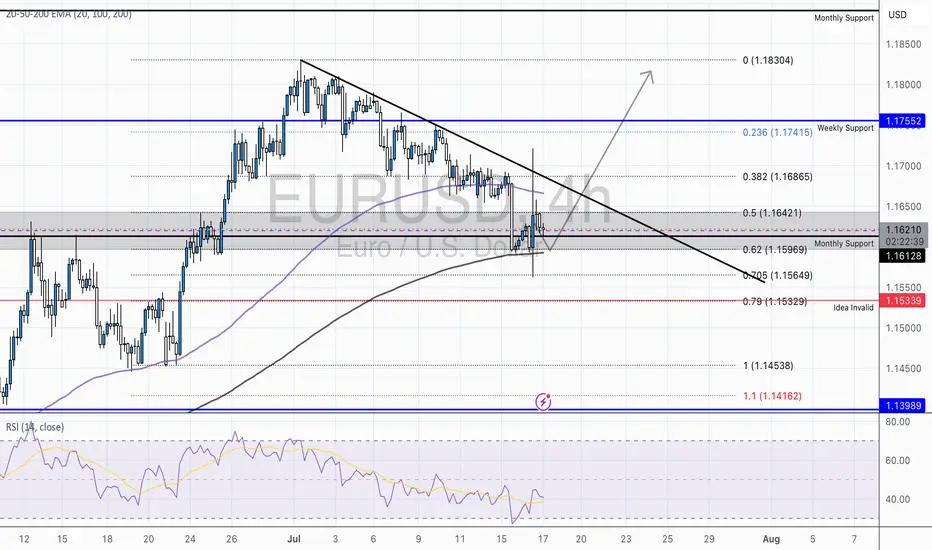
EUR/USD – Falling Wedge at Major Fibonacci Zone | Bullish ReversAfter a strong mid-June rally, EUR/USD has pulled back into a key fib cluster, showing early signs of reversal from a classic falling wedge pattern — often a precursor to bullish breakouts.
Technical Breakdown:
📉 Descending Trendline
🔍 Fibonacci Confluence:
Price is reacting from the 0.5-0.618 – 0.705 zone (1.16421-1.15969), aligning perfectly with historical demand and the golden zone of the fib retracement.
Just below sits the 0.79 fib (1.15339), which also marks our invalidity level for this idea — a deep but powerful retracement if tested.
💡 RSI:
While still below 50, it has created a hidden bullish divergence between July 12–17, hinting that momentum is flipping back to bulls.
🧠 Educational Insight:
This setup combines Trendlines, Fibonacci retracement theory, and EMA dynamics to build a multi-layered trade thesis — the type of confluence we look for at Wright Way Investments.
Price doesn’t just reverse because it hits a fib level. But when structure, EMAs, and RSI align — the odds increase significantly.
📈 Trade Setup (Idea-Based, Not Financial Advice):
Long Entry Zone: Current area (1.159–1.161), with confirmation above 1.1626
Invalidation: Clean break & close below 1.15339
Target Zones:
🎯 TP1 – 1.1642 (50 fib & retest zone)
🎯 TP2 – 1.1686 (38.2 fib)
🎯 TP3 – 1.1755 (Weekly Resistance)
📌 Summary:
EUR/USD is forming a textbook reversal setup, supported by fib precision and EMA alignment. Patience is key — but the ingredients are here for a strong bullish continuation.
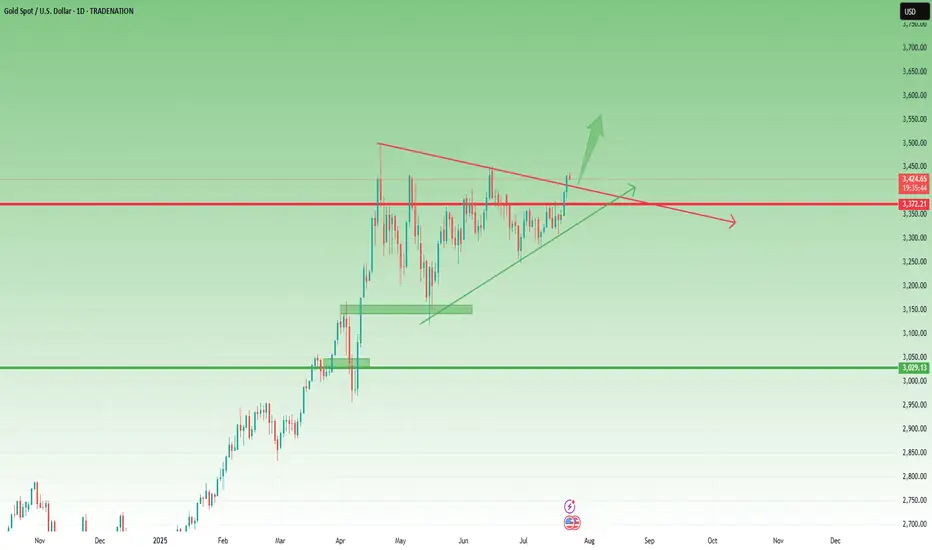
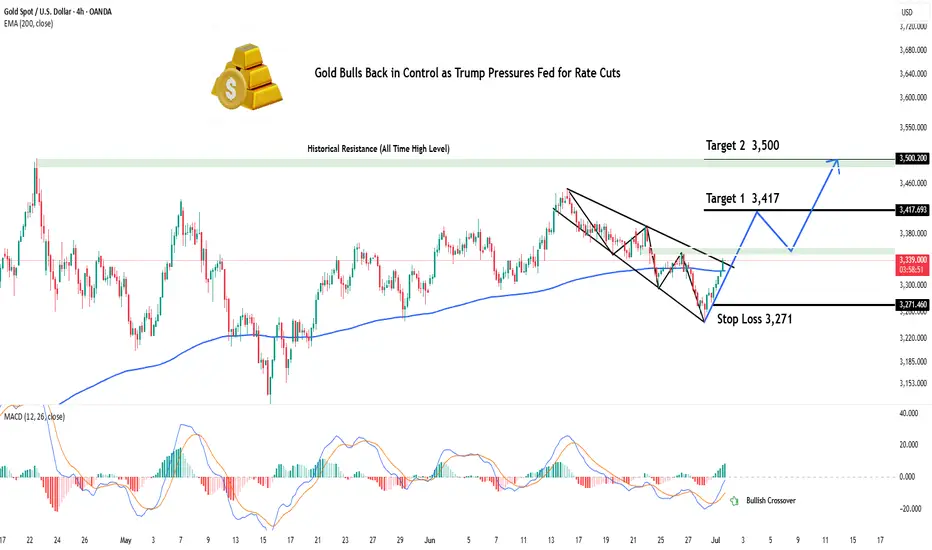
Gold Bulls Back in Control as Trump Pressures Fed for Rate CutsHey Realistic Traders!
President Trump is ramping up pressure on the Fed to cut interest rates , saying the U.S. is falling behind countries with looser policies. As several Fed officials begin to shift their stance, expectations for rate cuts are growing. That’s putting pressure on the dollar and giving gold a fresh boost.
We’ll take a closer look at what this means for OANDA:XAUUSD (Gold) through technical analysis and explore its upside potential.
Technical Analysis
On the 4-hour chart, Gold has moved above the EMA-200, signaling a shift in momentum to the upside. Price has also broken out of a Descending Broadening Wedge (DBW) pattern, which often indicates the start of a bullish trend.
The breakout was confirmed by a Bullish Marubozu candle, reflecting strong buying pressure. To add further confirmation, the MACD has formed a bullish crossover, reinforcing the upward momentum.
Looking ahead, the first target is seen at 3417. If reached, a minor pullback toward the historical resistance zone (green area) may occur, with a potential continuation toward the second target at 3500.
This bullish outlook remains valid as long as the price stays above the stop-loss level at 3271 . A break below this level would invalidate the setup and shift the outlook back to neutral.
Support the channel by engaging with the content, using the rocket button, and sharing your opinions in the comments below.
Disclaimer: "Please note that this analysis is solely for educational purposes and should not be considered a recommendation to take a long or short position on XAUUSD.
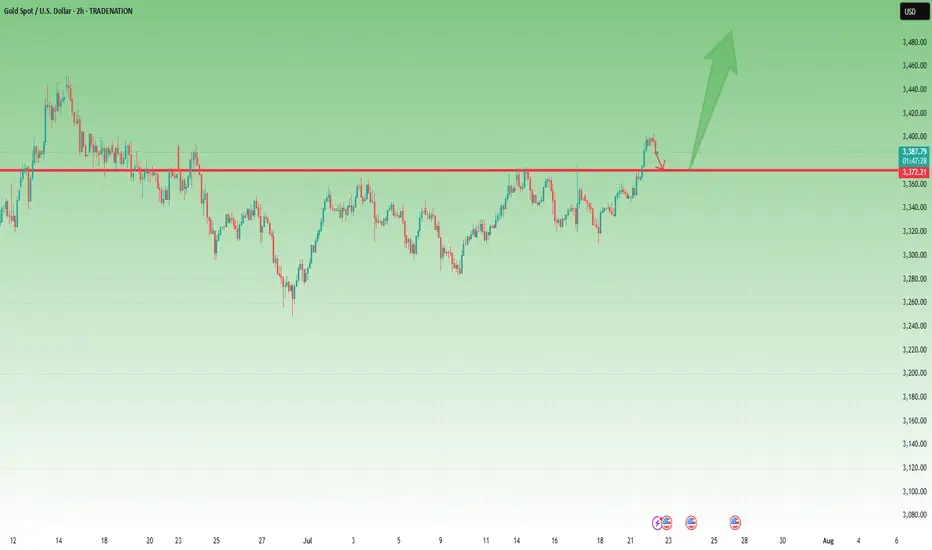
Gold - Above 3370 Is Bullish Territory – But 3360 Must Hold📆 What happened yesterday?
After more than a week of frustrating, sideways price action, Gold finally broke out above the key 3370 resistance zone.
The breakout was clean and impulsive, with TRADENATION:XAUUSD pushing to an intraday high around 3400.
Following that move, price printed a small double top near the high and began a modest correction — perfectly normal after such a breakout. At the time of writing, Gold trades at 3385, still holding above former resistance.
📈 Why this breakout matters:
The daily close at 3396 came in strong and near the top, leaving behind a clear Marubozu candle
This kind of price action signals conviction and momentum
The breakout confirms what I’ve been anticipating for days — the range is resolved, and the market is choosing the bullish path
🎯 What to expect next:
If price stabilizes above 3400, the road to 3450 opens — which is the target mentioned in my previous analyses
That area represents the next major resistance and likely magnet for price if bulls stay in control
🧭 Trading Plan:
For me, the plan is now simple:
✅ Buy the dips — especially on a potential retest of the 3370–3375 broken resistance, which now turns into support
❌ Negation comes only with a daily close below 3360, which would invalidate this breakout and raise questions
📌 Conclusion:
The breakout has finally come. After days of coiling, Gold chose the upside.
Momentum is building, structure is clean, and bulls are back in control — unless 3360 fails.
Until then, I remain bullish, looking to buy dips into strength. 🚀
Disclosure: I am part of TradeNation's Influencer program and receive a monthly fee for using their TradingView charts in my analyses and educational articles.
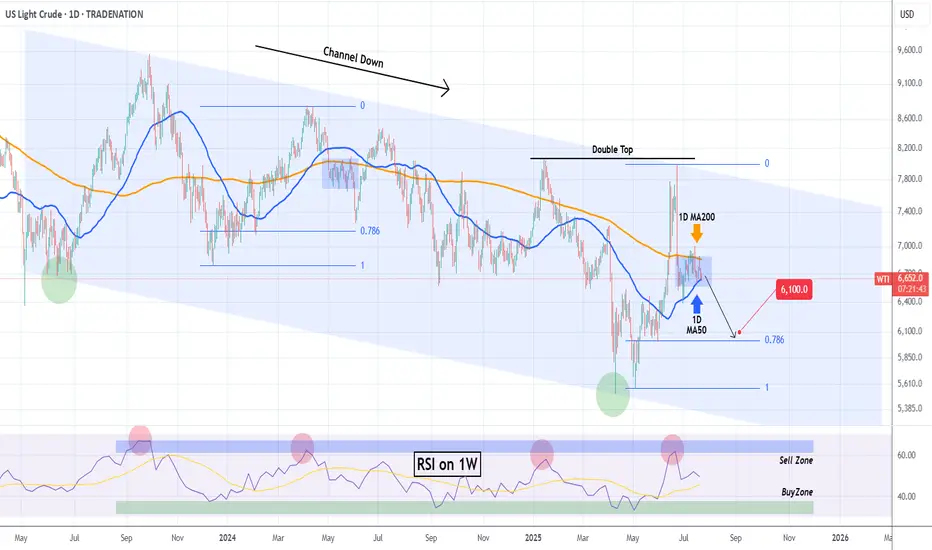
WTI OIL Extreme 1D MA50-200 squeeze to deliver break-out!WTI Oil (USOIL) has been consolidating for almost the past 30 days within the 1D MA50 (blue trend-line) and 1D MA200 (orange trend-line). The squeeze is now so tight that the trend will be revealed soon with a break-out.
Based on the 2-year Channel Down, that should be bearish, resembling the May 2024 consolidation that broke downwards and almost hit the 0.786 Fibonacci retracement level. Notice also the similar Sell Zone rejection on the 1W RSI.
As a result, we expect WTI to decline and target $61.00.
-------------------------------------------------------------------------------
** Please LIKE 👍, FOLLOW ✅, SHARE 🙌 and COMMENT ✍ if you enjoy this idea! Also share your ideas and charts in the comments section below! This is best way to keep it relevant, support us, keep the content here free and allow the idea to reach as many people as possible. **
-------------------------------------------------------------------------------
Disclosure: I am part of Trade Nation's Influencer program and receive a monthly fee for using their TradingView charts in my analysis.
💸💸💸💸💸💸
👇 👇 👇 👇 👇 👇
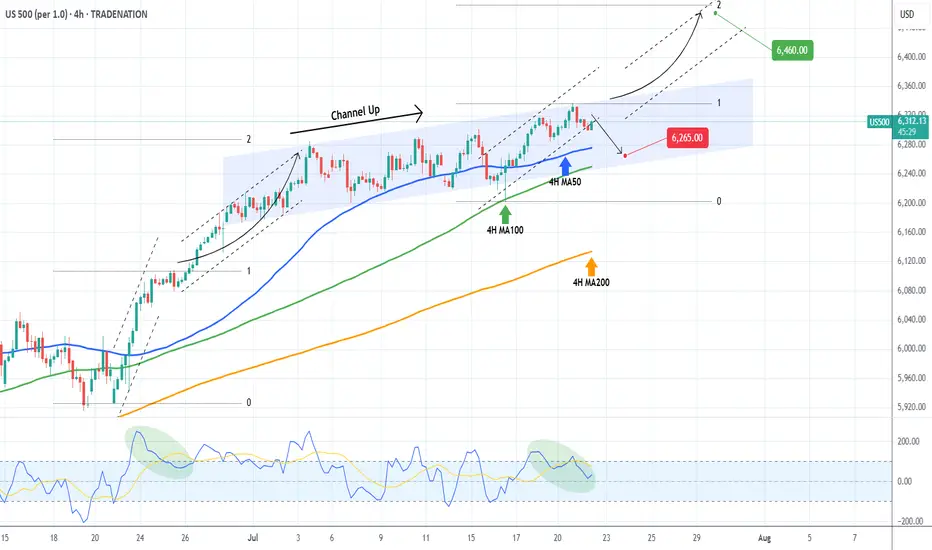
S&P500 Critical short-term crossroads.The S&P500 index (SPX) has been trading within a Channel Up since for the entirety of July and right now is ahead of important crossroads. It either breaks out above the pattern or pulls back to price a new Higher Low.
Based on the 4H CCI and the similarities with the June 24 - 25 consolidation, there are higher probabilities to break upwards. That fractal reached the 2.0 Fibonacci extension after it broke out. We will wait for confirmation and if it's delivered, we will buy the break-out and target 6460 (just below Fib 2.0 ext).
Until then, being so close to the Channel Up top, makes a solid short opportunity targeting a Higher Low (bottom). The previous one was priced exactly on the 4H MA100 (green trend-line) so that's our target or 6250 if it comes earlier.
-------------------------------------------------------------------------------
** Please LIKE 👍, FOLLOW ✅, SHARE 🙌 and COMMENT ✍ if you enjoy this idea! Also share your ideas and charts in the comments section below! This is best way to keep it relevant, support us, keep the content here free and allow the idea to reach as many people as possible. **
-------------------------------------------------------------------------------
Disclosure: I am part of Trade Nation's Influencer program and receive a monthly fee for using their TradingView charts in my analysis.
💸💸💸💸💸💸
👇 👇 👇 👇 👇 👇
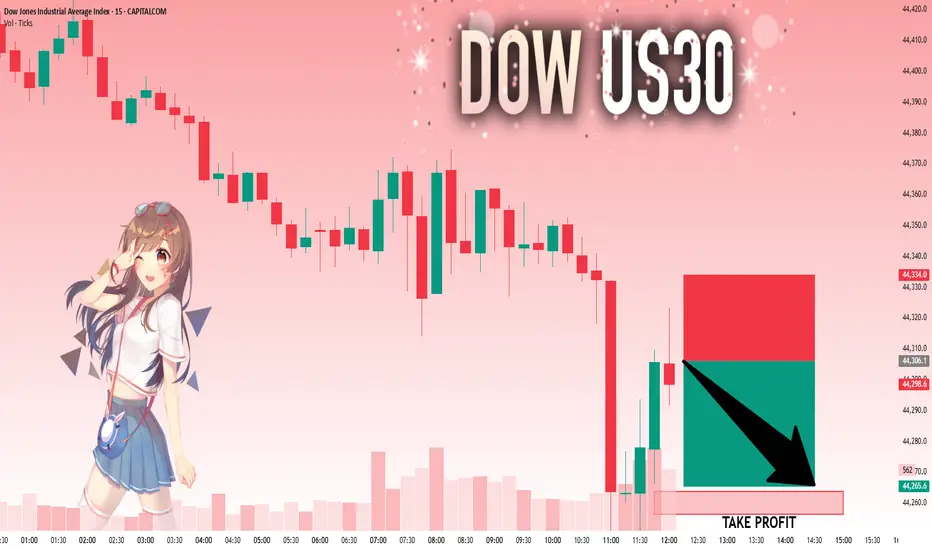
US30: The Market Is Looking Down! Short!
My dear friends,
Today we will analyse US30 together☺️
The recent price action suggests a shift in mid-term momentum. A break below the current local range around 44,306.1 will confirm the new direction downwards with the target being the next key level of 44,263.8..and a reconvened placement of a stop-loss beyond the range.
❤️Sending you lots of Love and Hugs❤️
GOLD: Strong Bullish Sentiment! Long!
My dear friends,
Today we will analyse GOLD together☺️
The in-trend continuation seems likely as the current long-term trend appears to be strong, and price is holding above a key level of 3,392.264 So a bullish continuation seems plausible, targeting the next high. We should enter on confirmation, and place a stop-loss beyond the recent swing level.
❤️Sending you lots of Love and Hugs❤️

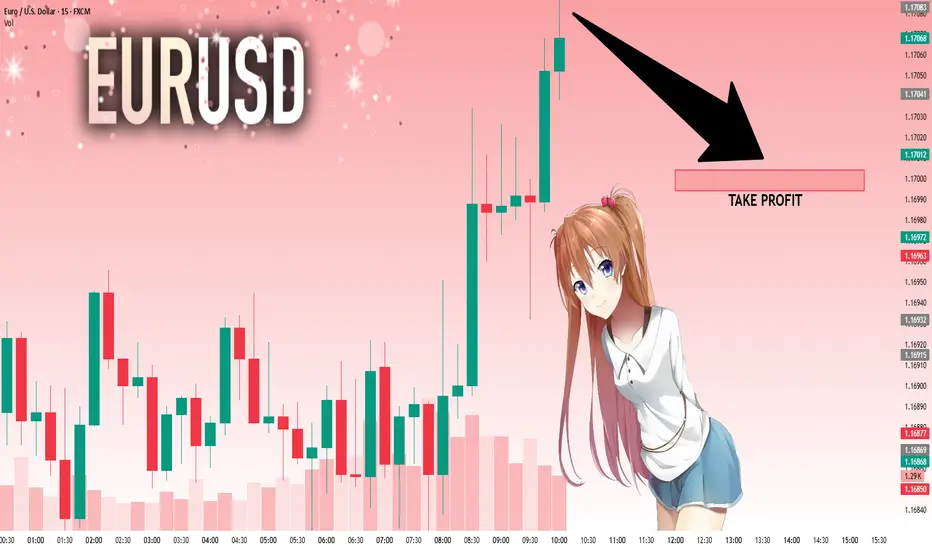
EURUSD: Bears Are Winning! Short!
My dear friends,
Today we will analyse EURUSD together☺️
The market is at an inflection zone and price has now reached an area around 1.17083 where previous reversals or breakouts have occurred.And a price reaction that we are seeing on multiple timeframes here could signal the next move down so we can enter on confirmation, and target the next key level of 1.17004..Stop-loss is recommended beyond the inflection zone.
❤️Sending you lots of Love and Hugs❤️
SILVER: Next Move Is Up! Long!
My dear friends,
Today we will analyse SILVER together☺️
The price is near a wide key level
and the pair is approaching a significant decision level of 38.823 Therefore, a strong bullish reaction here could determine the next move up.We will watch for a confirmation candle, and then target the next key level of 38.872.Recommend Stop-loss is beyond the current level.
❤️Sending you lots of Love and Hugs❤️
