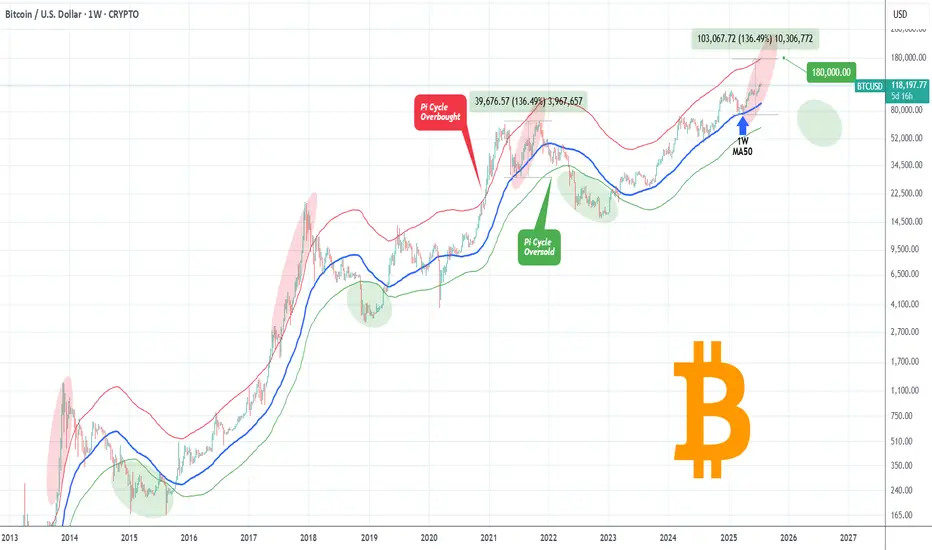
BITCOIN Isn't even overbought yet!Bitcoin (BTCUSD) has been rising strongly within a structured Channel Up pattern but even this consistent and steady uptrend since the April 07 2025 rebound on the 1W MA50 (blue trend-line) hasn't been enough to touch the Pi Cycle's overbought trend-line (red).
Throughout BTC's historic Cycles, all Tops have been priced after the overbought level was breached, which currently sits around $180000 (and rising). Given that the 4-year Cycle Theory won't change, even a repeat of the 'weaker' +136.49% last rally of the previous Cycle (Jun-Nov 2021), would take us to $180k exactly but still will be below the overbought trend-line. This just shows the immense upside potential of the market even at the current stages.
So do you think we will get that kind of rally? Feel free to let us know in the comments section below!
-------------------------------------------------------------------------------
** Please LIKE 👍, FOLLOW ✅, SHARE 🙌 and COMMENT ✍ if you enjoy this idea! Also share your ideas and charts in the comments section below! This is best way to keep it relevant, support us, keep the content here free and allow the idea to reach as many people as possible. **
-------------------------------------------------------------------------------
💸💸💸💸💸💸
👇 👇 👇 👇 👇 👇
Signals
Lingrid | GOLD Price Correction or Continuation ?The price perfectly fulfilled my last idea . OANDA:XAUUSD has completed an A-B-C bullish movement within the rising structure and is now testing a key resistance zone near 3,387. With momentum fading near the upper boundary, a potential correction toward the 3,367 area is likely before any further advance. A bounce from the SWAP zone may trigger renewed upside toward the 3,430 resistance. Price action remains bullish above the higher low and broken triangle pattern.
📉 Key Levels
Buy trigger: Rebound from 3,367
Buy zone: 3,355–3,370
Target: 3,430
Invalidation: Break below 3,342
💡 Risks
Deep correction below key structure
Failure to reclaim resistance after retest
Sudden shift in macroeconomic sentiment
If this idea resonates with you or you have your own opinion, traders, hit the comments. I’m excited to read your thoughts!

Lingrid | USDCHF Corrective Move and Bearish ContinuationThe price perfectly fulfills my previous idea . FX:USDCHF is weakening after printing a lower high beneath the resistance zone and rejecting the confluence of the downward trendline and horizontal supply near 0.80079. The structure remains bearish despite short-term corrective moves, as each rally stalls below previous highs. Price is at risk of rolling over again, aiming for the 0.78300 support if the 0.80000 area holds as resistance. Sellers remain in control as long as the pair trades below the red trendline.
📉 Key Levels
Sell trigger: Rejection below 0.80000
Sell zone: 0.79800–0.80100
Target: 0.78300
Invalidation: Close above 0.80150
💡 Risks
Bullish breakout above the descending trendline
Momentum divergence on intraday timeframes
Broader USD strength recovery
If this idea resonates with you or you have your own opinion, traders, hit the comments. I’m excited to read your thoughts!

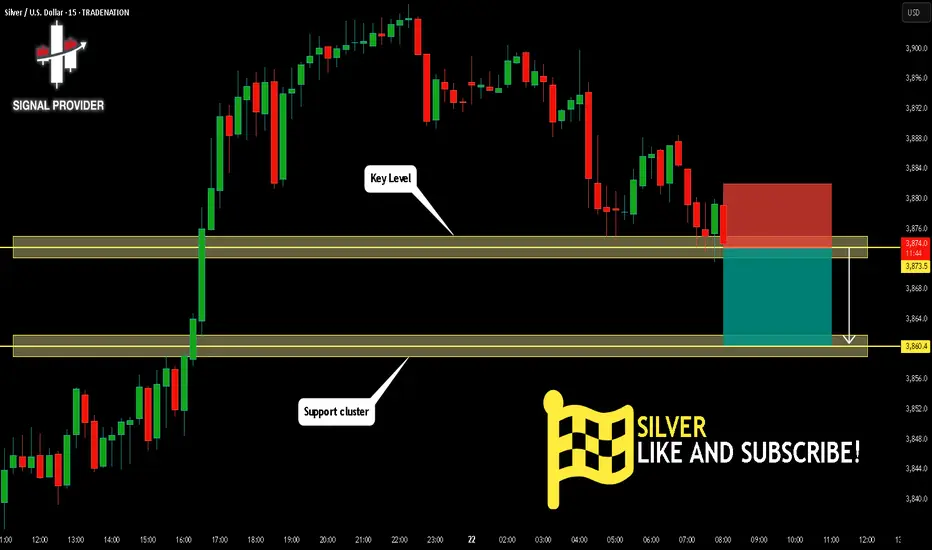
SILVER Is Going Down! Short!
Here is our detailed technical review for SILVER.
Time Frame: 15m
Current Trend: Bearish
Sentiment: Overbought (based on 7-period RSI)
Forecast: Bearish
The market is on a crucial zone of supply 3,873.5.
The above-mentioned technicals clearly indicate the dominance of sellers on the market. I recommend shorting the instrument, aiming at 3,860.4 level.
P.S
We determine oversold/overbought condition with RSI indicator.
When it drops below 30 - the market is considered to be oversold.
When it bounces above 70 - the market is considered to be overbought.
Disclosure: I am part of Trade Nation's Influencer program and receive a monthly fee for using their TradingView charts in my analysis.
Like and subscribe and comment my ideas if you enjoy them!
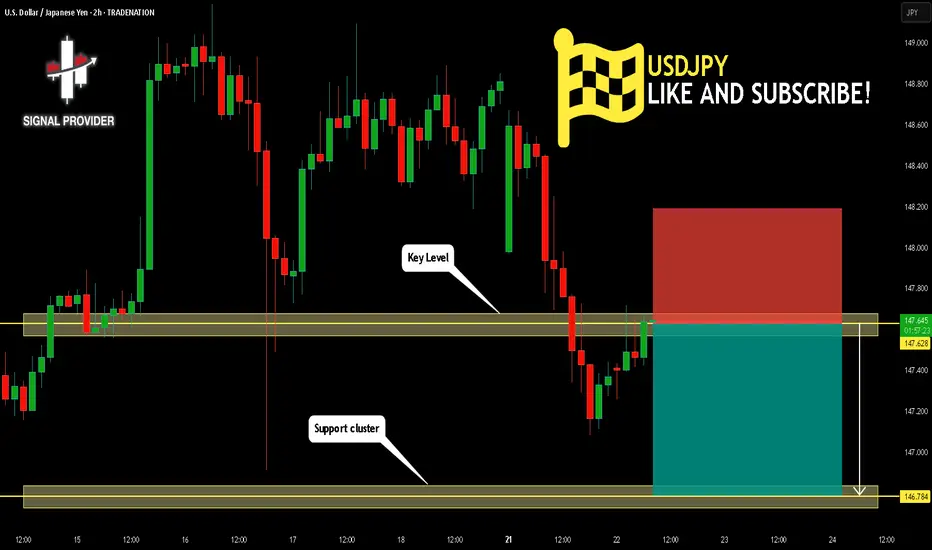
USDJPY Will Fall! Sell!
Take a look at our analysis for USDJPY.
Time Frame: 2h
Current Trend: Bearish
Sentiment: Overbought (based on 7-period RSI)
Forecast: Bearish
The price is testing a key resistance 147.628.
Taking into consideration the current market trend & overbought RSI, chances will be high to see a bearish movement to the downside at least to 146.784 level.
P.S
Overbought describes a period of time where there has been a significant and consistent upward move in price over a period of time without much pullback.
Disclosure: I am part of Trade Nation's Influencer program and receive a monthly fee for using their TradingView charts in my analysis.
Like and subscribe and comment my ideas if you enjoy them!
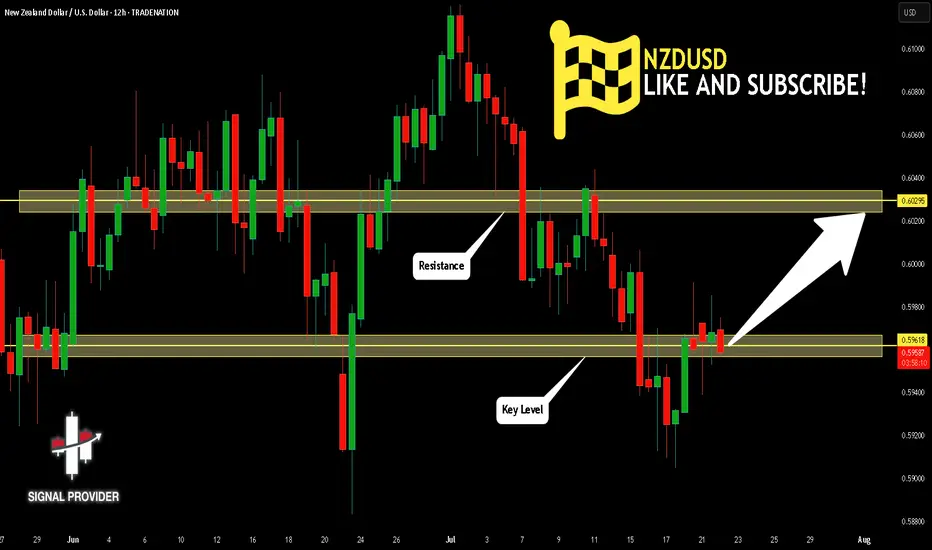
NZDUSD Will Go Higher From Support! Long!
Please, check our technical outlook for NZDUSD.
Time Frame: 12h
Current Trend: Bullish
Sentiment: Oversold (based on 7-period RSI)
Forecast: Bullish
The market is trading around a solid horizontal structure 0.596.
The above observations make me that the market will inevitably achieve 0.602 level.
P.S
Please, note that an oversold/overbought condition can last for a long time, and therefore being oversold/overbought doesn't mean a price rally will come soon, or at all.
Disclosure: I am part of Trade Nation's Influencer program and receive a monthly fee for using their TradingView charts in my analysis.
Like and subscribe and comment my ideas if you enjoy them!
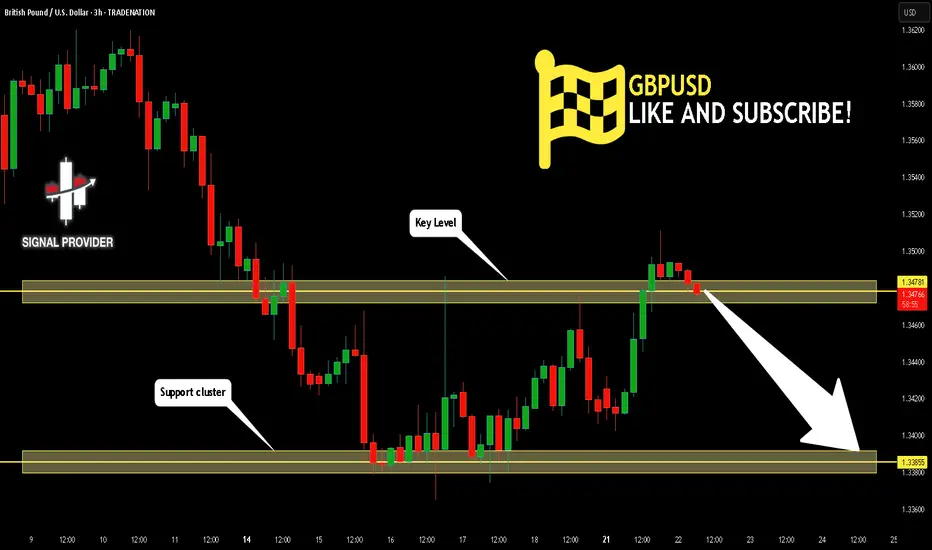
GBPUSD Will Go Down From Resistance! Short!
Here is our detailed technical review for GBPUSD.
Time Frame: 3h
Current Trend: Bearish
Sentiment: Overbought (based on 7-period RSI)
Forecast: Bearish
The market is testing a major horizontal structure 1.347.
Taking into consideration the structure & trend analysis, I believe that the market will reach 1.338 level soon.
P.S
The term oversold refers to a condition where an asset has traded lower in price and has the potential for a price bounce.
Overbought refers to market scenarios where the instrument is traded considerably higher than its fair value. Overvaluation is caused by market sentiments when there is positive news.
Disclosure: I am part of Trade Nation's Influencer program and receive a monthly fee for using their TradingView charts in my analysis.
Like and subscribe and comment my ideas if you enjoy them!
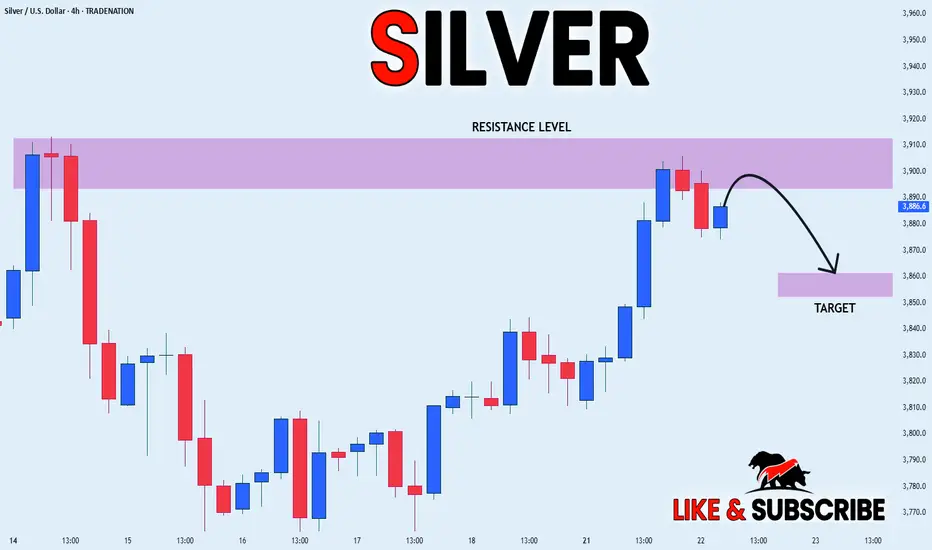
SILVER LOCAL SHORT|
✅SILVER has retested a key resistance level of 39.10$
And as the pair is already making a bearish pullback
A move down to retest the demand level below at 38.61$ is likely
SHORT🔥
✅Like and subscribe to never miss a new idea!✅
Disclosure: I am part of Trade Nation's Influencer program and receive a monthly fee for using their TradingView charts in my analysis.
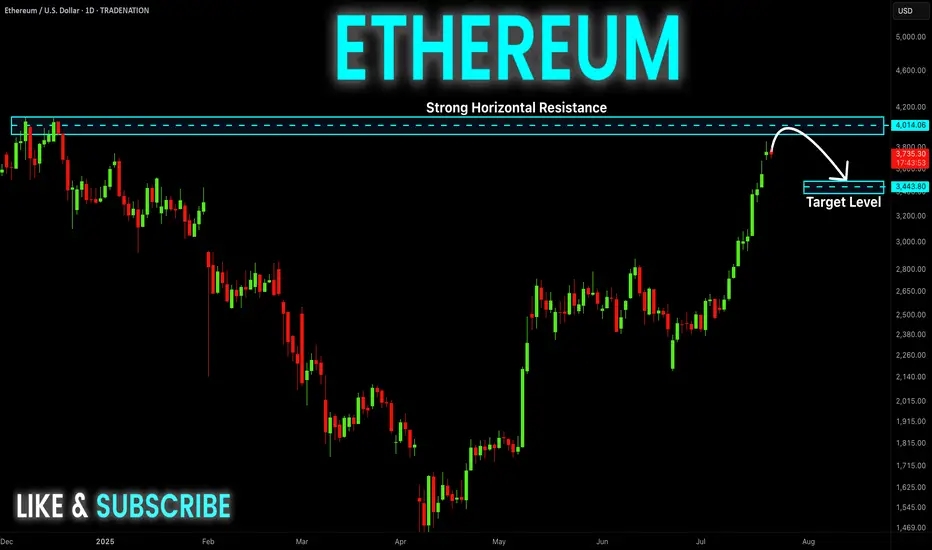
ETHEREUM Resistance Ahead! Sell!
Hello,Traders!
ETHEREUM is trading in a strong
Uptrend and the coin has grown
By more than 70% since the last low
So the coin is locally overbought
And after it retest the horizontal
Resistance of 4100$ we will be
Expecting a local bearish correction
Sell!
Comment and subscribe to help us grow!
Check out other forecasts below too!
Disclosure: I am part of Trade Nation's Influencer program and receive a monthly fee for using their TradingView charts in my analysis.
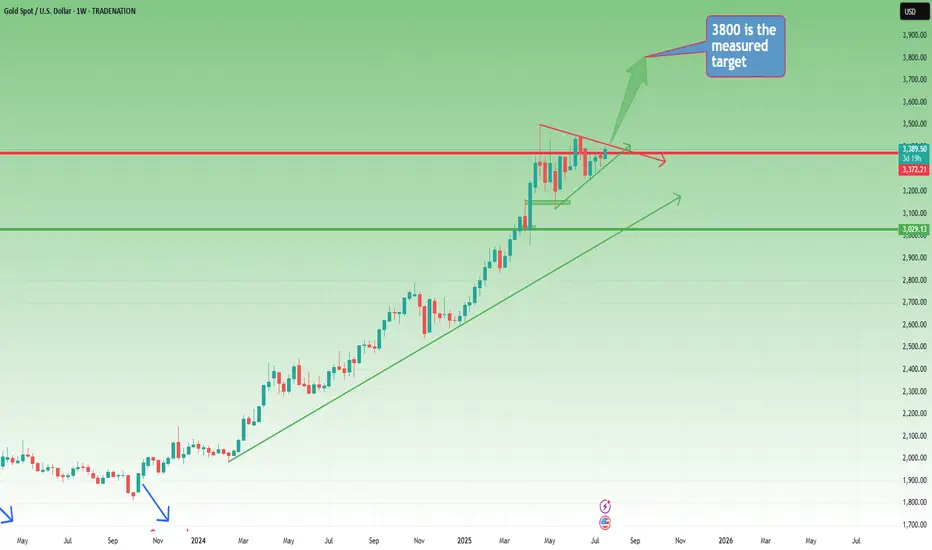
Weekly Outlook: Gold Builds Pressure – Is the Big Move Coming?📆 Big Picture View
Since the start of 2024, Gold has been moving in a well-defined long-term bullish trend.
Yes, there were meaningful pullbacks along the way — but the direction was never in doubt. Step by step, Gold climbed over 15,000 pips in just over a year, reaching a new all-time high in late April.
📉 Post-ATH: A Period of Stabilization
After peaking, Gold shifted into consolidation mode, with price gravitating around the 3300 zone.
This sideways movement has been ongoing for the past three months, but it’s not a sign of weakness — it’s the market catching its breath.
On the weekly chart, this consolidation is now forming a symmetrical triangle, a classic continuation pattern that often appears mid-trend.
📐 The Technical Setup
- The symmetrical triangle shows compression of volatility
- Buyers and sellers are slowly converging toward a decision point
- A breakout is approaching, and when it comes, it could be explosive
🎯 What’s the Trigger?
- A confirmed break above 3450 would validate the triangle breakout
- That opens the door to quickly test the 3500 round figure
- The measured target for the triangle sits at 3800
Given the time Gold has spent consolidating (3+ months), this target could realistically be reached by year’s end
🧭 Strategic Takeaway
- As long as Gold holds above 3300, the bullish structure remains valid
- Breakout above 3450 is the green light for the next leg up
- Until then, the consolidation continues, and smart money prepares
📌 Conclusion:
Gold is building pressure. The weekly triangle is maturing.
This isn’t the end — it’s the pause before the next move.
Stay patient. Stay focused.
Because if 3450 breaks… 3800 is not a dream — it’s a destination. 🚀
Disclosure: I am part of TradeNation's Influencer program and receive a monthly fee for using their TradingView charts in my analyses and educational articles.
P.S: Here you have a short term analysis on Gold
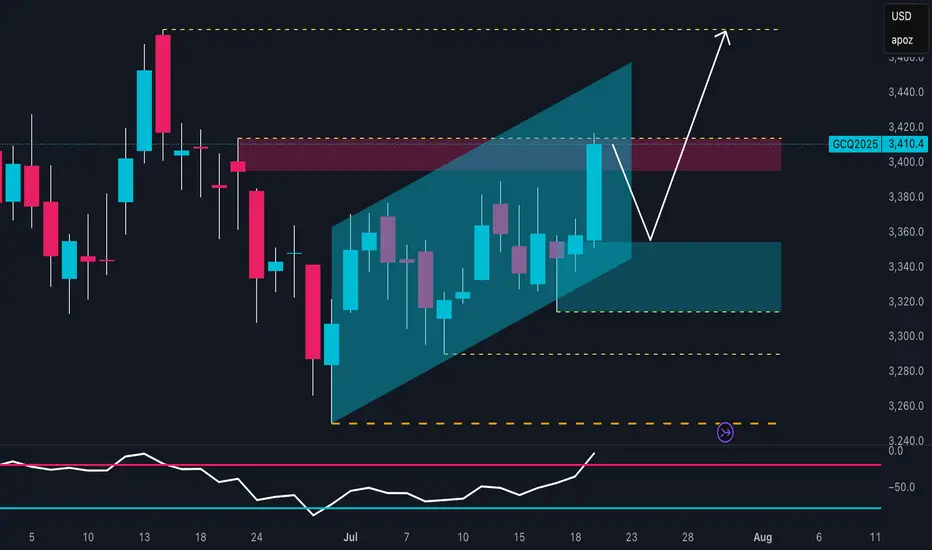
Gold Bulls Reloading? Smart Money Buys!The technical outlook on XAU/USD shows a well-defined bullish trend, developing within an ascending channel that started in late June. Price recently pushed toward the upper boundary of this channel, reaching a key resistance zone between 3,410 and 3,420 USD, which aligns with a previous supply area and significant daily structure. The reaction in this zone suggests a potential fake breakout, hinting at a short-term pullback before a continuation of the upward move.
The RSI oscillator supports this view, displaying bullish momentum with a breakout above the 60 level. However, the current slope hints at a possible minor correction before the next impulsive leg higher. The most relevant demand zone lies between 3,340 and 3,360 USD, at the base of the ascending channel—an ideal spot for buy orders to accumulate in anticipation of a move toward previous highs.
Backing this technical setup, the Commitment of Traders (COT) report as of July 15, 2025, paints a constructive picture. Non-commercial traders (institutional speculators) increased their long positions by over 8,500 contracts, while also cutting short positions by about 1,600 contracts, indicating a strong bullish bias. Commercials also increased their shorts (+16,448), a typical hedge during rallies, but not enough to invalidate the bullish structure.
From a seasonal perspective, July remains one of the historically strongest months for gold. According to MarketBulls data, over the past 2 years, gold has averaged gains of 105+ points in July, with solid returns also visible on the 5-year (+45 pts) and 10-year (+25 pts) averages. August also tends to be supportive, reinforcing the idea of a medium-term bullish extension.
Lastly, the retail sentiment is heavily skewed, with 72% of retail traders short, and only 28% long. From a contrarian standpoint, this is another strong bullish signal. When the majority of retail traders are short in a structurally bullish market, the potential for a short squeeze remains high.
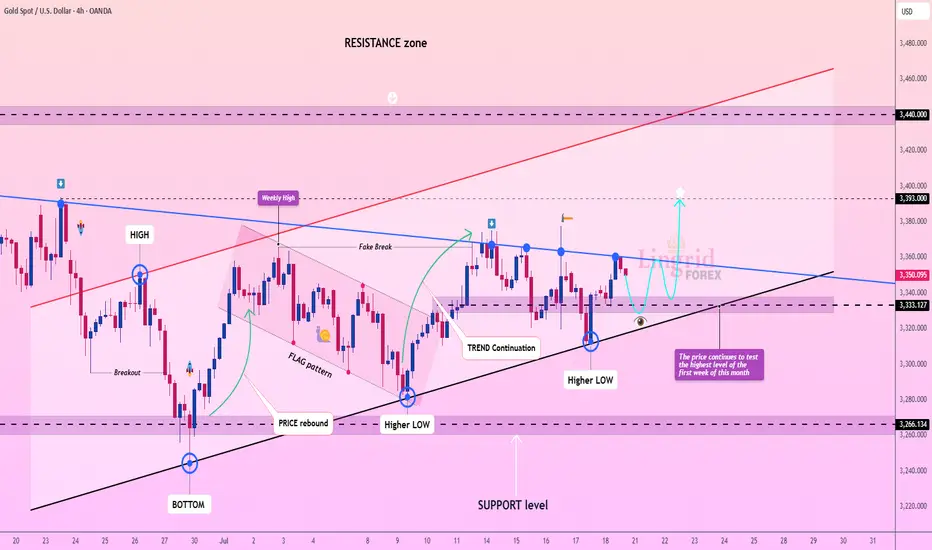
Lingrid | GOLD Weekly Analysis: Testing Resistance ZoneOANDA:XAUUSD markets are showing renewed strength as prices continue to test the highest levels reached in the first week of this month, demonstrating persistent bullish momentum despite ongoing consolidation. The precious metal is approaching a decisive technical juncture that could determine the next major directional move.
The chart reveals a compelling technical setup with gold forming higher lows while maintaining the upward trend continuation. After the previous fake breakout and flag pattern completion, the market has established a solid foundation above the $3,330 support level. The current structure shows a series of higher lows, confirming the underlying bullish bias.
The weekly high retest presents a crucial inflection point. A successful break above this level could trigger the next major leg higher toward the $3,400+ target zone, particularly given the ascending triangle formation and persistent institutional interest. The convergence of multiple technical indicators, including the trend continuation pattern and higher low formation, suggests accumulation at current levels.
Key levels to monitor include the immediate resistance at $3,393 and the critical $3,450 level. A decisive break above these levels would likely accelerate momentum toward $3,500-$3,600, while failure to maintain the higher low structure could see a pullback toward $3,285 support. The overall technical picture remains constructively bullish within the broader uptrend.
If this idea resonates with you or you have your own opinion, traders, hit the comments. I’m excited to read your thoughts!
NASDAQ Rebounding on its 1H MA50.Nasdaq (NDX) rebounded today on its 1H MA50 (blue trend-line), third time since Friday's and Thursday's bounce. A Channel Up is emerging and based on the 4H RSI it is a medium-term bullish reversal off the Pivot trend-line, similar to June 20 - 30.
As you can see, that Channel Up targeted the 2.618 Fibonacci extension before breaking below the 1H MA50 to start a lengthy consolidation. Based on that, we are targeting 23650 (Fib 2.618 ext) on the short-term.
-------------------------------------------------------------------------------
** Please LIKE 👍, FOLLOW ✅, SHARE 🙌 and COMMENT ✍ if you enjoy this idea! Also share your ideas and charts in the comments section below! This is best way to keep it relevant, support us, keep the content here free and allow the idea to reach as many people as possible. **
-------------------------------------------------------------------------------
Disclosure: I am part of Trade Nation's Influencer program and receive a monthly fee for using their TradingView charts in my analysis.
💸💸💸💸💸💸
👇 👇 👇 👇 👇 👇

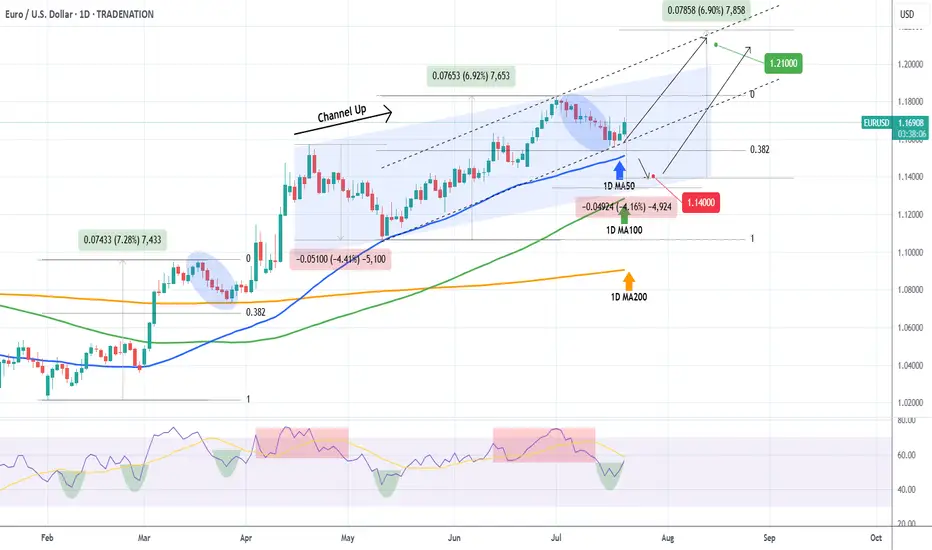
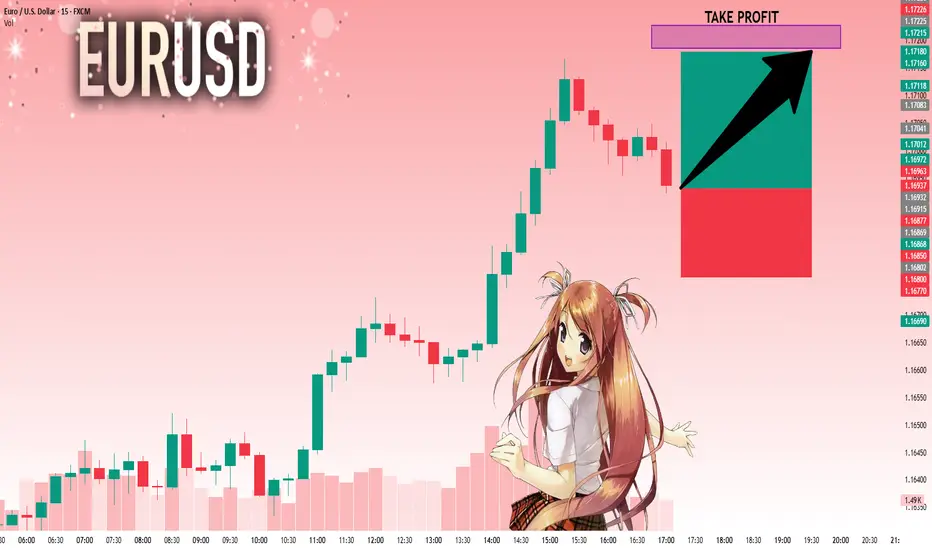
EURUSD Will the 1D MA50 hold?The EURUSD pair seems to be rebounding just before a 1D MA50 (blue trend-line) test, which is its short-term Support. At the same time it bounced off the 0.382 Fibonacci retracement level, which after a +6.92% rise, it resembles the March 27 rebound.
The 1D RSI is printing a standard bullish reversal setup, seen already 4 times since February, and a break above its MA will confirm it.
As long as the 1D MA50 holds, it may extend the uptrend to a new Channel Up (dashed), outside the blue one that may look for a new +6.92% rise. In that case our Target will be 1.21000.
If the 1D MA50 breaks, we will add one last buy at 1.14000, near the 1D MA100 (green trend-line).
-------------------------------------------------------------------------------
** Please LIKE 👍, FOLLOW ✅, SHARE 🙌 and COMMENT ✍ if you enjoy this idea! Also share your ideas and charts in the comments section below! This is best way to keep it relevant, support us, keep the content here free and allow the idea to reach as many people as possible. **
-------------------------------------------------------------------------------
Disclosure: I am part of Trade Nation's Influencer program and receive a monthly fee for using their TradingView charts in my analysis.
💸💸💸💸💸💸
👇 👇 👇 👇 👇 👇
EURUSD: Target Is Up! Long!
My dear friends,
Today we will analyse EURUSD together☺️
The recent price action suggests a shift in mid-term momentum. A break above the current local range around 1.16915 will confirm the new direction upwards with the target being the next key level of 1.17187 and a reconvened placement of a stop-loss beyond the range.
❤️Sending you lots of Love and Hugs❤️
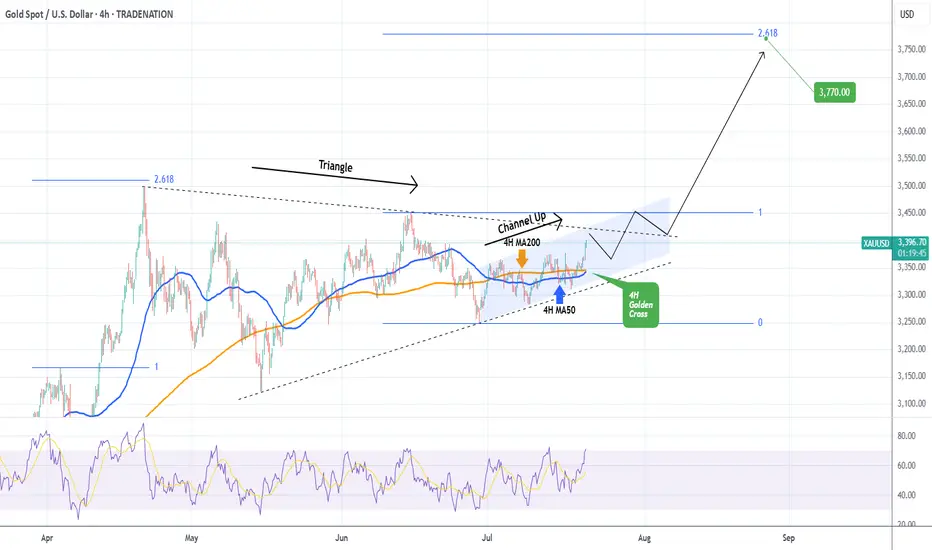
XAUUSD 4H Golden Cross preparing a massive break-out.Gold (XAUUSD) has been trading on a 3-week Channel Up, which is approaching its top but at the same time, it's been trading within a 3-month Triangle, which is also approaching its top.
The key here is the formation today of a Golden Cross on the 4H time-frame, the first since May 28. Being at the end of the long-term Triangle pattern is technically translated to the structure's tendency to look for a decisive break-out above its top that attracts volume (buyers).
It is possible to see an initial rejection followed by a break-out that will re-test the top of the Triangle as Support and then follow the long-term trend dynamics. Those are technically bullish and previous break-out in April targeted the 2.618 Fibonacci extension. Our Target remains a little below it at $3770.
-------------------------------------------------------------------------------
** Please LIKE 👍, FOLLOW ✅, SHARE 🙌 and COMMENT ✍ if you enjoy this idea! Also share your ideas and charts in the comments section below! This is best way to keep it relevant, support us, keep the content here free and allow the idea to reach as many people as possible. **
-------------------------------------------------------------------------------
Disclosure: I am part of Trade Nation's Influencer program and receive a monthly fee for using their TradingView charts in my analysis.
💸💸💸💸💸💸
👇 👇 👇 👇 👇 👇
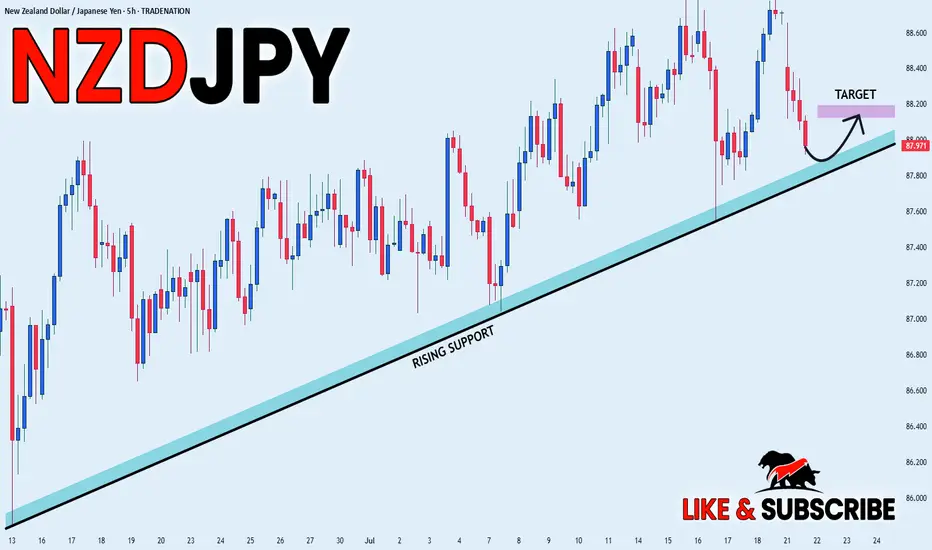
NZD_JPY RISING SUPPORT AHEAD|LONG|
✅NZD_JPY went down from
The resistance just as I predicted
In my previous analysis but now
The pair is approaching a rising
Support line from where we will
Be expecting a local bullish rebound
LONG🚀
✅Like and subscribe to never miss a new idea!✅
Disclosure: I am part of Trade Nation's Influencer program and receive a monthly fee for using their TradingView charts in my analysis.
USD-CHF Bearish Wedge! Sell!
Hello,Traders!
USD-CHF is trading in a
Downtrend and has formed
A bearish wedge pattern
So IF we see a breakout
Then we a further bearish
Continuation will be expected
Sell!
Comment and subscribe to help us grow!
Check out other forecasts below too!
Disclosure: I am part of Trade Nation's Influencer program and receive a monthly fee for using their TradingView charts in my analysis.

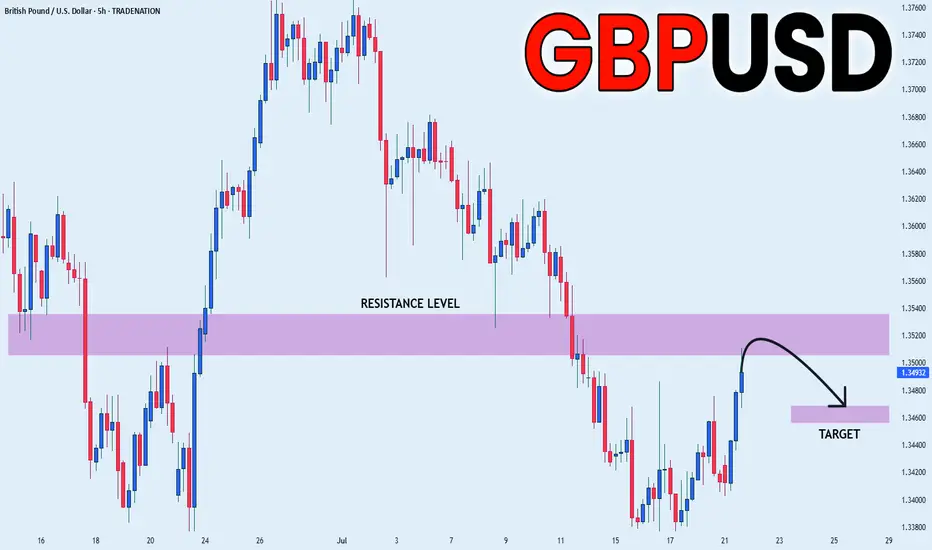
GBP_USD RESISTANCE AHEAD|SHORT|
✅GBP_USD has been growing recently
And the pair seems locally overbought
So as the pair is approaching
A horizontal resistance of 1.3520
Price decline is to be expected
SHORT🔥
✅Like and subscribe to never miss a new idea!✅
Disclosure: I am part of Trade Nation's Influencer program and receive a monthly fee for using their TradingView charts in my analysis.
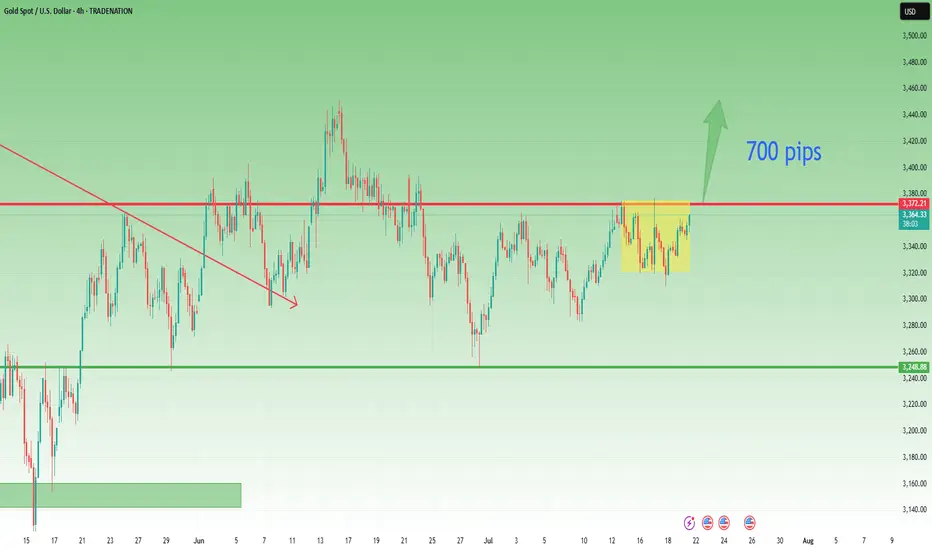
Gold Outlook – The Range Holds, Direction Still Pending📆 What happened recently?
Since the middle of last week, I’ve been repeating the same core idea like a broken record:
👉 “Gold needs to break out of the range to define its next real move.”
And once again, on Friday, TRADENATION:XAUUSD respected the structure, fluctuating quietly and closing the week right in the middle of the range — no breakout, no confirmation.
📈 Current status:
The new week opened with some bullish interest, and at the time of writing, Gold trades around 3363. Still inside the box.
So far, no technical change, and certainly no resolution.
❓ What am I watching for?
A clear break above 3375 → confirms bullish continuation
A decisive break below 3320 → confirms reversal potential
Until then, everything in between is noise and chop.
🧭 Trading plan:
My stance remains unchanged:
⏳ No position. No bias. Just waiting.
Once we get confirmation in either direction, I’ll take action.
📌 Conclusion:
Gold is still locked inside the range. The market is coiling, but no side is winning yet.
Patience here is a weapon — and I’m keeping it loaded. 🚀
Disclosure: I am part of TradeNation's Influencer program and receive a monthly fee for using their TradingView charts in my analyses and educational articles.
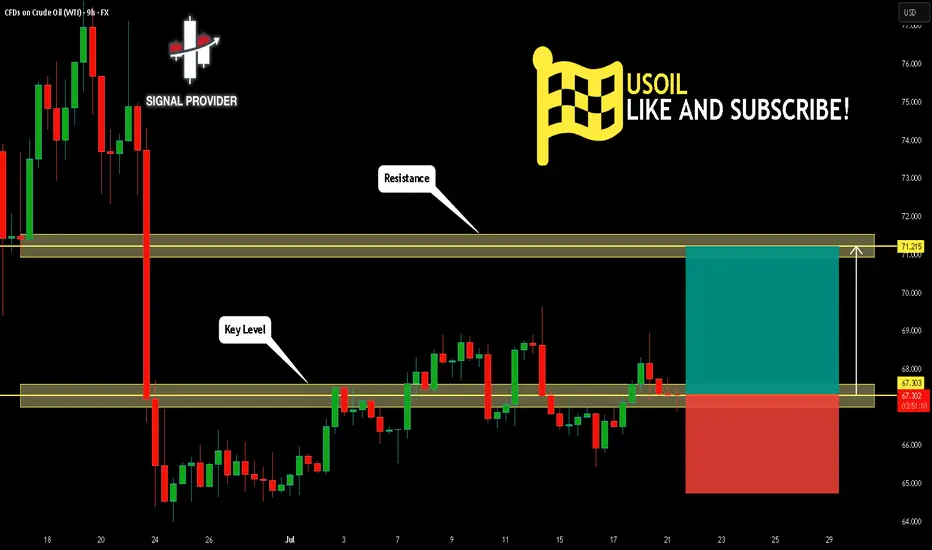
USOIL Will Go Higher! Buy!
Take a look at our analysis for USOIL.
Time Frame: 9h
Current Trend: Bullish
Sentiment: Oversold (based on 7-period RSI)
Forecast: Bullish
The market is approaching a key horizontal level 67.303.
Considering the today's price action, probabilities will be high to see a movement to 71.215.
P.S
We determine oversold/overbought condition with RSI indicator.
When it drops below 30 - the market is considered to be oversold.
When it bounces above 70 - the market is considered to be overbought.
Disclosure: I am part of Trade Nation's Influencer program and receive a monthly fee for using their TradingView charts in my analysis.
Like and subscribe and comment my ideas if you enjoy them!
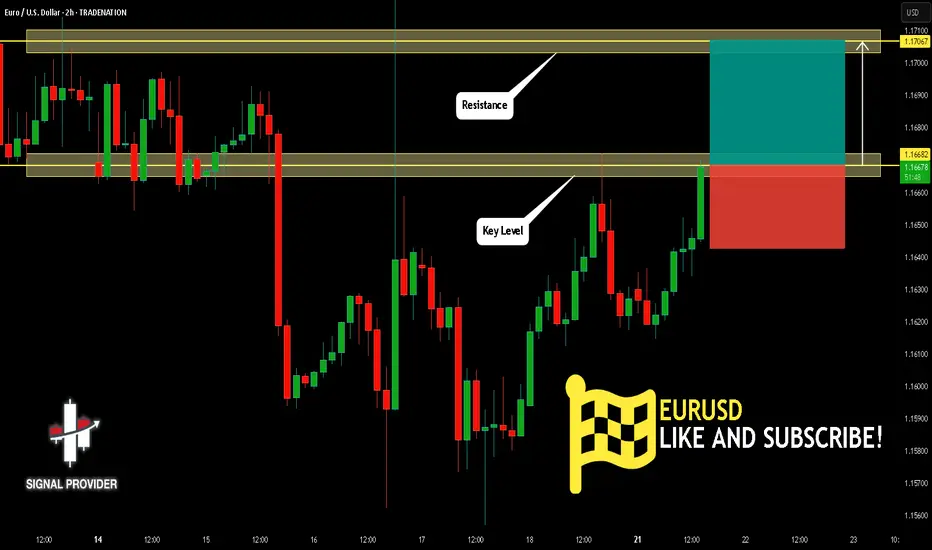
EURUSD Will Go Up! Long!
Please, check our technical outlook for EURUSD.
Time Frame: 2h
Current Trend: Bullish
Sentiment: Oversold (based on 7-period RSI)
Forecast: Bullish
The market is approaching a significant support area 1.166.
The underlined horizontal cluster clearly indicates a highly probable bullish movement with target 1.170 level.
P.S
Overbought describes a period of time where there has been a significant and consistent upward move in price over a period of time without much pullback.
Disclosure: I am part of Trade Nation's Influencer program and receive a monthly fee for using their TradingView charts in my analysis.
Like and subscribe and comment my ideas if you enjoy them!
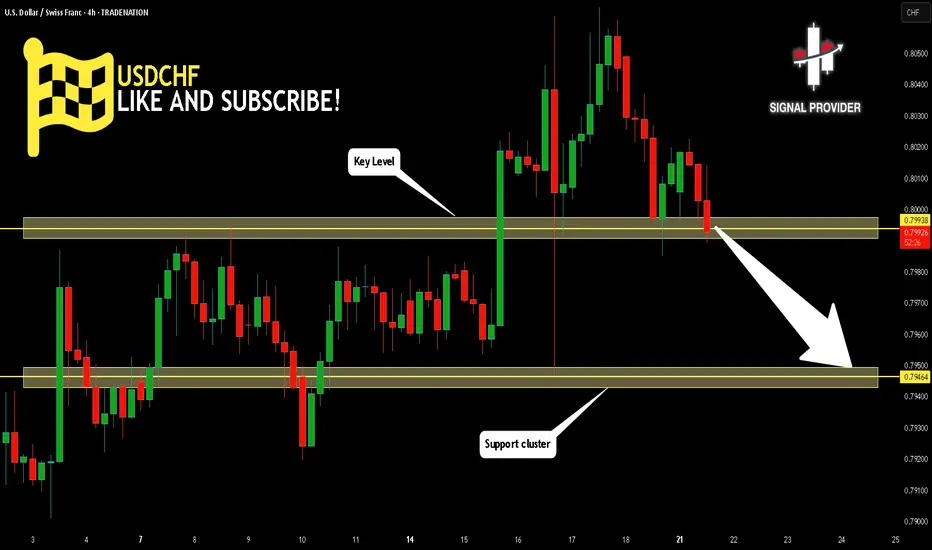
USDCHF Will Move Lower! Sell!
Here is our detailed technical review for USDCHF.
Time Frame: 4h
Current Trend: Bearish
Sentiment: Overbought (based on 7-period RSI)
Forecast: Bearish
The market is on a crucial zone of supply 0.799.
The above-mentioned technicals clearly indicate the dominance of sellers on the market. I recommend shorting the instrument, aiming at 0.794 level.
P.S
Please, note that an oversold/overbought condition can last for a long time, and therefore being oversold/overbought doesn't mean a price rally will come soon, or at all.
Disclosure: I am part of Trade Nation's Influencer program and receive a monthly fee for using their TradingView charts in my analysis.
Like and subscribe and comment my ideas if you enjoy them!