BTC/USDT – 4H Chart Technical AnalysisBTC/USDT – 4H Chart Technical Analysis
Market Structure & Trend
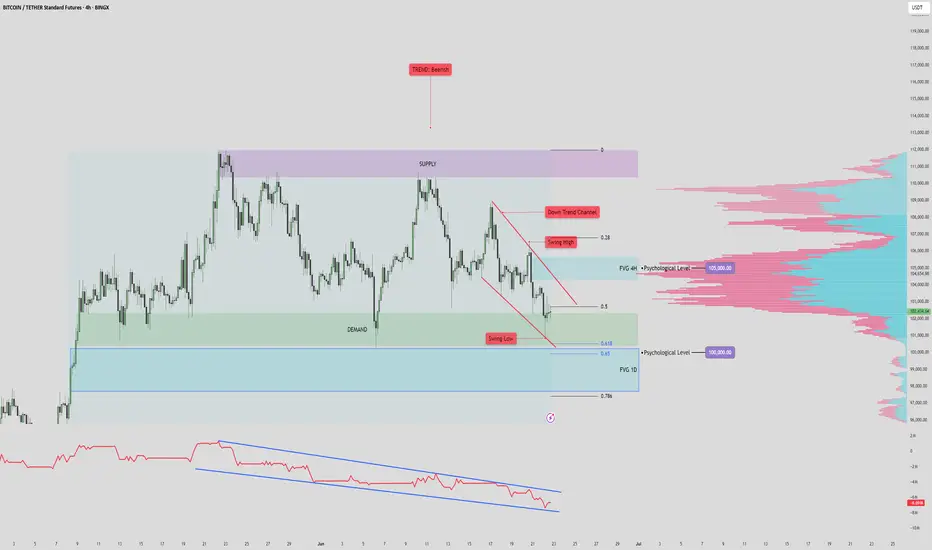
Overall Trend : Bearish (clearly defined by a consistent downtrend channel).
Current Structure : Price is in a corrective downtrend within a descending channel, after multiple rejections from the supply zone.
Key Technical Zones
1. Supply Zone
Strong rejection zone where the price previously reversed sharply.
Still acting as resistance, located around the upper range.
2. Demand Zone
Currently being retested for the fifth time, weakening its strength.
Recent price action shows liquidity sweep and swing low break inside this zone, potentially trapping early longs.
Fair Value Gaps (FVG) & Fibonacci Levels
1D FVG sits below the current demand, aligning with:
Golden Pocket (0.618–0.65 Fib).
Acts as a high-probability bounce zone for long entries if demand fails.
A break below this FVG could open up deeper downside toward the 0.786 Fib or beyond.
Psychological Levels
105,000 – Major resistance & potential take-profit area for long positions.
100,000 – Key support and liquidity magnet if the demand zone fails.
Volume Profile
High Volume Node: 102,000 – 106,800 — price tends to gravitate here, indicating potential consolidation or resistance.
Low Volume Area: Below 100,500 — suggests thin liquidity, which may cause sharp moves if price drops into this range.
Scenarios & Trade Ideas
Bullish Scenario
If price holds above the demand zone (after multiple retests) and confirms on LTF:
Potential Long to local resistance.
On breakout, target the 105,000 psychological level.
Confluence: High volume area offers both support and a magnet.
Bearish Scenario
If price fails to hold the demand zone:
Enter short position targeting the 1D FVG and 100,000 psychological level.
If that breaks, expect sharp continuation due to low volume below.
Conclusion
Price is at a pivotal point — currently balancing on weakened demand after multiple retests. Watch for LTF confirmation:
Above demand = bullish recovery setup.
Below demand = bearish continuation toward 100,000 and the FVG.
Manage risk tightly due to the proximity of both key zones.
Signals
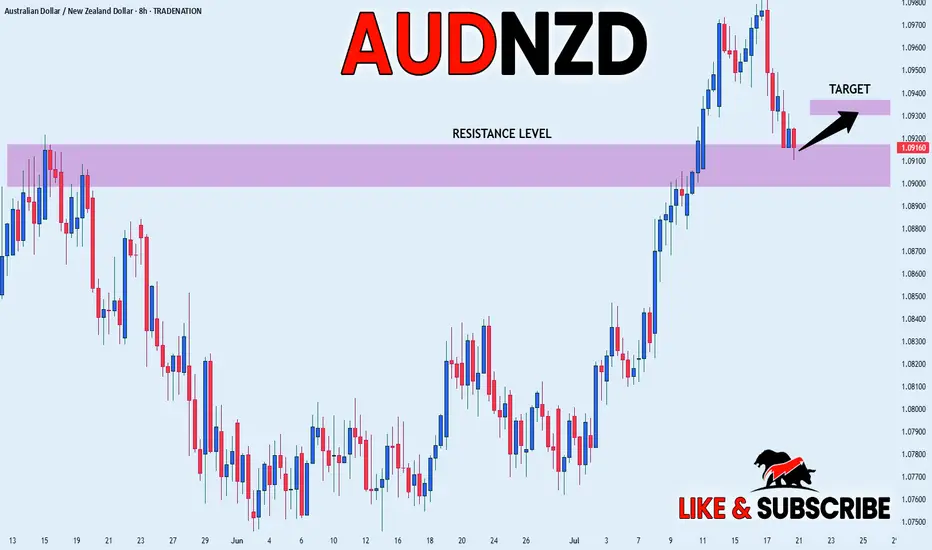
AUD_NZD GROWTH AHEAD|LONG|
✅AUD_NZD fell down sharply
But a strong support level was hit at 1.0910
Thus I am expecting a rebound
And a move up towards the target of 1.0930
LONG🚀
✅Like and subscribe to never miss a new idea!✅
Disclosure: I am part of Trade Nation's Influencer program and receive a monthly fee for using their TradingView charts in my analysis.
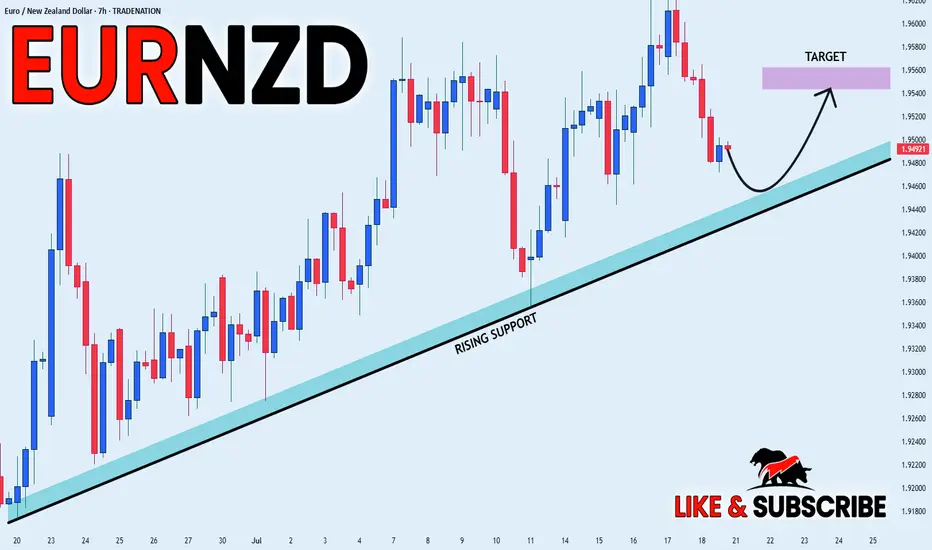
EUR-NZD Will Grow! Buy!
Hello,Traders!
EUR-NZD is making a local
Bearish correction while trading
In an uptrend along he rising
Support so after the pair hits
The support line a local bullish
Rebound is to be expected
Buy!
Comment and subscribe to help us grow!
Check out other forecasts below too!
Disclosure: I am part of Trade Nation's Influencer program and receive a monthly fee for using their TradingView charts in my analysis.
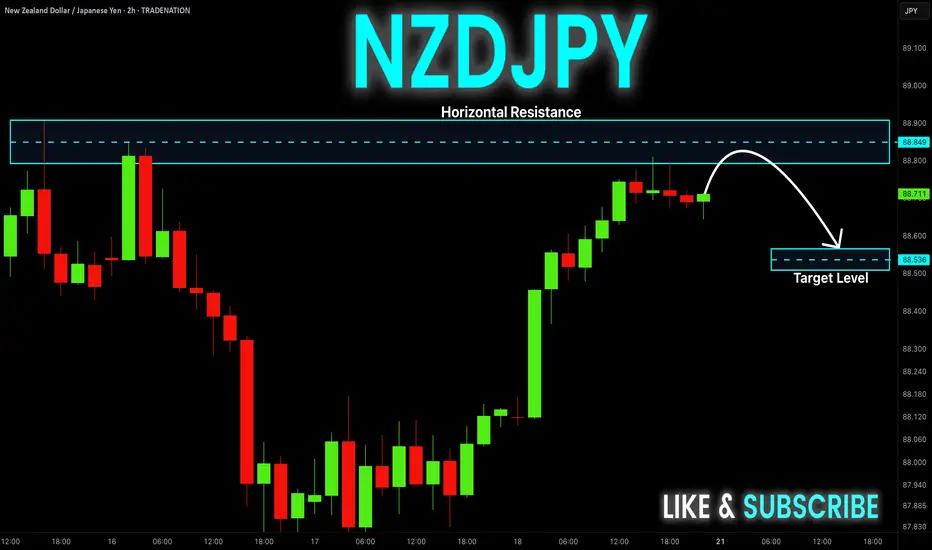
NZD-JPY Local Short! Sell!
Hello,Traders!
NZD-JPY has hit a horizontal
Resistance level of 88.851
And we are already seeing
A bearish reaction so we will
Be expecting a local
Bearish move down
On Monday!
Sell!
Comment and subscribe to help us grow!
Check out other forecasts below too!
Disclosure: I am part of Trade Nation's Influencer program and receive a monthly fee for using their TradingView charts in my analysis.
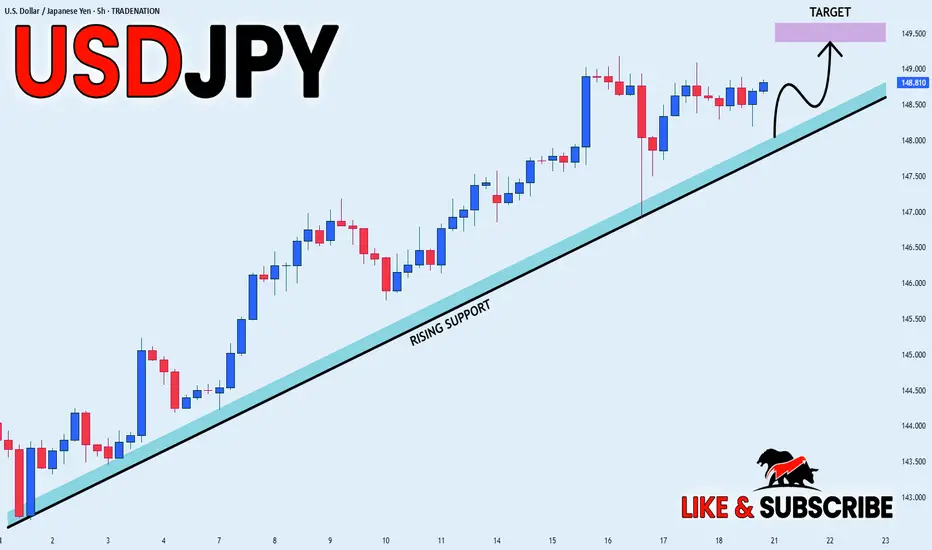
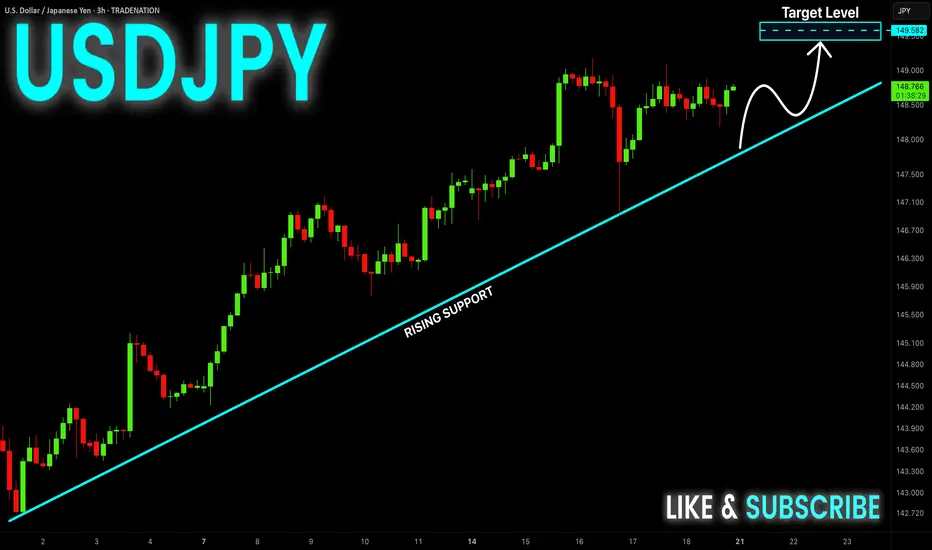
USD_JPY STRONG UPTREND|LONG|
✅USD_JPY is in a strong
Long-term uptrend now
And the pair is accumulating
For the next leg up so we will
Be expecting a bullish continuation
On Monday!
LONG🚀
✅Like and subscribe to never miss a new idea!✅
Disclosure: I am part of Trade Nation's Influencer program and receive a monthly fee for using their TradingView charts in my analysis.
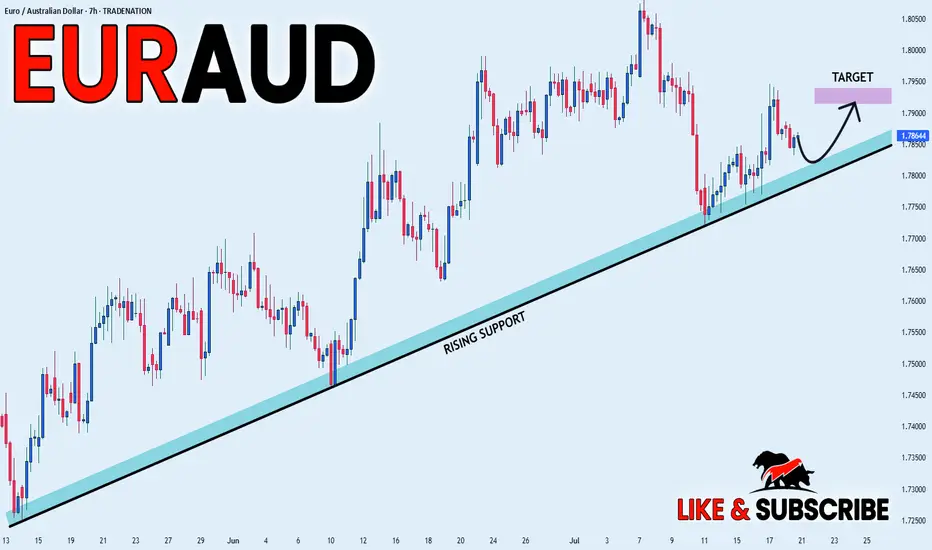
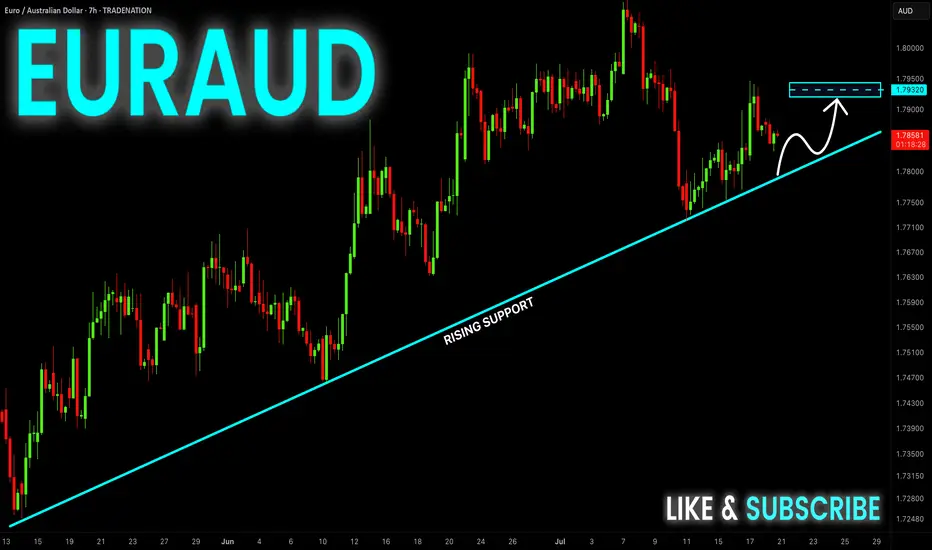
EUR_AUD WILL GROW|LONG|
✅EUR_AUD is trading in an uptrend
With the pair set to retest
The rising support line
From where I think the growth will continue
LONG🚀
✅Like and subscribe to never miss a new idea!✅
Disclosure: I am part of Trade Nation's Influencer program and receive a monthly fee for using their TradingView charts in my analysis.
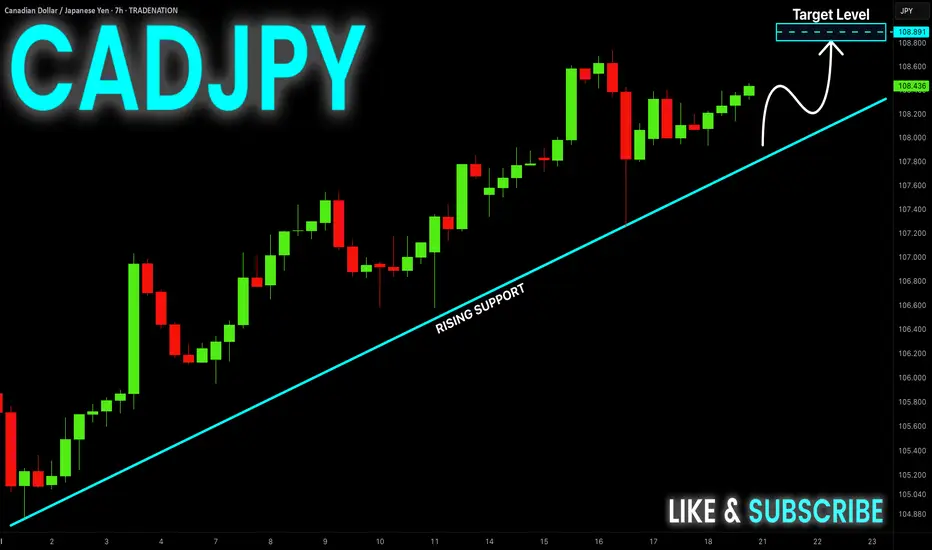
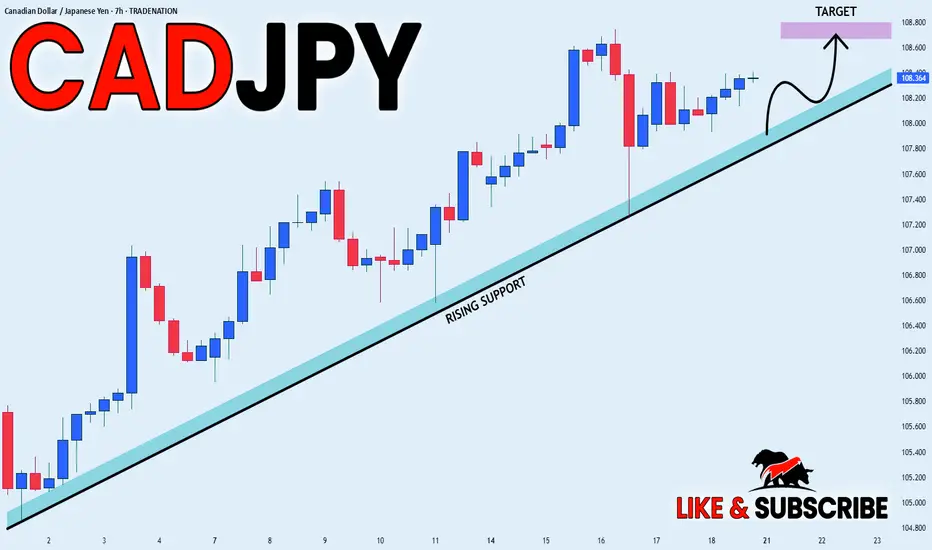
CAD-JPY Will Keep Growing! Buy!
Hello,Traders!
CAD-JPY keeps trading in
An uptrend and there is a
Rising support below so
We are bullish biased
And we will be expecting
A further bullish move up
Buy!
Comment and subscribe to help us grow!
Check out other forecasts below too!
Disclosure: I am part of Trade Nation's Influencer program and receive a monthly fee for using their TradingView charts in my analysis.
TRB : FREE SIGNALHello friends🙌
📈Given the price reaching its bottom and the buyers supporting it, you can see that a classic head and shoulders pattern has formed and buyers have entered. For this reason, you can buy with capital and risk management and move with it to the specified targets.
🔥Follow us for more signals🔥
*Trade safely with us*

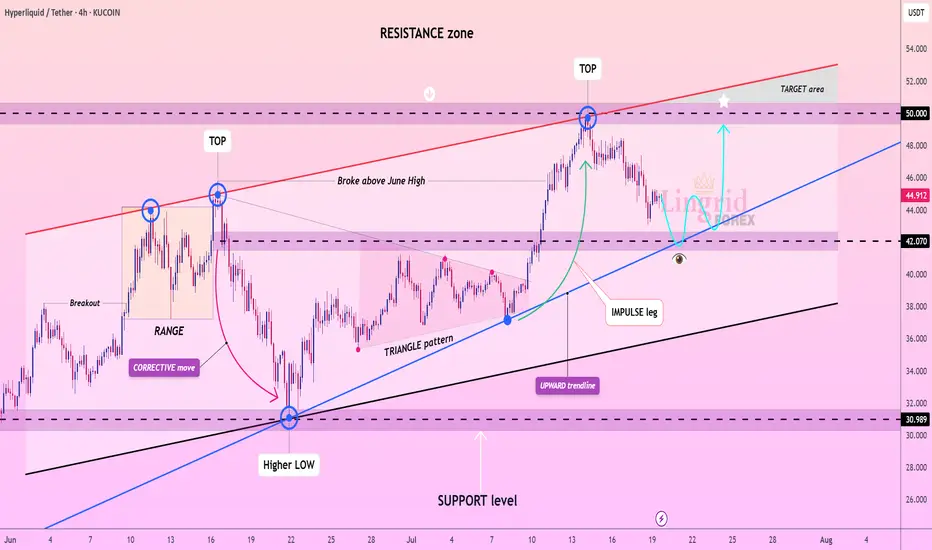
Lingrid | HYPEUSDT potential Rebound from the Support ZoneThe price perfectly fulfilled my last idea . KUCOIN:HYPEUSDT recently surged above the triangle pattern and tested the key resistance near 50, forming a local top. After a healthy retracement, price is now approaching the blue upward trendline and support zone near 42, setting the stage for another bullish bounce. The structure reveals a higher low and a strong impulse leg, suggesting continuation toward the upper resistance area. The chart favors bullish continuation after retest confirmation of the ascending support.
📉 Key Levels
Buy trigger: Bounce from 42.5–43.5 zone
Buy zone: 42.0–43.0
Target: 50.0 with potential to 52.0
Invalidation: Breakdown below 40.0
💡 Risks
Failure to hold trendline support
False breakout rejection below 42.0
Broader market sentiment turning risk-off
If this idea resonates with you or you have your own opinion, traders, hit the comments. I’m excited to read your thoughts!
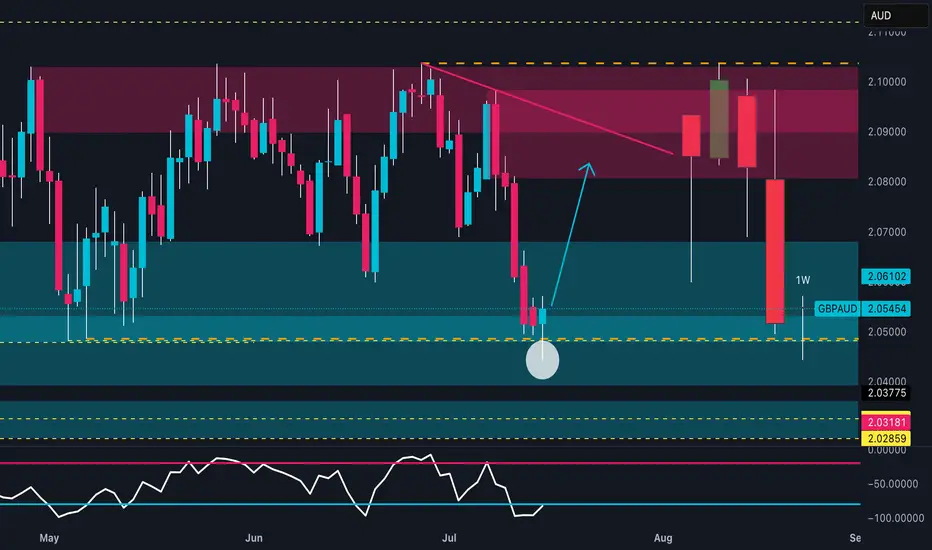
GBPAUD: Weekly Reversal | COT & Seasonality Support Bullish📊 Technical Outlook
Price strongly reacted from a key weekly demand zone between 2.0400 and 2.0500, showing clear absorption of bearish pressure. The RSI is rebounding from the 30 area, signaling early reversal potential.
The next technical target lies between 2.08900 and 2.10000, within a well-defined supply zone.
An early bullish reversal is in progress, with potential for a swing move toward the red zone.
🧠 Commitment of Traders (COT Report – 08/07/2025)
GBP: Non-commercial traders are net long, with positioning growing across the board: +869 longs / -926 shorts. Commercials reduce shorts and increase longs → Bullish bias.
AUD: Non-commercials are clearly short (-2,267 longs / +1,957 shorts). Commercials are increasing long exposure (+2,629), but still in the minority → Bearish bias.
➡️ The COT spread confirms a GBP long vs AUD short bias.
📅 Seasonality (July)
GBP: Historically strong in July, with average monthly gains across all timeframes (especially the 2Y window).
AUD: Less favorable seasonal profile in July; flat to slightly negative across all time horizons.
➡️ Seasonality supports GBP strength.
📉 Retail Sentiment
58% Long / 42% Short on GBPAUD
➡️ Retail traders are still heavily long → a shakeout of weak long hands is possible before the real rally begins.
🎯 Strategic Conclusion
GBP shows bullish convergence across technical, COT, and seasonal factors. AUD presents clear weakness.
The current price zone offers a clean entry point for longs, targeting the 2.08900–2.10000 supply zone.
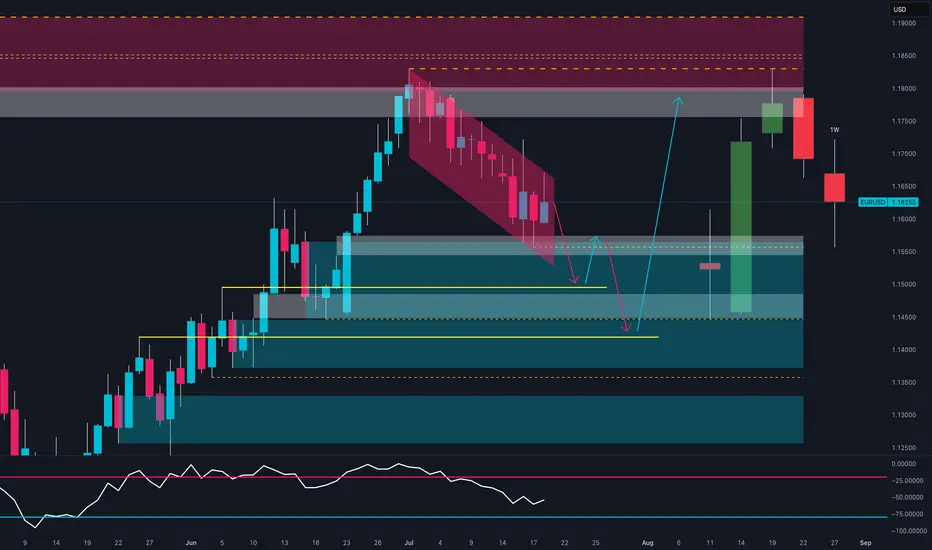
Smart Money Reloading: Will EUR/USD Explode from Demand Zone?📊 Technical Context (Daily)
EUR/USD is currently in a corrective phase following the strong June rebound from the 1.1450 area, which culminated in a high near the 1.1850 supply zone.
The recent bearish move has pushed the pair back into a key demand area between 1.1450 and 1.1550, a zone that has acted as support multiple times in the past.
The latest weekly candle shows a potential bullish exhaustion signal (long lower wick), with the RSI hovering in oversold territory.
📌 Primary scenario: Possible consolidation above 1.1550 followed by a bullish continuation toward 1.1750–1.1800.
📌 Alternative scenario: Break of the recent lows could lead to a deeper retest of the 1.1350 zone.
📈 COT (Commitment of Traders)
Non-commercial positioning shows growing bullish interest in the euro:
EUR: +971 new longs, -6,654 shorts → strong increase in net long exposure.
USD Index: -267 longs, +92 spreads → signs of institutional indecision on the dollar.
This suggests a favorable shift toward the euro by smart money.
💡 Retail Sentiment
Retail traders remain heavily short on EUR/USD (63% short) with an average entry price of 1.1579.
This reinforces the contrarian bullish case, as retail traders are trapped short in a potential reversal zone.
📆 Seasonality
Historically, July has been a bullish month for EUR/USD:
➕ 2Y average return: +0.0287
➕ 5Y average return: +0.0166
This supports a seasonal bullish bias aligning with the current technical setup.
✅ Operational Outlook
EUR/USD is trading at a technically and macroeconomically significant area. The confluence of:
Weekly demand zone being tested
RSI in oversold conditions
COT positioning favoring the euro
Retail sentiment skewed short
Bullish seasonality
…makes a bullish bounce plausible in the coming weeks, with a first target at 1.1750. Invalidation level below 1.1450.
📌 Bias: Moderately Bullish
📍 Technical Activation Zone: Above 1.1550 with confirmed bullish price action
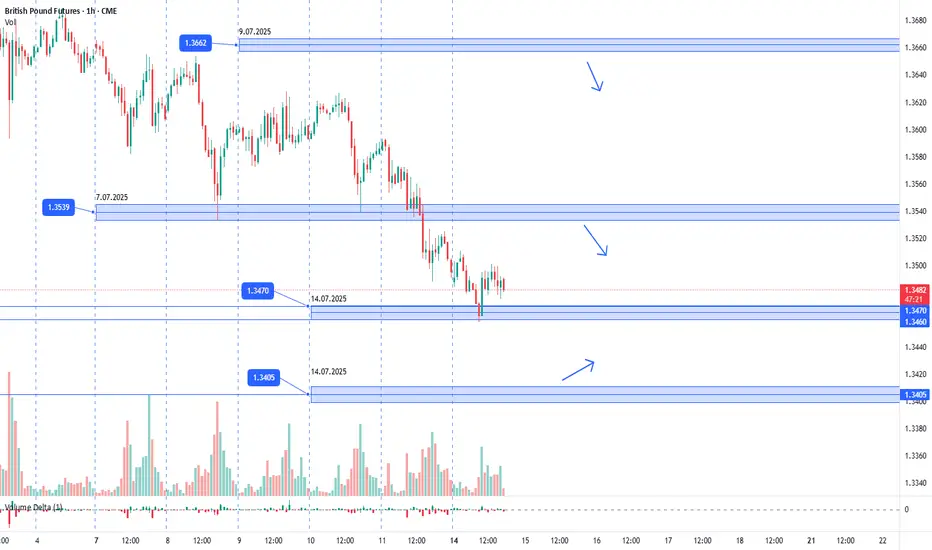
GBPUSD. 14.07.2025. The plan for the next few days.The nearest interesting resistance zone was already worked out in the morning and gave a good reaction. Let's mark the others where we can expect a reaction. It's not certain that there will be a major reversal, but I think we'll see a correction that can be monetized. We're waiting for a reaction and looking for an entry point.
The post will be adjusted based on any changes.
Don't forget to click on the Rocket! =)
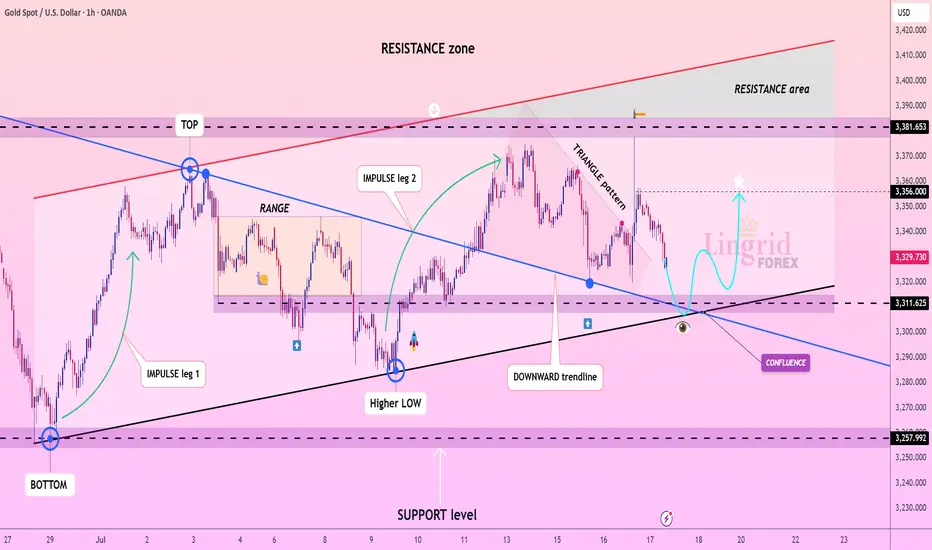
Lingrid | GOLD Continues to See Range-Bound MovementOANDA:XAUUSD is forming a bullish structure above the confluence of the downward trendline and horizontal support at 3,310. A strong impulse move followed by a triangle consolidation hints at an emerging continuation pattern, with buyers preparing for another leg higher. Price is currently approaching a key decision zone where previous support and diagonal confluence intersect, creating a launchpad scenario. If price confirms support above 3,311, a rebound toward the 3,356–3,382 zone becomes likely.
📉 Key Levels
Buy trigger: Rebound from 3,310–3,320
Buy zone: 3,300–3,315
Target: 3,356 and potentially 3,380
Invalidation: Break and close below 3,250
💡 Risks
Breakdown below the support zone may trigger extended retracement
False breakout through triangle resistance without volume
Sudden volatility from macroeconomic catalysts (e.g., Fed comments or CPI data)
If this idea resonates with you or you have your own opinion, traders, hit the comments. I’m excited to read your thoughts!
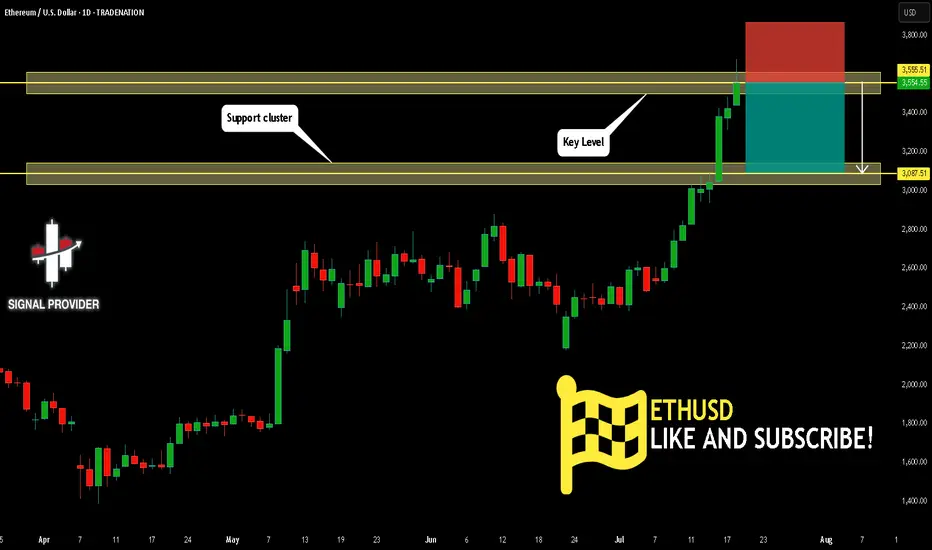
ETHUSD Will Fall! Short!
Take a look at our analysis for ETHUSD.
Time Frame: 1D
Current Trend: Bearish
Sentiment: Overbought (based on 7-period RSI)
Forecast: Bearish
The market is approaching a key horizontal level 3,555.51.
Considering the today's price action, probabilities will be high to see a movement to 3,087.51.
P.S
Please, note that an oversold/overbought condition can last for a long time, and therefore being oversold/overbought doesn't mean a price rally will come soon, or at all.
Disclosure: I am part of Trade Nation's Influencer program and receive a monthly fee for using their TradingView charts in my analysis.
Like and subscribe and comment my ideas if you enjoy them!
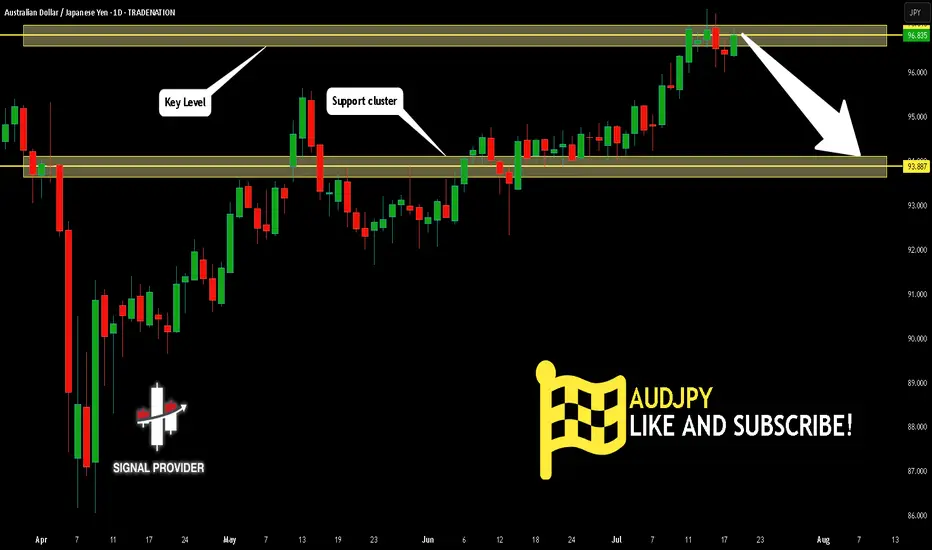
AUDJPY Will Go Lower From Resistance! Sell!
Please, check our technical outlook for AUDJPY.
Time Frame: 1D
Current Trend: Bearish
Sentiment: Overbought (based on 7-period RSI)
Forecast: Bearish
The market is approaching a significant resistance area 96.835.
Due to the fact that we see a positive bearish reaction from the underlined area, I strongly believe that sellers will manage to push the price all the way down to 93.887 level.
P.S
The term oversold refers to a condition where an asset has traded lower in price and has the potential for a price bounce.
Overbought refers to market scenarios where the instrument is traded considerably higher than its fair value. Overvaluation is caused by market sentiments when there is positive news.
Disclosure: I am part of Trade Nation's Influencer program and receive a monthly fee for using their TradingView charts in my analysis.
Like and subscribe and comment my ideas if you enjoy them!
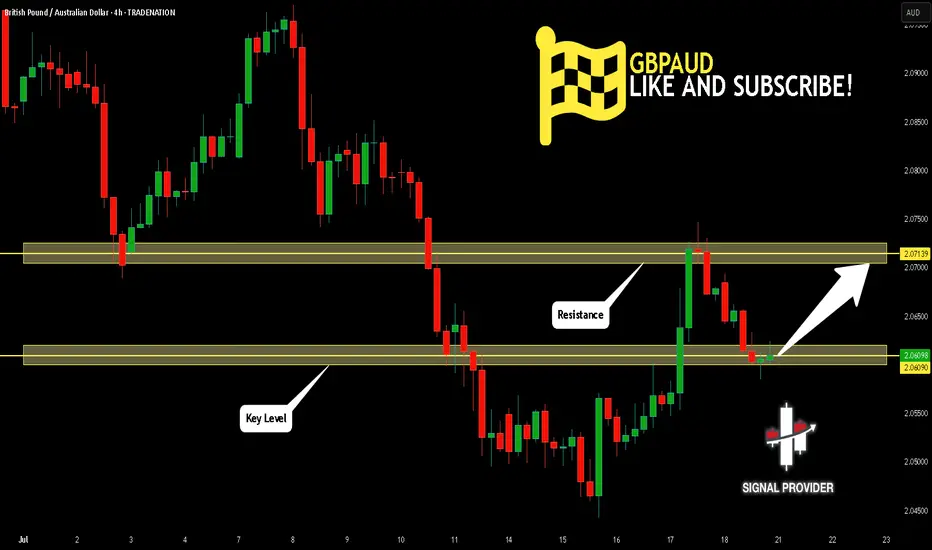
GBPAUD Will Go Up From Support! Long!
Here is our detailed technical review for GBPAUD.
Time Frame: 4h
Current Trend: Bullish
Sentiment: Oversold (based on 7-period RSI)
Forecast: Bullish
The market is on a crucial zone of demand 2.060.
The oversold market condition in a combination with key structure gives us a relatively strong bullish signal with goal 2.071 level.
P.S
We determine oversold/overbought condition with RSI indicator.
When it drops below 30 - the market is considered to be oversold.
When it bounces above 70 - the market is considered to be overbought.
Disclosure: I am part of Trade Nation's Influencer program and receive a monthly fee for using their TradingView charts in my analysis.
Like and subscribe and comment my ideas if you enjoy them!
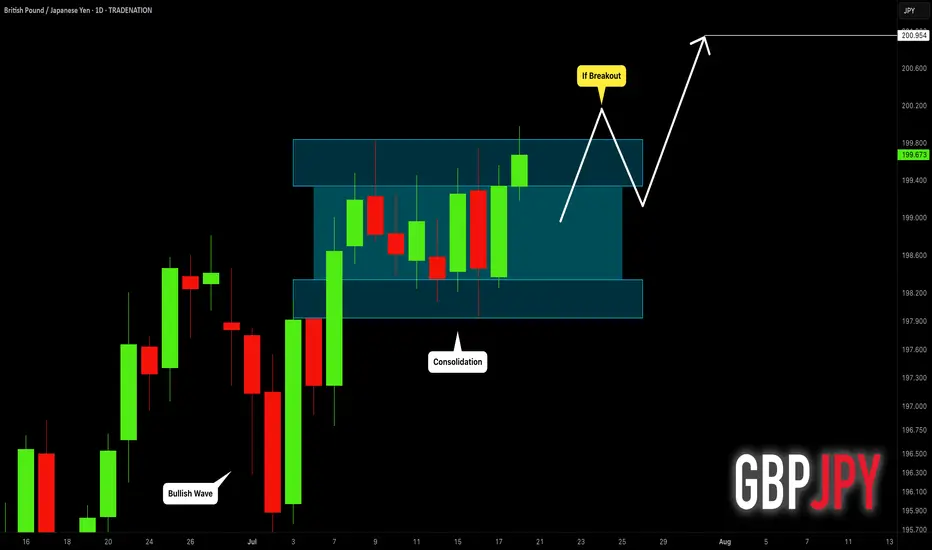
GBPJPY: Get Ready to Buy 🇬🇧🇯🇵
GBPJPY is consolidating within a narrow horizontal range
on a daily time frame.
I am waiting for its bullish breakout and a daily candle close above
199.85 to confirm the next bullish wave.
A rise will be expected to 201 level then.
❤️Please, support my work with like, thank you!❤️
I am part of Trade Nation's Influencer program and receive a monthly fee for using their TradingView charts in my analysis.
CAD_JPY BULLISH BIAS|LONG|
✅CAD_JPY is trading along
The rising support
And as the pair will soon retest it
I am expecting the price to go up
To retest the supply levels
Above at 108.708
LONG🚀
✅Like and subscribe to never miss a new idea!✅
Disclosure: I am part of Trade Nation's Influencer program and receive a monthly fee for using their TradingView charts in my analysis.
EUR-AUD Strong Uptrend! Buy!
Hello, Traders!
EUR-AUD is trading along
The rising support line in a
Strong uptrend so we we are
Bullish biased and as the pair
Is going down to retest the
Support we will be expecting
A rebound and a move up
Buy!
Comment and subscribe to help us grow!
Check out other forecasts below too!
Disclosure: I am part of Trade Nation's Influencer program and receive a monthly fee for using their TradingView charts in my analysis.
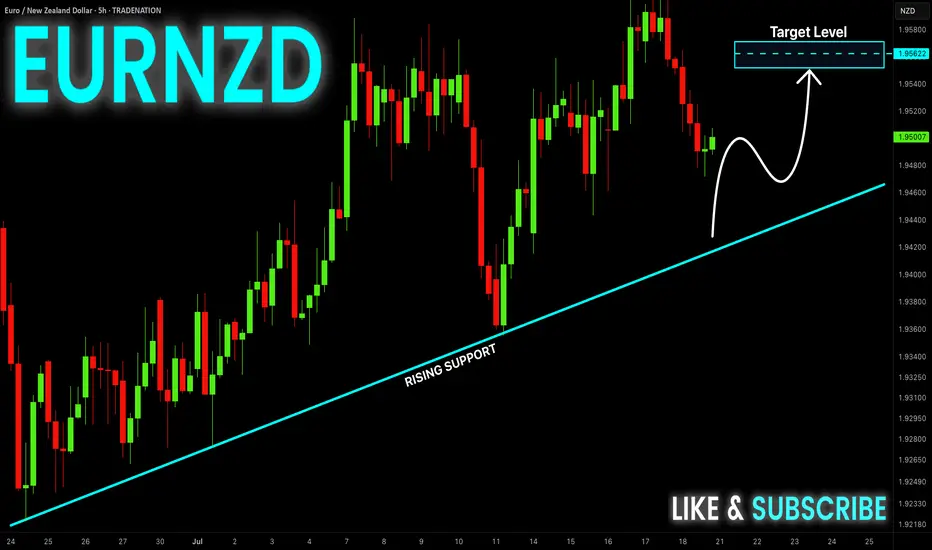
EUR_NZD LONG FROM RISING SUPPORT|
✅EUR_NZD is trading in an uptrend
Along the rising support line
Which makes me bullish biased
And the pair is about to retest the rising support
Thus, a rebound and a move up is expected
With the target of retesting the level above at 1.9544
LONG🚀
✅Like and subscribe to never miss a new idea!✅
Disclosure: I am part of Trade Nation's Influencer program and receive a monthly fee for using their TradingView charts in my analysis.
USD-JPY Will Keep Growing! Buy!
Hello,Traders!
USD-JPY is trading in an
Uptrend along the rising
Support line and the pair
Already made a bullish
Rebound and is consolidating
In a local range so as we
Are bullish biased we will
Be expecting a further
Bullish move up
Buy!
Comment and subscribe to help us grow!
Check out other forecasts below too!
Disclosure: I am part of Trade Nation's Influencer program and receive a monthly fee for using their TradingView charts in my analysis.
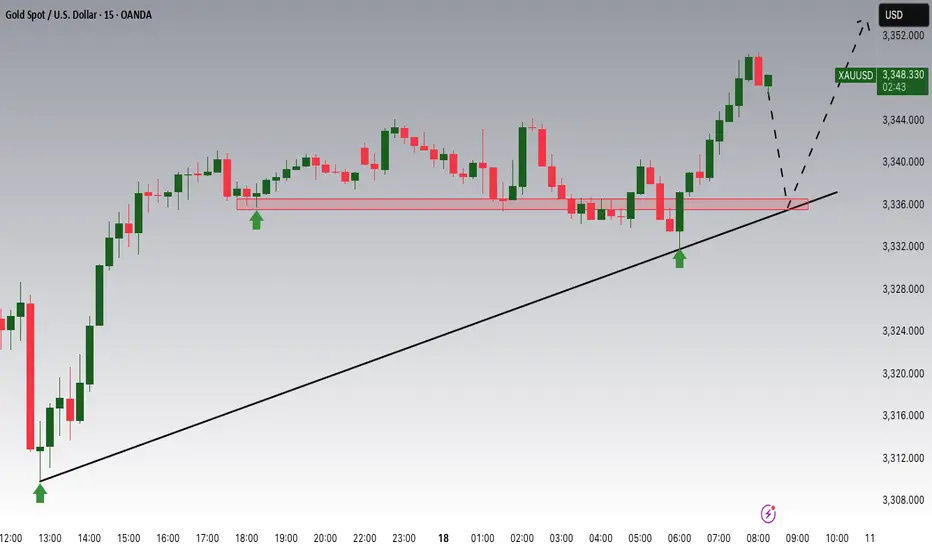
Gold Potential UpsidesHey Traders, in today's trading session we are monitoring XAUUSD for a buying opportunity around 3,336 zone, Gold is trading in an uptrend and currently is in a correction phase in which it is approaching the trend at 3,336 support and resistance area.
Trade safe, Joe.
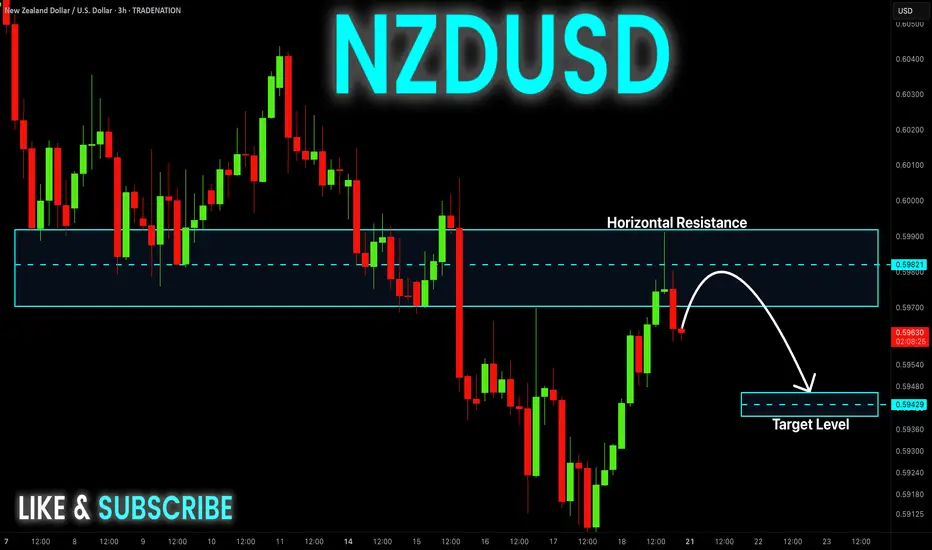
NZD-USD Will Go Down! Sell!
Hello,Traders!
NZD-USD already made a retest
Of the horizontal resistance
Of 0.5992 from where we
Are seeing a bearish reaction
And we will be expecting a
Further bearish move down
Sell!
Comment and subscribe to help us grow!
Check out other forecasts below too!
Disclosure: I am part of Trade Nation's Influencer program and receive a monthly fee for using their TradingView charts in my analysis.