The Critical Blue Line – Will Bitcoin Soar or Sink
🔹 Bitcoin Technical Analysis – Key Blue Line, Bear Trap Possibility & Long-Term Scenario
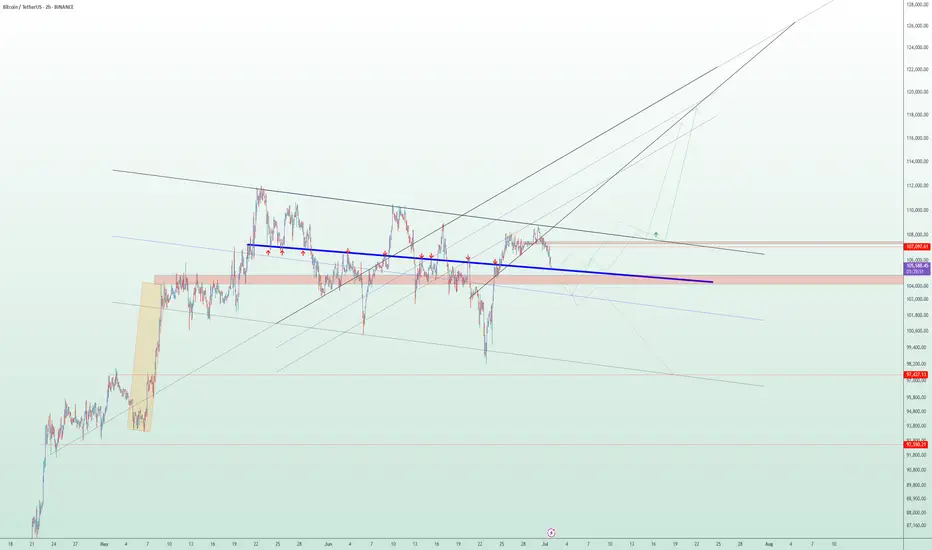
On the Bitcoin chart, the blue horizontal level has acted multiple times as both support and resistance. The price has broken it several times but failed to sustain above, indicating high-volume decision-making zones by institutions and large players.
📉 Why this pattern keeps repeating:
Strong supply and demand concentration at this level.
Inability to break and hold shows market indecision.
Repeated fakeouts are likely used to shake out weak hands.
🔍 Important hidden scenario: Bear Trap Potential
If the price dips below the blue line but quickly reclaims it, it may form a bear trap, tricking short sellers into entering prematurely. This move could ignite strong bullish momentum from trapped sellers and renewed buyers.
🔮 If price holds above the blue line:
Signals market strength and potential bullish structure shift.
Targets:
109,800
117,200
120,000+ (Long-term)
📛 If support fails again:
Retracement toward the lower channel near 101,000 or lower is possible.
📊 Conclusion:
This zone is one of the most critical decision points in the current market. Traders should combine volume, candlestick behavior, and confirmation signals to avoid getting trapped by fake breaks
Signals
Wings of Opportunity: LINK’s Harmonic Setup Unfolding🦋 Title: A Butterfly on the Edge – But Only with Confirmation
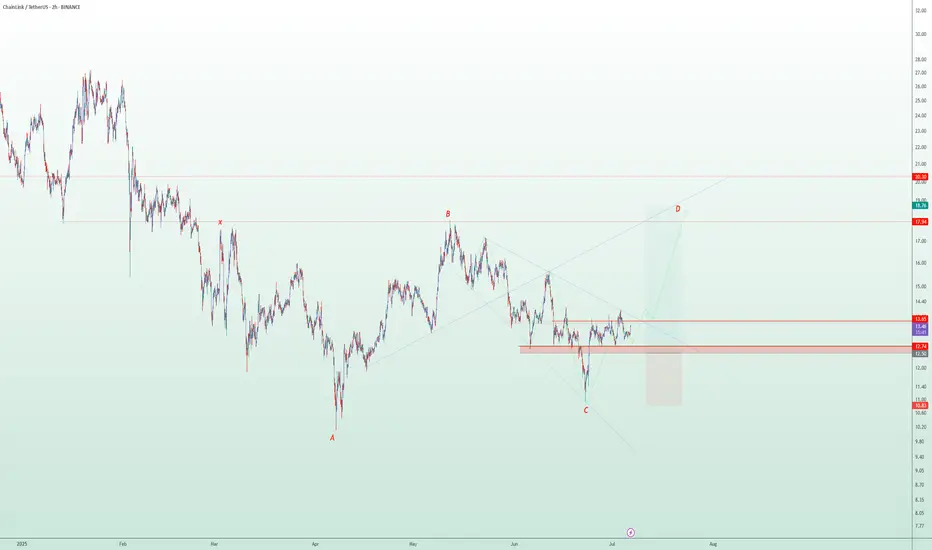
On the 2H timeframe, a Bullish Butterfly Harmonic Pattern is unfolding. The wave structure (X → A → B → C → D) aligns closely with harmonic principles, and point D lies above X, within the 1.27 to 1.618 Fibonacci extension of XA — reinforcing the pattern’s validity.
📌 No entry has been triggered yet.
We are currently waiting for price to break and hold above the key resistance at 13.60 to confirm the bullish scenario.
🔹 Bullish Scenario (our primary and preferred outlook):
Given the strong reaction around the 12.74 demand zone and the harmonic structure completion, we are primarily focused on a long opportunity, if and only if confirmation is achieved above 13.60.
📥 Entry Zone: 13.05 – 13.65
🎯 Target 1: 17.94
🎯 Target 2: 18.76
🛑 Stop-Loss: Below 12.74 (structural invalidation)
🔻 Alternative Bearish Scenario:
If price fails to break 13.60 and instead loses the 12.74 support, the bullish setup becomes invalid, and the market could enter a deeper correction phase.
Potential downside targets in that case:
📉 11.80
📉 10.90 – 10.30 (if bearish momentum continues)
📊 Risk Management Notes:
Position sizing should not exceed 1% of total capital
Avoid early entries before confirmation
Prefer partial entries after breakout and retest
Stick to the invalidation level strictly
📈 While both scenarios are on the table, we are currently favoring the bullish setup, as long as price action supports it. Discipline and patience are key — confirmation first, trade second.
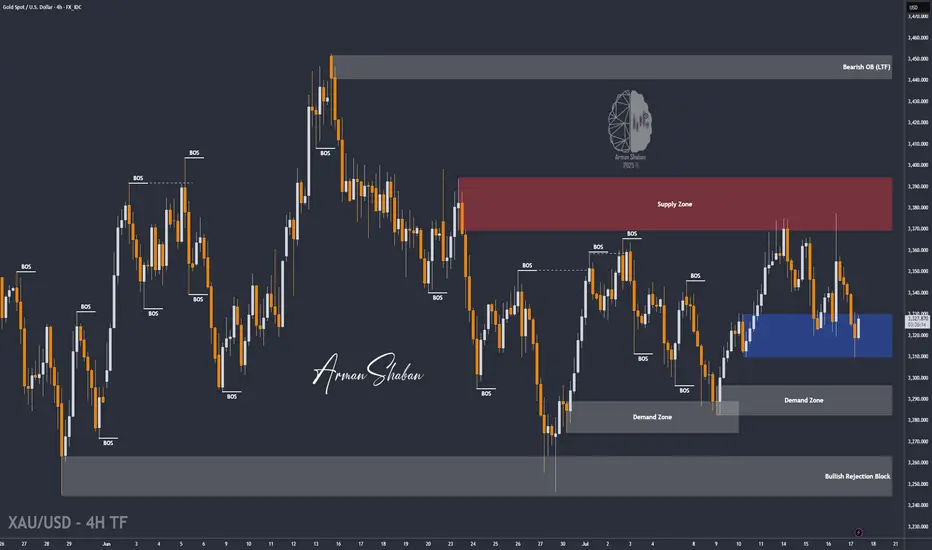
XAU/USD | First LONG to $3345, Then a Potential DROP Below $3300By analyzing the gold chart on the 4-hour timeframe, we can see that last night the price first tapped into the $3340 level, showing an initial push up to $3352. However, the drop intensified soon after, breaking the $3340 resistance and, according to the second scenario, falling to $3310. Upon reaching this key demand level, buying pressure kicked in, pushing the price back up to $3325. Now, the key question is whether gold can hold the $3310 support. If this level holds, we can expect a rise toward $3331 as the first target and $3345 as the second. After this move, a rejection from the $3345 area could trigger another drop, possibly pushing gold below $3300. So, first LONG, then SHORT!
THE LATEST VIDEO ANALYSIS :
Please support me with your likes and comments to motivate me to share more analysis with you and share your opinion about the possible trend of this chart with me !
Best Regards , Arman Shaban
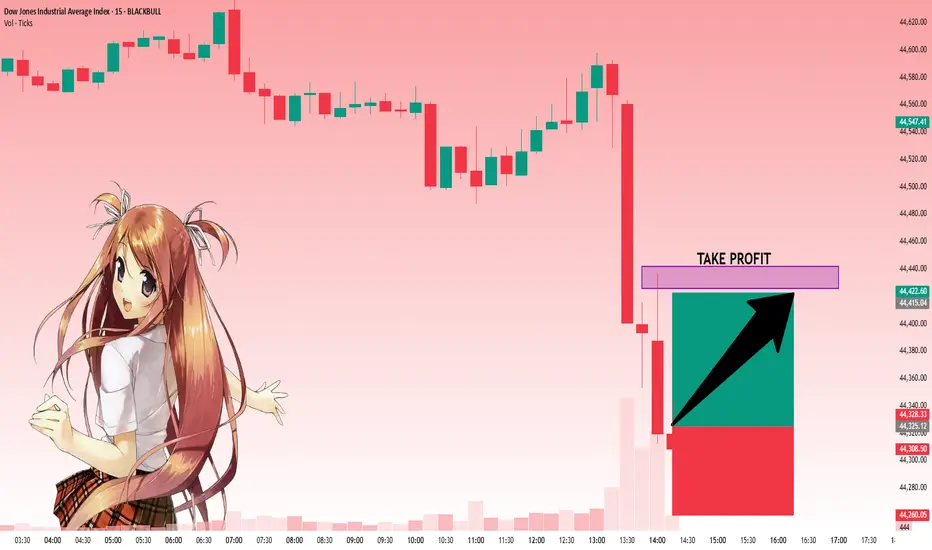
US30: Move Up Expected! Long!
My dear friends,
Today we will analyse US30 together☺️
The price is near a wide key level
and the pair is approaching a significant decision level of 44,325.14 Therefore, a strong bullish reaction here could determine the next move up.We will watch for a confirmation candle, and then target the next key level of 44,425.56.Recommend Stop-loss is beyond the current level.
❤️Sending you lots of Love and Hugs❤️
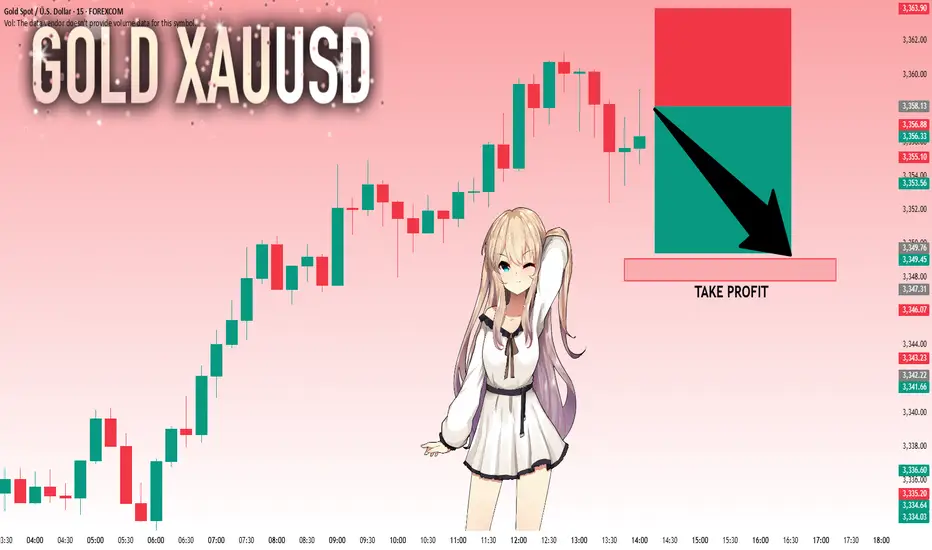
GOLD: Local Bearish Bias! Short!
My dear friends,
Today we will analyse GOLD together☺️
The recent price action suggests a shift in mid-term momentum. A break below the current local range around 3,358.13 will confirm the new direction downwards with the target being the next key level of 3,349.76.and a reconvened placement of a stop-loss beyond the range.
❤️Sending you lots of Love and Hugs❤️
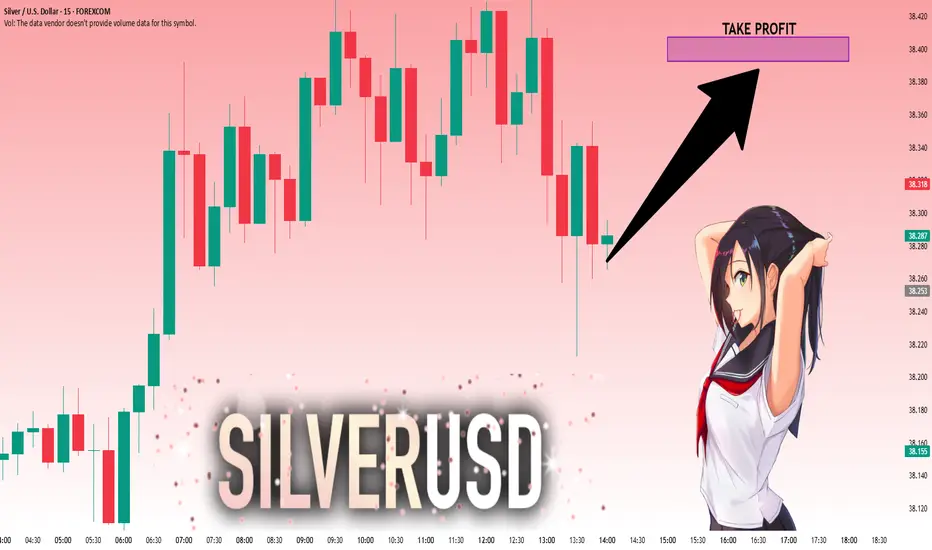
SILVER: Strong Bullish Sentiment! Long!
My dear friends,
Today we will analyse SILVER together☺️
The in-trend continuation seems likely as the current long-term trend appears to be strong, and price is holding above a key level of 38.281 So a bullish continuation seems plausible, targeting the next high. We should enter on confirmation, and place a stop-loss beyond the recent swing level.
❤️Sending you lots of Love and Hugs❤️
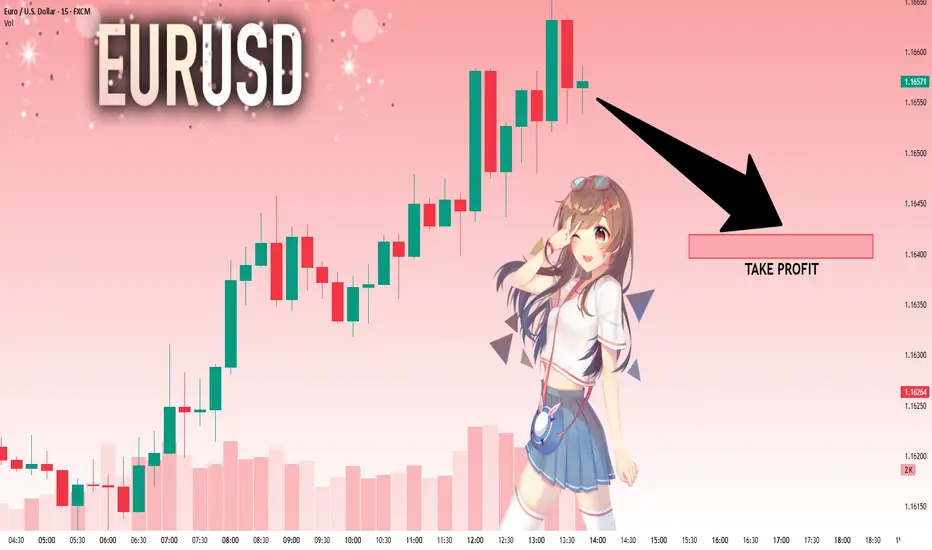
EURUSD: Bears Are Winning! Short!
My dear friends,
Today we will analyse EURUSD together☺️
The market is at an inflection zone and price has now reached an area around 1.16557 where previous reversals or breakouts have occurred.And a price reaction that we are seeing on multiple timeframes here could signal the next move down so we can enter on confirmation, and target the next key level of 1.16419..Stop-loss is recommended beyond the inflection zone.
❤️Sending you lots of Love and Hugs❤️
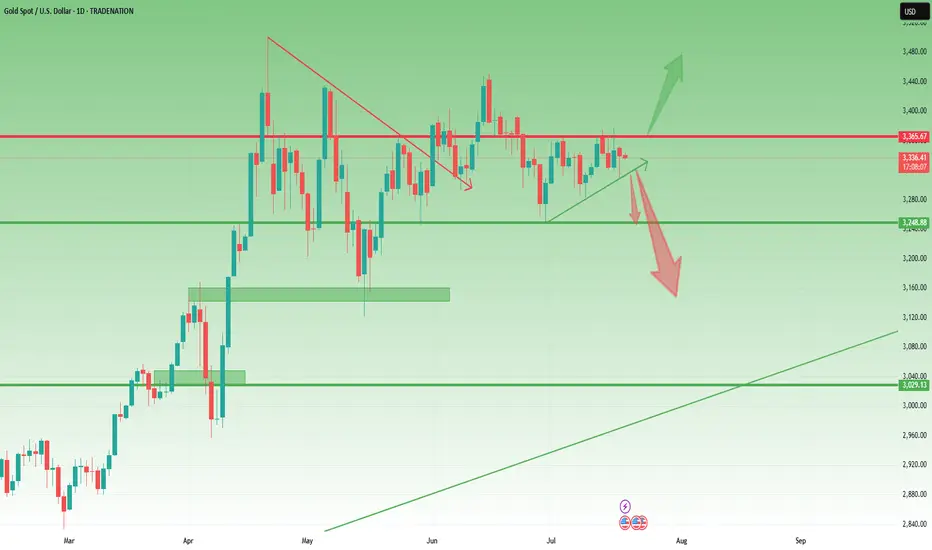
Gold- Still needs to resolve the range🔸 Still Rangebound, But Not for Long
In yesterday’s analysis, I mentioned that two scenarios are in play for Gold:
1. Bullish above 3375
2. Bearish under 3320
Throughout the session, price action leaned toward the bearish side, and I aligned with that by opening a short position. It ended with a minor loss — just 50 pips, which is negligible considering I'm looking for a potential 1,000 pip move in the bigger picture.
________________________________________
🔍 What's Next?
As the title says, Gold still needs to resolve the current range before a clear directional move unfolds.
The same key levels discussed yesterday remain valid and relevant.
And since it’s Friday, today’s daily and weekly candle close will be critical in shaping expectations for next week.
________________________________________
📈 Bullish Case: Close Above 3360
• A daily/weekly close around 3360 would bring strong pressure on the 3375 resistance.
• That could lead to a bullish breakout from the ascending triangle pattern.
• It would also leave behind a bullish weekly pin bar (last week was a bullish pin bar too).
• This scenario would bring 3450 into focus — with 3500 and even a new ATH on the table in the coming weeks.
________________________________________
📉 Bearish Case: Close Near 3300
• A close near 3300 would signal a failed rally attempt
• That would expose 3250 support short term, and 3150 medium term.
________________________________________
🧭 Final Thoughts
At the moment, I’m flat and waiting for clearer confirmation later in the day.
The next move big will be defined by the weekly close — it’s as simple as that.
P.S.: It’s just a hunch , but I’m still leaning toward a break under 3300 as the next major move.
Disclosure: I am part of TradeNation's Influencer program and receive a monthly fee for using their TradingView charts in my analyses and educational articles.
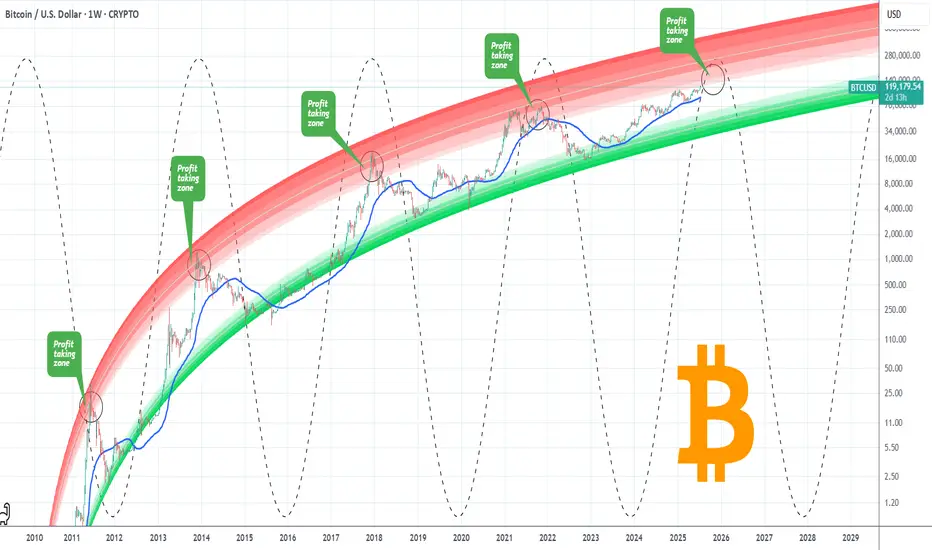
BITCOIN Entering Cyclical Profit Zone. Risk should be limited.Bitcoin (BTCUSD) has just entered the first level of the Logarithmic Growth Curve (LGC) Resistance Zone, which is the light pink band. The Top of the previous Cycle was priced at the top of the band just above this.
In fact every BTC Cycle had this as the 'Profit taking Zone'. The market marginally touched that also within December 2024 - January 2025 but got rejected, almost in similar fashion as January 2021, which was a Double Top approach of the peak formation during the previous Cycle.
This Cycle Top is expected to be within October - November 2025, so we call this the 'Profit Taking Zone' for a reason. Risk exposure from now on should be getting more and more limited. Peak range (depending of the nature of aggression of potential Rate Cuts in September) could be anywhere within $140 - 200k.
Do you think this is the time to start limiting BTC exposure, perhaps moving some of the huge profits to alts? Feel free to let us know in the comments section below!
-------------------------------------------------------------------------------
** Please LIKE 👍, FOLLOW ✅, SHARE 🙌 and COMMENT ✍ if you enjoy this idea! Also share your ideas and charts in the comments section below! This is best way to keep it relevant, support us, keep the content here free and allow the idea to reach as many people as possible. **
-------------------------------------------------------------------------------
💸💸💸💸💸💸
👇 👇 👇 👇 👇 👇
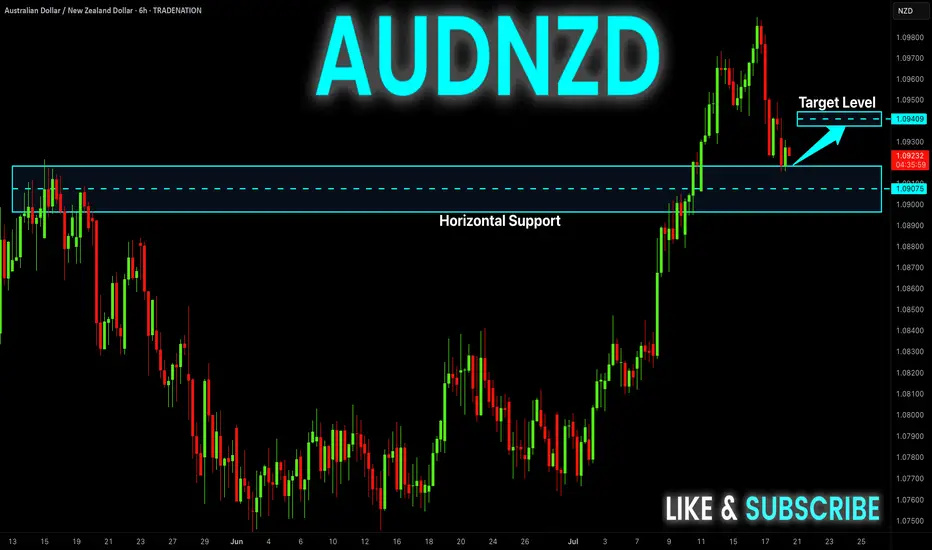
AUD-NZD Rebound Expected! Buy!
Hello,Traders!
AUD-NZD is making a retest
Of the horizontal support
Level of 1.0909 and as the
Pair is trading in an uptrend
We will be expecting a
Local bullish rebound
Buy!
Comment and subscribe to help us grow!
Check out other forecasts below too!
Disclosure: I am part of Trade Nation's Influencer program and receive a monthly fee for using their TradingView charts in my analysis.
XAUUSD Analysis todayHello traders, this is a complete multiple timeframe analysis of this pair. We see could find significant trading opportunities as per analysis upon price action confirmation we may take this trade. Smash the like button if you find value in this analysis and drop a comment if you have any questions or let me know which pair to cover in my next analysis.

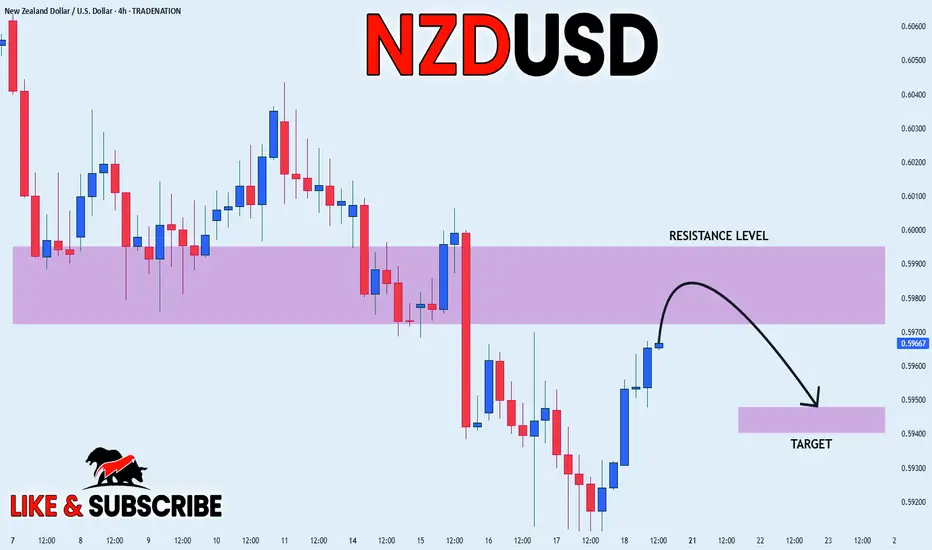
NZD_USD POTENTIAL SHORT|
✅NZD_USD is going up to retest
A horizontal resistance of 0.5990
Which makes me locally bearish biased
And I think that we will see a pullback
And a move down from the level
Towards the target below at 0.5947
SHORT🔥
✅Like and subscribe to never miss a new idea!✅
Disclosure: I am part of Trade Nation's Influencer program and receive a monthly fee for using their TradingView charts in my analysis.
XAUUSDDear traders,
In my previous analysis, I mentioned that gold could extend its short-term decline after being rejected from the range boundary. However, that bearish structure was quickly invalidated following a sharp upside move, signaling a potential trend reversal. If this momentum continues, I anticipate that price may soon reach the levels of 3,355 and 3,365.
Feel free to leave a comment if you have any thoughts to add. Good luck!

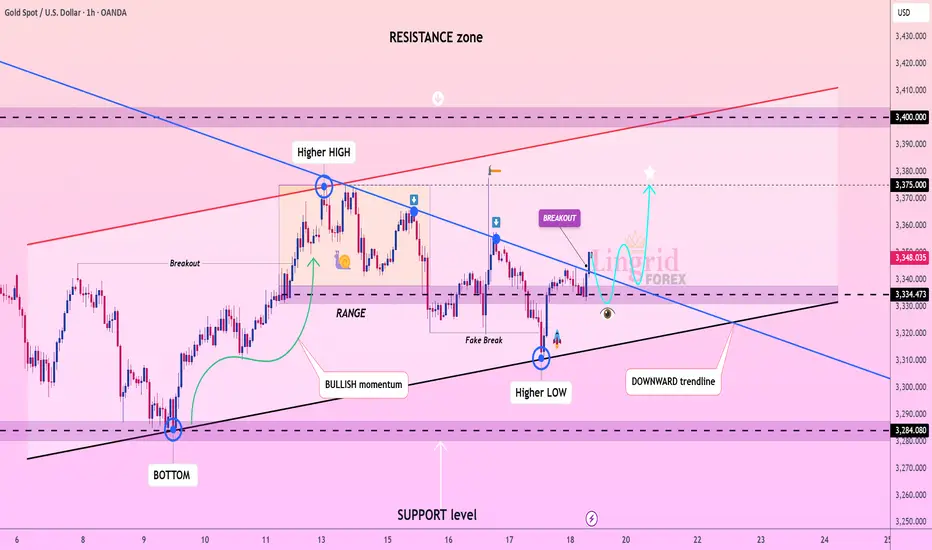
Lingrid | GOLD Broke Corrective Dynamic Resistance OANDA:XAUUSD rebounded off the key support near 3334, forming a higher low and breaking above the descending trendline. This breakout confirms bullish intent, supported by prior accumulation in the range and fake breakdown traps. Price is now retesting the breakout zone and is expected to launch toward 3375 and possibly higher. The structure favors a bullish continuation pattern supported by confluence of trendlines and rising momentum.
📉 Key Levels
Buy trigger: Break and hold above 3350
Buy zone: 3335–3345
Target: 3375 short-term, with potential to 3400
Invalidation: Drop below 3320 support line
💡 Risks
Another fake breakout followed by strong rejection
Resistance at 3375 acting as a supply wall
Low volume on breakout can cause reversal
If this idea resonates with you or you have your own opinion, traders, hit the comments. I’m excited to read your thoughts!
Good moment for try to Buy SXP.Good moment for try to buy SXP. We are creating new up trend channel and now brake up it. The stop below previous local low. The target ~50% of move. Will see...

Gold prices fall in the short term – What's next?Hello everyone, what’s your take on gold?
Today, gold continues to attract short-term selling pressure as USD buying momentum returns and expectations for Fed rate cuts diminish. On the other hand, an overall positive risk sentiment is also seen as another factor weighing on the precious metal.
At the time of writing, gold is trading around the EMA 34 and 89 near 3,336 USD. With no major updates expected, the market is likely to remain steady throughout the day.
From a technical perspective, the bearish trend persists, with prices capped below the trendline. A series of lower highs and lower lows could push XAUUSD to retest deeper levels, potentially reaching the 3,300 USD mark. However, lingering trade uncertainties may limit losses for this safe-haven asset.
This is just my view on the market, not financial advice.

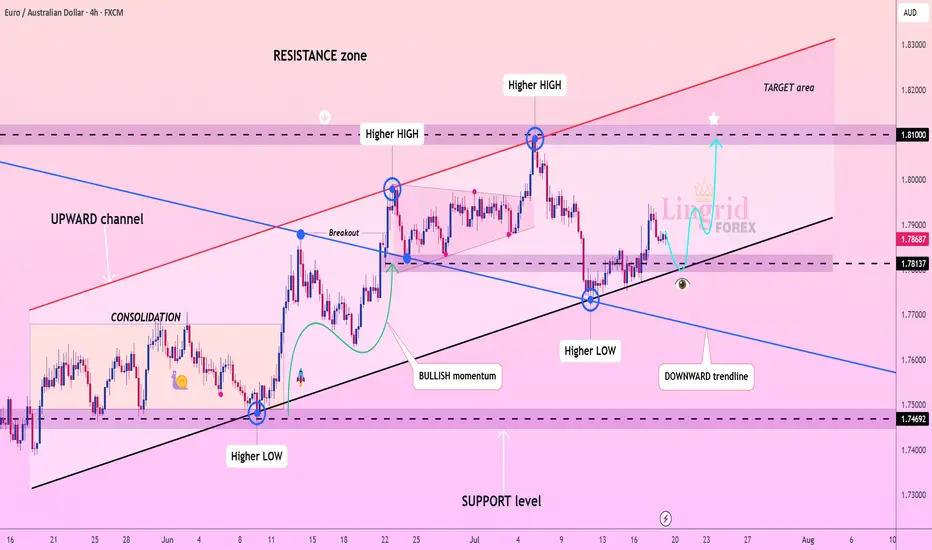
Lingrid | EURAUD Potential Retest of the Key LevelFX:EURAUD is holding firmly above the rising trendline after a successful retest of the support zone at 1.7813. The price has formed consecutive higher lows and remains within a well-defined upward channel, indicating continued bullish structure. A small corrective pullback is expected before a renewed rally toward the 1.8100 resistance level. Momentum is building for a potential breakout continuation toward the upper boundary of the channel.
📉 Key Levels
Buy trigger: Bounce from 1.7813 and reclaim of 1.7900
Buy zone: 1.7820–1.7880
Target: 1.8100
Invalidation: Breakdown below 1.7780 and support trendline
💡 Risks
Failure to hold above the current higher low
False breakout followed by bearish rejection from the mid-range
Weak momentum due to macroeconomic uncertainty
If this idea resonates with you or you have your own opinion, traders, hit the comments. I’m excited to read your thoughts!
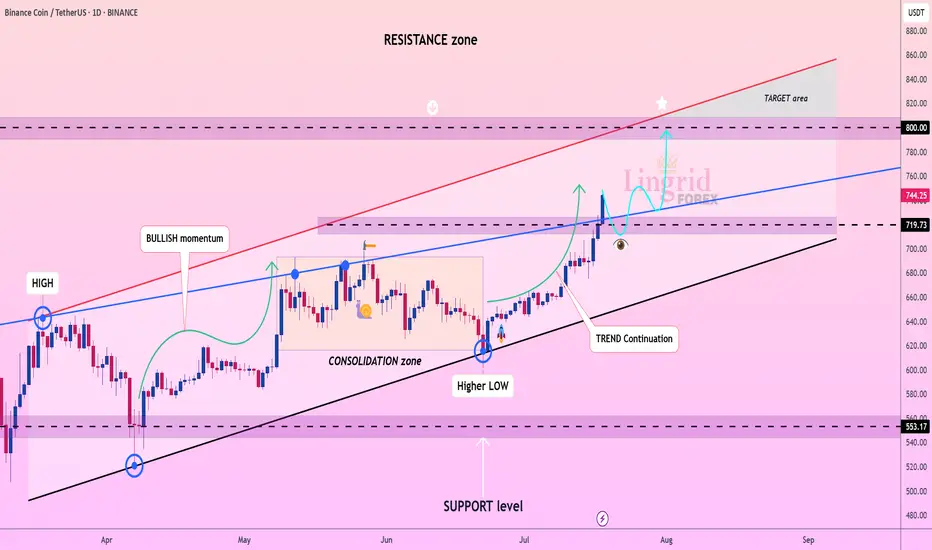
Lingrid | BNBUSDT Bullish MOMENTUM. Long from SUPPORT zoneBINANCE:BNBUSDT is continuing its bullish momentum after bouncing from the support trendline and breaking above the consolidation zone. Price has formed a higher low and followed through with strong impulse candles, pushing past local resistance around 720–740. The breakout confirms trend continuation within the upward channel, with price now aiming toward the 800 psychological level. The next leg higher could accelerate toward the upper resistance zone if support holds near 720.
📉 Key Levels
Buy trigger: Breakout above 740 confirmed
Buy zone: 719–730
Target: 800
Invalidation: Close below 700 support and trendline
💡 Risks
Rejection near horizontal resistance around 760
Bearish divergence on lower timeframes
Macro volatility from regulatory headlines or BTC sharp moves
If this idea resonates with you or you have your own opinion, traders, hit the comments. I’m excited to read your thoughts!
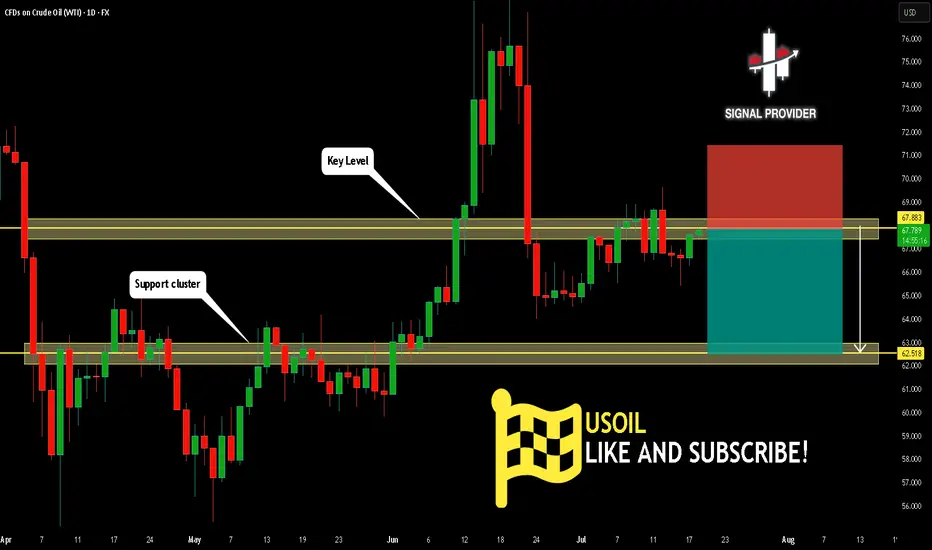
USOIL Will Go Lower! Sell!
Take a look at our analysis for USOIL.
Time Frame: 1D
Current Trend: Bearish
Sentiment: Overbought (based on 7-period RSI)
Forecast: Bearish
The price is testing a key resistance 67.883.
The above-mentioned technicals clearly indicate the dominance of sellers on the market. I recommend shorting the instrument, aiming at 62.518 level.
P.S
Overbought describes a period of time where there has been a significant and consistent upward move in price over a period of time without much pullback.
Disclosure: I am part of Trade Nation's Influencer program and receive a monthly fee for using their TradingView charts in my analysis.
Like and subscribe and comment my ideas if you enjoy them!
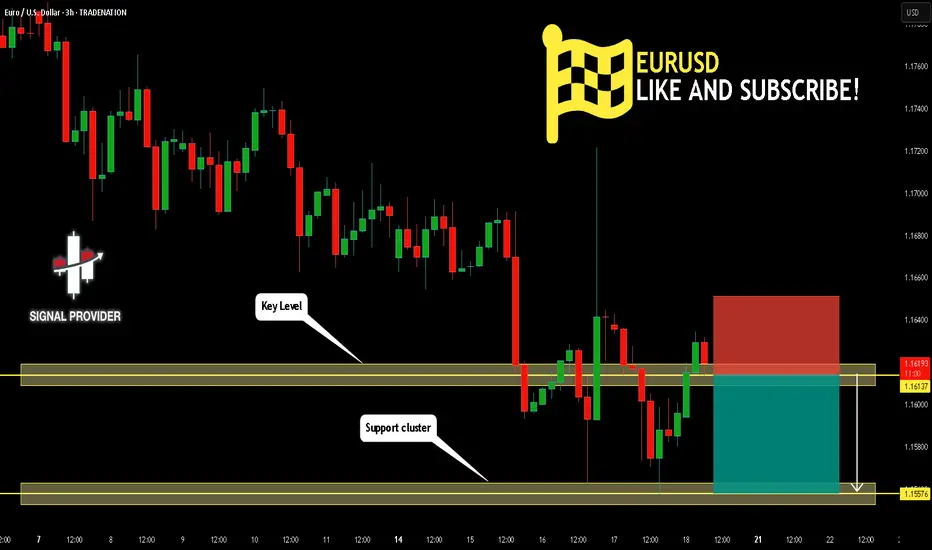
EURUSD Will Go Down! Short!
Please, check our technical outlook for EURUSD.
Time Frame: 3h
Current Trend: Bearish
Sentiment: Overbought (based on 7-period RSI)
Forecast: Bearish
The price is testing a key resistance 1.161.
Taking into consideration the current market trend & overbought RSI, chances will be high to see a bearish movement to the downside at least to 1.155 level.
P.S
Please, note that an oversold/overbought condition can last for a long time, and therefore being oversold/overbought doesn't mean a price rally will come soon, or at all.
Disclosure: I am part of Trade Nation's Influencer program and receive a monthly fee for using their TradingView charts in my analysis.
Like and subscribe and comment my ideas if you enjoy them!
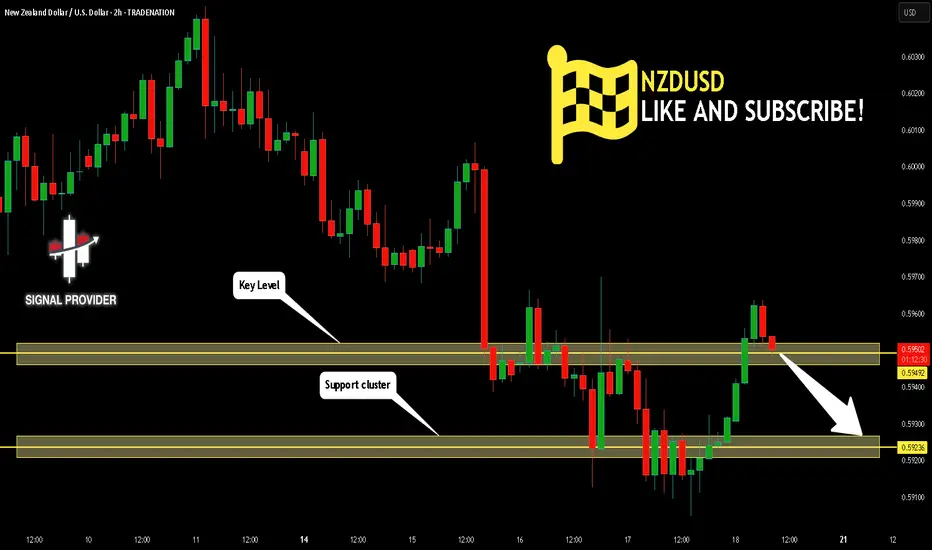
NZDUSD Will Move Lower! Sell!
Here is our detailed technical review for NZDUSD.
Time Frame: 2h
Current Trend: Bearish
Sentiment: Overbought (based on 7-period RSI)
Forecast: Bearish
The market is trading around a solid horizontal structure 0.594.
The above observations make me that the market will inevitably achieve 0.592 level.
P.S
The term oversold refers to a condition where an asset has traded lower in price and has the potential for a price bounce.
Overbought refers to market scenarios where the instrument is traded considerably higher than its fair value. Overvaluation is caused by market sentiments when there is positive news.
Disclosure: I am part of Trade Nation's Influencer program and receive a monthly fee for using their TradingView charts in my analysis.
Like and subscribe and comment my ideas if you enjoy them!
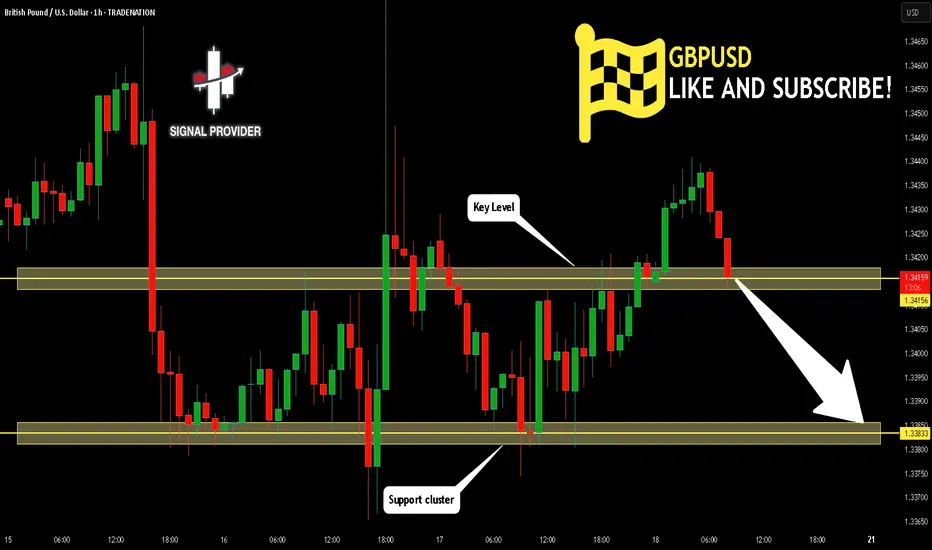
GBPUSD Is Bearish! Short!
Take a look at our analysis for GBPUSD.
Time Frame: 1h
Current Trend: Bearish
Sentiment: Overbought (based on 7-period RSI)
Forecast: Bearish
The market is testing a major horizontal structure 1.341.
Taking into consideration the structure & trend analysis, I believe that the market will reach 1.338 level soon.
P.S
We determine oversold/overbought condition with RSI indicator.
When it drops below 30 - the market is considered to be oversold.
When it bounces above 70 - the market is considered to be overbought.
Disclosure: I am part of Trade Nation's Influencer program and receive a monthly fee for using their TradingView charts in my analysis.
Like and subscribe and comment my ideas if you enjoy them!
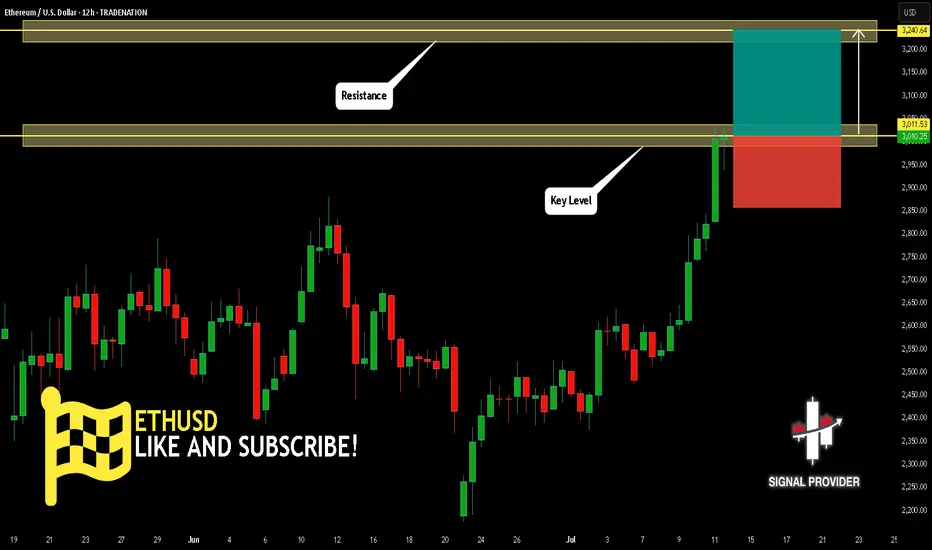
ETHUSD Is Going Up! Buy!
Please, check our technical outlook for ETHUSD.
Time Frame: 12h
Current Trend: Bullish
Sentiment: Oversold (based on 7-period RSI)
Forecast: Bullish
The market is approaching a key horizontal level 3,011.53.
Considering the today's price action, probabilities will be high to see a movement to 3,240.64.
P.S
The term oversold refers to a condition where an asset has traded lower in price and has the potential for a price bounce.
Overbought refers to market scenarios where the instrument is traded considerably higher than its fair value. Overvaluation is caused by market sentiments when there is positive news.
Disclosure: I am part of Trade Nation's Influencer program and receive a monthly fee for using their TradingView charts in my analysis.
Like and subscribe and comment my ideas if you enjoy them!