GOLD tests $3,310 then recovers, continues sidewaysInternational OANDA:XAUUSD fell to the support level of 3,310 USD, then recovered and continued to stabilize sideways due to the stronger US Dollar and market tensions eased after US President Trump said it was "extremely unlikely" to fire Federal Reserve Chairman Powell.
As of the time of writing, spot OANDA:XAUUSD was trading at 3,339 USD/oz.
Reuters reported on Wednesday that Trump is still open to the possibility of firing Powell. However, Trump said on Wednesday that he has no intention of firing Powell at this time, but did not completely rule out the possibility and reiterated his criticism of the Fed chairman for not lowering interest rates.
Data showed US producer prices unexpectedly held steady in June, as the impact of higher import tariffs on goods was offset by weakness in the services sector.
The unchanged US PPI in June showed wholesale prices were stabilising, suggesting the economic impact of tariffs may be smaller than initially feared.
The lower-than-expected core CPI and core PPI data did not provide the boost that was expected, which could mean that the market is focusing on other aspects. More broadly, as the Fed gradually eases policy, real yields could continue to fall, and gold will maintain its upward trend. However, if the market continues to reprice expectations for a hawkish rate cut, this could trigger a short-term correction.
SPDR Gold Trust, the world's largest gold-backed exchange-traded fund (ETF), said its holdings rose 0.33% to 950.79 tonnes on Wednesday from 947.64 tonnes in the previous session.
Technical Outlook Analysis OANDA:XAUUSD
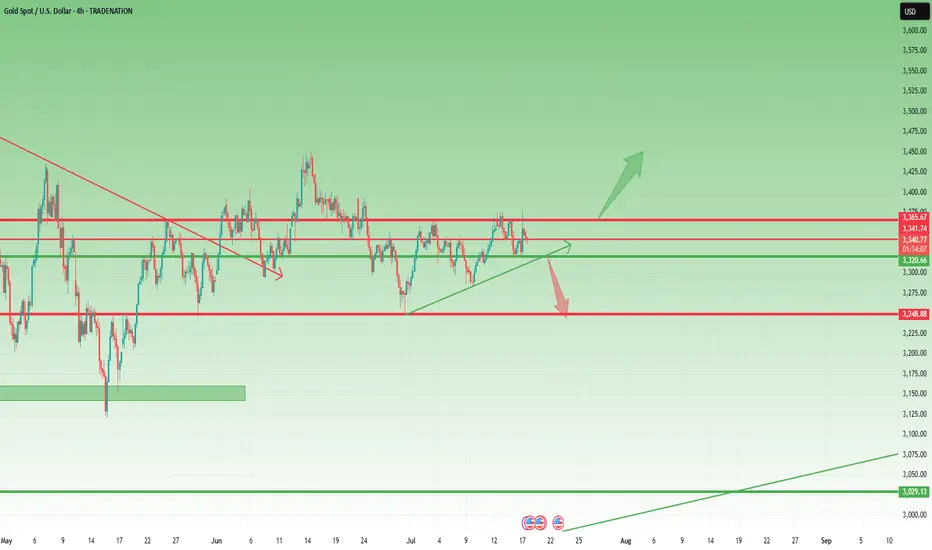
On the daily chart, gold rebounded after falling and tested the support level noted by readers in yesterday's edition at 3,310 USD. The recovery brought gold prices back to work around the EMA21, continuing the sideways accumulation trend.
Structurally there is no change, as for gold to qualify for an upside move it needs to break resistance at the 0.236% Fibonacci retracement level then the short term target is the raw price point of $3,400. Meanwhile for gold to complete its bearish cycle it needs to sell below the 0.382% Fibonacci retracement level then the short term target would be around $3,246, more than the 0.50% Fibonacci retracement level.
The relative strength index (RSI) is also unchanged with the RSI activity around 50, indicating a hesitant market sentiment without leaning towards any particular trend.
Intraday, the technical outlook for gold prices continues to be a sideways accumulation trend, and the notable positions will be listed as follows.
Support: 3,310 – 3,300 – 3,292 USD
Resistance: 3,350 – 3,371 USD
SELL XAUUSD PRICE 3386 - 3384⚡️
↠↠ Stop Loss 3390
→Take Profit 1 3378
↨
→Take Profit 2 3372
BUY XAUUSD PRICE 3276 - 3278⚡️
↠↠ Stop Loss 3272
→Take Profit 1 3284
↨
→Take Profit 2 3290
Signals

TAP -- Breakout Attempt -- Target LevelsHello Traders!
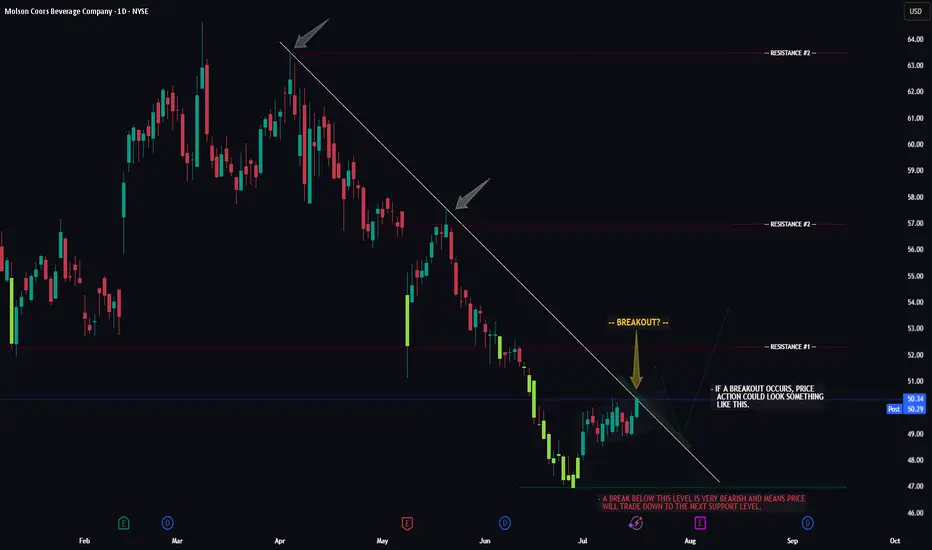
The chart of TAP (Molson Beer co.) is currently flirting with a major resistance trendline. Now whether or not price can successfully seal the deal and make it too third base remains to be seen.
If price does breakout, watch for a potential retrace to the breakout trendline first, then we could see the larger move to resistance level #1.
If price gets rejected and fails to breakout we could see a move below support before it attempts to breakout again.
Thanks everyone and best of luck with your trading journey!
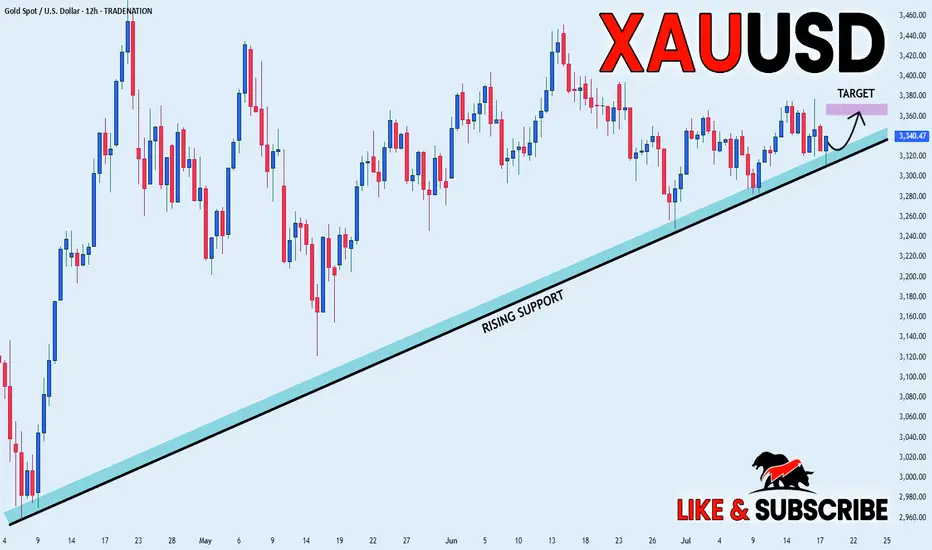
GOLD LONG FROM RISING SUPPORT|
✅GOLD is trading in an uptrend
And the bullish bias is confirmed
By the rebound we are seeing
After the price retested the support
So I think the growth will continue
LONG🚀
✅Like and subscribe to never miss a new idea!✅
Disclosure: I am part of Trade Nation's Influencer program and receive a monthly fee for using their TradingView charts in my analysis.
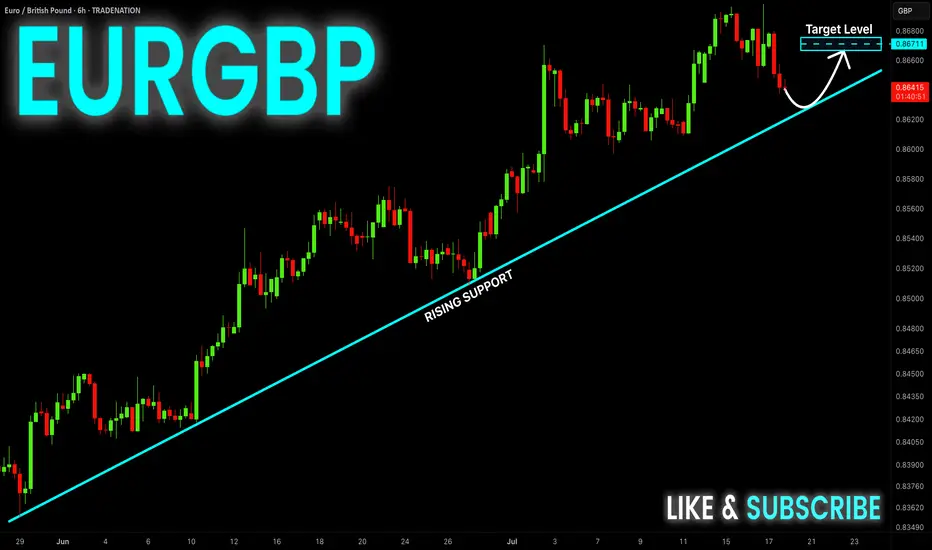
EUR-GBP Long From Rising Support! Buy!
Hello,Traders!
EUR-GBP is trading in an
Uptrend along the rising
Support line and the pair
Is going down now so after
The retest we will be
Expecting a bullish rebound
And a move up
Buy!
Comment and subscribe to help us grow!
Check out other forecasts below too!
Disclosure: I am part of Trade Nation's Influencer program and receive a monthly fee for using their TradingView charts in my analysis.

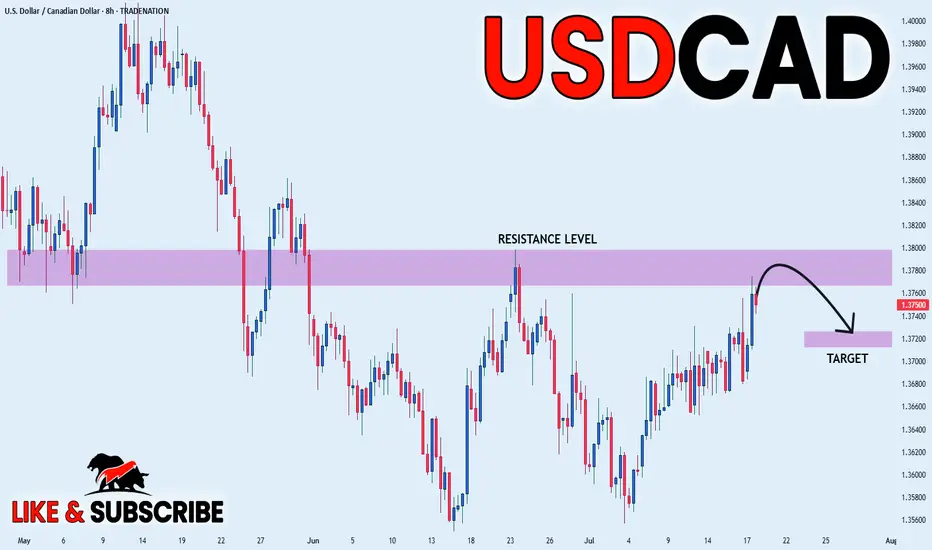
USD_CAD LOCAL SHORT|
✅USD_CAD is going up now
But a strong resistance level is ahead at 1.3800
Thus I am expecting a pullback
And a move down towards the target of 1.3720
SHORT🔥
✅Like and subscribe to never miss a new idea!✅
Disclosure: I am part of Trade Nation's Influencer program and receive a monthly fee for using their TradingView charts in my analysis.
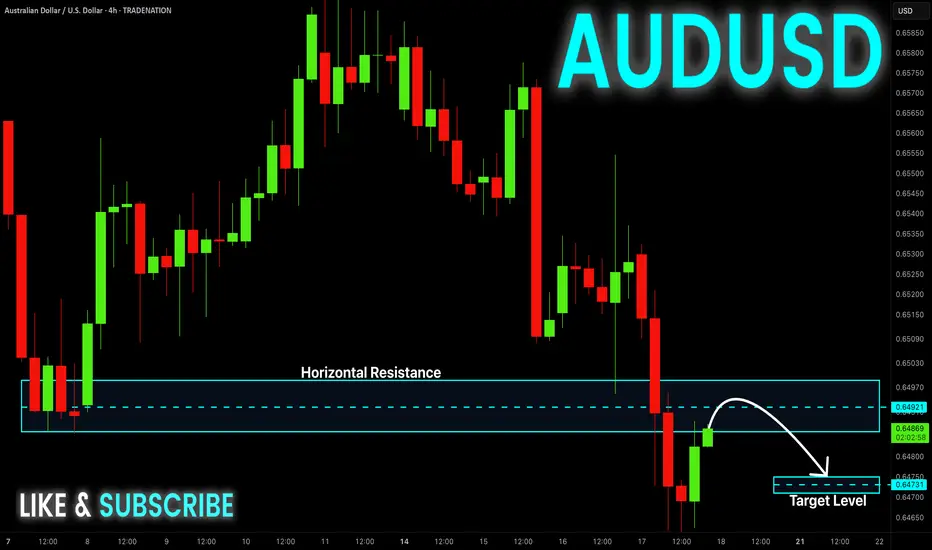
AUD-USD Local Short! Sell!
Hello,Traders!
AUD-JPY is making a bullish
Rebound and the pair is
Making a retest of the key
Horizontal resistance of 0.6497
From where we will be
Expecting a local bearish correction
Sell!
Comment and subscribe to help us grow!
Check out other forecasts below too!
Disclosure: I am part of Trade Nation's Influencer program and receive a monthly fee for using their TradingView charts in my analysis.
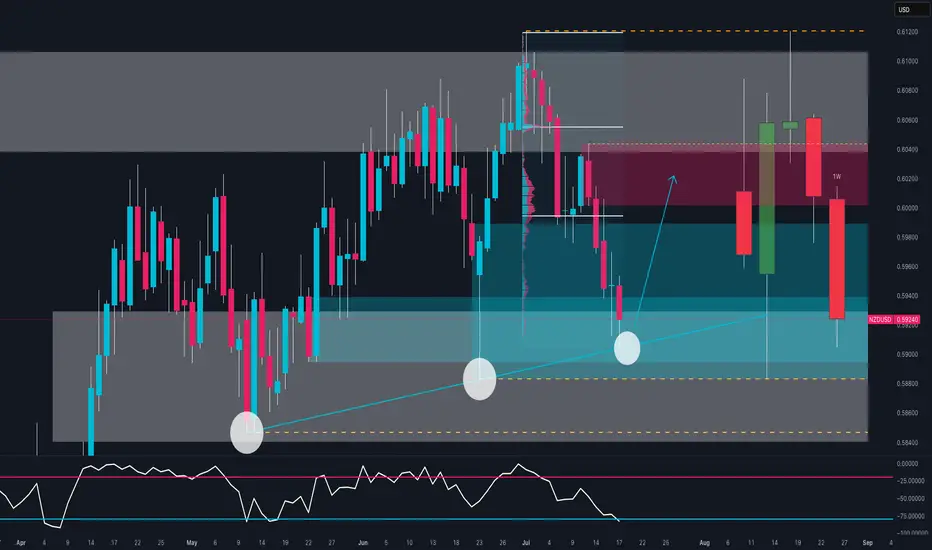
NZD/USD Ready to Explode? The Smart Money Is Making a MoveBias: Bullish Bounce from Key Demand Zone
NZD/USD is testing a strong confluence zone:
Long-term ascending trendline support
Weekly demand area between 0.5890 and 0.5940
Bullish RSI divergence near oversold conditions
The triple rejection wicks signal strong demand around 0.5900, suggesting a possible reversal toward the 0.6020–0.6050 resistance area.
🧠 COT Insight:
NZD: Non-commercial traders added +669 long contracts and reduced shorts by -102 → net bullish shift
USD: Net short exposure increases; total non-commercial shorts now exceed longs by ~4000 contracts
Implication: institutions are rotating into NZD while trimming USD exposure
📊 Sentiment:
86% of retail traders are long NZD/USD → retail sentiment is heavily skewed
This could delay or limit upside as smart money often moves counter to retail positions
📅 Seasonality (July):
July has historically been a bullish month for NZD/USD across all reference windows (20Y, 15Y, 10Y, 5Y, 2Y)
Average July return consistently positive → adds conviction to bullish thesis
🗺 Outlook:
If the zone at 0.5880–0.5920 holds, price may bounce toward 0.6020–0.6050.
Break below would invalidate structure and expose 0.5850 and then 0.5780.
Lingrid | SOLUSDT trend Continuation TradeThe price perfectly fulfilled my previous idea . BINANCE:SOLUSDT found strong support around the 155.7 level after a brief pullback and continues to respect the ascending blue trendline. The previous bullish impulse followed by a healthy consolidation suggests a classic trend continuation structure. If buyers defend the current demand zone and reclaim upward momentum, a move toward the 180 resistance zone is likely. This setup aligns with broader bullish market structure and rising channel dynamics.
📉 Key Levels
Buy trigger: confirmed bounce from 155.7 trendline support
Buy zone: 155.7–158.0 (range floor and trendline confluence)
Target: 180.0
Invalidation: breakdown below 155.0 signals structure shift
💡 Risks
Volatility around trendline retest could trigger stop hunts
Failure to reclaim momentum above 165 may lead to ranging
Sudden market-wide weakness could pressure altcoins broadly
If this idea resonates with you or you have your own opinion, traders, hit the comments. I’m excited to read your thoughts!

Lingrid | GBPUSD buying Opportunity from the Demand ZoneFX:GBPUSD is rebounding from the 1.3390 support level after completing a triangle breakdown and retesting the lower support zone. A potential double-bottom pattern is forming near the key support area, signaling a short-term bullish reversal. If bulls reclaim the descending blue trendline, momentum could drive price back toward the 1.3550 resistance level. This retracement would mark a corrective phase within the larger structure, offering an upside opportunity.
📉 Key Levels
Buy trigger: bullish rejection from 1.3390 with recovery above 1.3440
Buy zone: 1.3390–1.3440 (demand and bounce structure)
Target: 1.3550
Invalidation: 4H candle close below 1.3390 support breaks bullish setup
💡 Risks
Failure to break above trendline could result in further consolidation
Macroeconomic news may override technical rebound
Downtrend pressure remains unless higher lows are confirmed
If this idea resonates with you or you have your own opinion, traders, hit the comments. I’m excited to read your thoughts!

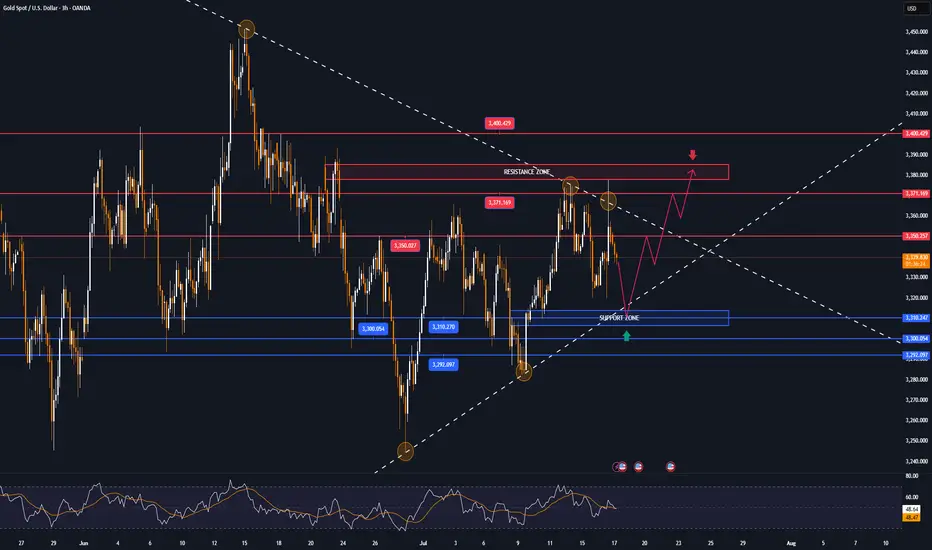
GOLD's narrowing range, tariffs, Trump's political dramaOANDA:XAUUSD is still trading in a narrowing range, affected by the tariff game and the political drama that Trump is building. Currently, the price of gold is trading around 3,339 USD/oz, equivalent to a small decrease of about 7 dollars on the day.
Tariff Game
On July 16, US President Donald Trump announced that he would send letters to more than 150 countries, with tariffs expected to be 10% or 15%, to promote trade. He said these countries are not major US partners and will be treated equally, but left open the possibility of negotiating exemptions. The tariffs are similar to those proposed in April but were postponed due to concerns about market volatility. The resumption of the tariffs continues to destabilize financial markets and surprised partners such as the European Union, as they hoped to reach an early agreement with the US.
Political Play
Also on July 16, global financial markets were shaken by rumors that President Trump intended to fire Federal Reserve Chairman Jerome Powell. Many major news agencies such as the New York Times, Bloomberg and Reuters reported that Trump had prepared a letter of dismissal and consulted with Republican lawmakers, receiving positive feedback. Removing Powell before his term was believed to undermine confidence in the US financial system and the safe haven status of the USD. Trump later denied the plan, saying it was unlikely to happen unless there was serious wrongdoing. Markets reacted strongly: the USD fell and then recovered after Trump's statement, while gold lost most of its previous gains by the end of the session.
The gold market in particular, and the financial economy in general, are being affected by the activities of Trump, the creator of the global trade war, and the plays of Trump and the FED leading the market. Therefore, the basic formula in the current market context is best to follow Trump, and make sure not to miss any of Trump's status lines.
Technical outlook analysis of OANDA:XAUUSD
On the daily chart, the technical structure has not changed with the trend not yet clear and the price action clinging to the EMA21.
The technical conditions do not favor an uptrend or a downtrend, typically the RSI moves around the 50 level, indicating a hesitant market sentiment.
On the upside, gold needs to achieve the condition of breaking above the 0.236% Fibonacci retracement level of the price point of 3,371 USD then the target level will be around 3,400 USD in the short term, more than 3,430 USD.
Meanwhile, on the downside, gold needs to break below the 0.382% Fibonacci retracement, which would confirm a loss of the $3,300 level, then target around $3,246 in the short term, more than the 0.50% Fibonacci retracement.
Intraday, the sideways trend of gold price accumulation will be noticed by the following technical positions.
Support: $3,310 – $3,300 – $3,292
Resistance: $3,350 – $3,371 – $3,400
SELL XAUUSD PRICE 3381 - 3379⚡️
↠↠ Stop Loss 3385
→Take Profit 1 3373
↨
→Take Profit 2 3387
BUY XAUUSD PRICE 3309 - 3311⚡️
↠↠ Stop Loss 3305
→Take Profit 1 3317
↨
→Take Profit 2 3323
GBPAUD: Pullback From Resistance 🇬🇧🇦🇺
I think that GBPAUD may pull back from a key intraday resistance.
As a confirmation, I see a bearish engulfing candle after its test
on an hourly time frame.
Goal - 2.0655
❤️Please, support my work with like, thank you!❤️
I am part of Trade Nation's Influencer program and receive a monthly fee for using their TradingView charts in my analysis.

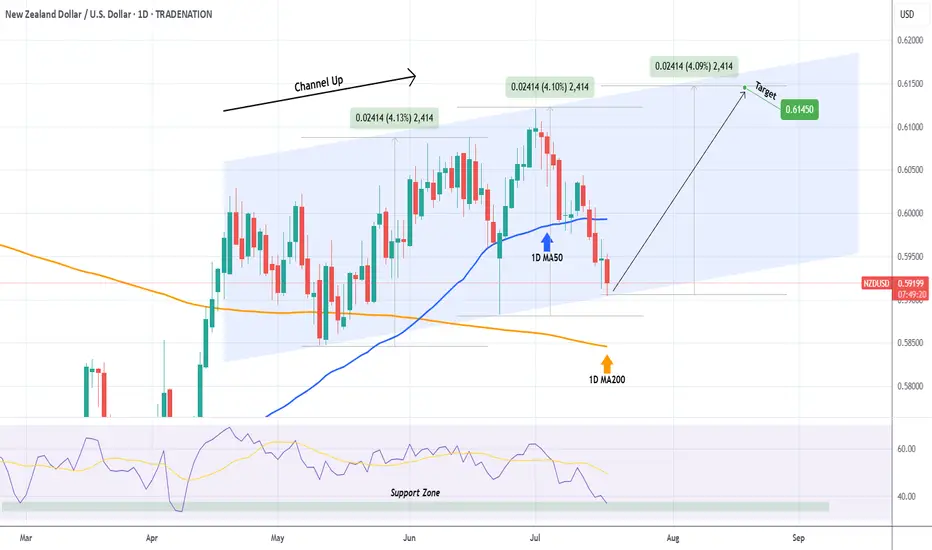
NZDUSD Excellent buy opportunity on the Channel Up bottom.Last time we looked at the NDUSD pair (May 27, see chart below), we gave a buy signal that in a few days hit our 0.60900 Target:
This time the price is trading exactly at the bottom of a 3-month Channel Up, with the 1D RSI entering its Support Zone. The true Support might be a little lower on the 1D MA200 (orange trend-line) and as long as it holds, the trend will remain bullish, but this is the first strong buy signal of the chart.
Our Target is 0.61450, which will be a +4.10% rise, exactly the same as both previous Bullish Legs.
-------------------------------------------------------------------------------
** Please LIKE 👍, FOLLOW ✅, SHARE 🙌 and COMMENT ✍ if you enjoy this idea! Also share your ideas and charts in the comments section below! This is best way to keep it relevant, support us, keep the content here free and allow the idea to reach as many people as possible. **
-------------------------------------------------------------------------------
Disclosure: I am part of Trade Nation's Influencer program and receive a monthly fee for using their TradingView charts in my analysis.
💸💸💸💸💸💸
👇 👇 👇 👇 👇 👇
Waiting for the Break: 3375 or 3320 Will Decide the Next 1k Pips📉 Quick recap:
As you know, I've been bullish on Gold. However, as explained in yesterday’s analysis, I started to approach this view with more caution. Unfortunately, I closed my long position at break even… before the rally to the 3375 resistance. That’s trading.
📌 What now?
Despite missing that move, the market is beginning to offer more clarity. There are now two key levels that will likely define the next major swing:
________________________________________
🔹 1. Resistance at 3375 – Top of the Range / Triangle Breakout Zone
• This level marks the upper boundary of the recent range
• It’s also the resistance of a developing ascending triangle
• A clean breakout above 3375 would confirm the pattern and could trigger a strong upside acceleration
• Target: 3450 zone, with potential for more if momentum kicks in (approx. 1000 pips higher)
➡️ This is the obvious bullish scenario – in line with the broader trend and classical technical setup.
________________________________________
🔻 2. Support at 3320 – The Less Obvious, but Classic Gold
• 3320 is now a confluence support area
• Technically, a break below here is less probable – but Gold has a habit of doing the unexpected
• If 3320 breaks, bears could look for a first leg to 3280 (approx. 400 pips), and very probably 3250 (around 700 pips drop)
➡️ This bearish scenario is not the base case, but it must not be ignored. Sometimes the trap is in the obvious.
________________________________________
🧭 Trading Plan:
For now, I’m out of the market, patiently waiting for confirmation. I’ll trade the breakout – whichever side gives the signal first.
________________________________________
📌 Conclusion:
Gold is coiling for a larger move. The levels are clear: 3375 and 3320 are the doors. One of them will open. Until then, we wait and prepare. 🚀
Disclosure: I am part of TradeNation's Influencer program and receive a monthly fee for using their TradingView charts in my analyses and educational articles.
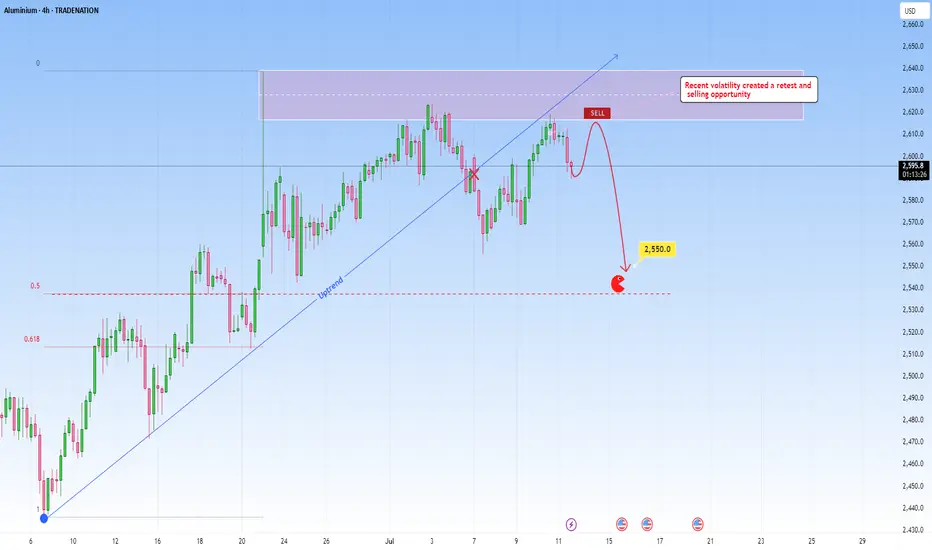
ALUMINIUM: Selling opportunity following trendline breakALUMINIUM climbed a steep uptrend but it might meets its end with this recent break through this rising trendline. When price respects a trendline repeatedly, it becomes significant, its break indicating either a potential reversal or major pause in the trend. The candlestick that broke the trendline signals the first hint of structural change.
After breaking, price traced backward to retest the trendline. The retest manifested as a cluster of candles with wicks testing the former trendline but failing to reclaim it. That failure to reclaim, might signal seller conviction and transformation of market structure. But it would need additional confirmation to confirm the signal.
Ideally, what I look for in retests is to be met with a confirming candle, typically a bearish engulfing or marubozu closing below the trendline. This would confirm the sellers have taken over and validate the change from uptrend to potential downtrend or consolidation phase.
If I were to take a side here, I would choose more downside, but again only price action should determine next move.
However, if price breaks back above the trendline with conviction, especially engulfing the retest, it would invalidate the bearish scenario, suggesting that the uptrend may resume with fresh momentum.
Just sharing my thoughts for the charts, this isn’t financial advice. Always confirm your setups and manage your risk properly.
Disclosure: I am part of Trade Nation's Influencer program and receive a monthly fee for using their TradingView charts in my analysis.
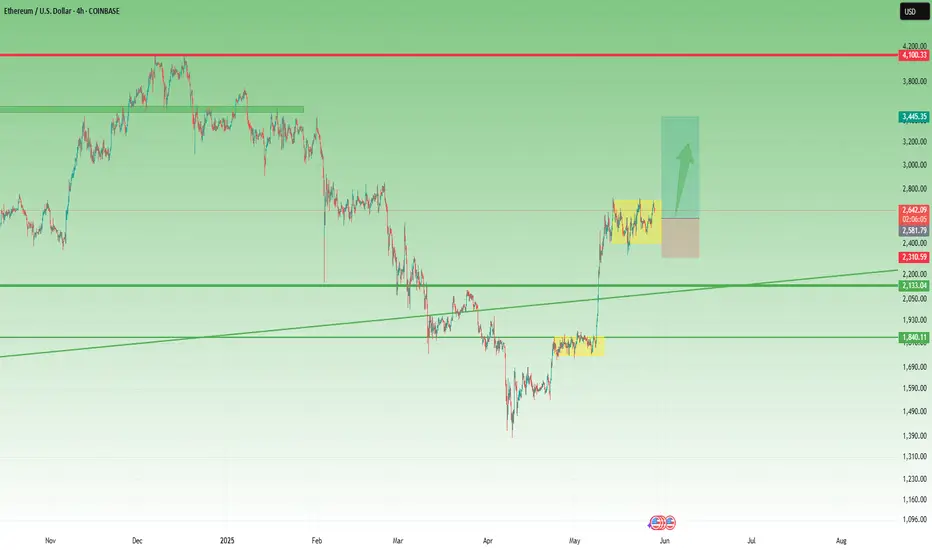
Ethereum – Calm Before the Next Leg Up?Ethereum had a disappointing start in 2025.
After pushing above $4,000 in mid-December 2024 — with headlines full of "$10K ETH coming!" — the new year began around $3,500, and what followed was a slow bleed.
By early April, Ethereum printed a shocking low at $1,380 — a level few believed was even possible.
But the bounce from there? ⚡
It was explosive — nearly +100% in just one month, with price topping around $2,700.
Since then, we’ve been consolidating — and that’s completely normal after such a vertical move.
🔍 So, what’s next?
Technically, ETH is forming a rectangle, a structure that often resolves as a continuation pattern.
The spike down to the $2,300 zone on May 19th was telling — buyers stepped in aggressively and pushed price back above $2,500, which now acts as a comfort zone for bulls.
📌 Conclusion
I’m looking to buy dips, ideally near $2,550, and my target is the $3,500 zone.
No need to reconsider the bullish outlook as long as price holds above $2,300.
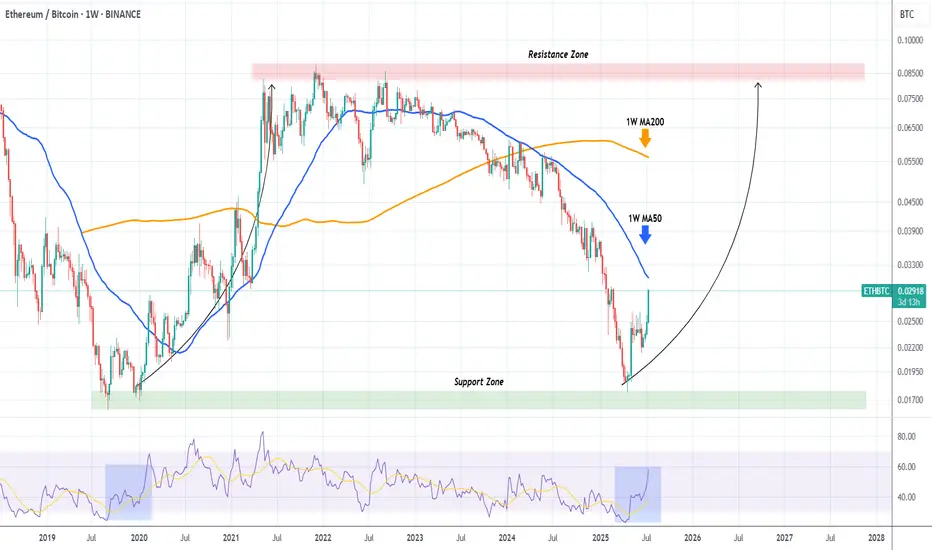
ETHBTC shows that Ethereum will outperform Bitcoin MASSIVELY!The ETHBTC pair has been rebounding hyper aggressively after the April 21 2025 Low on the 6-year Support Zone, and is now facing it's most important test, the 1W MA50 (blue trend-line).
This trend-line has been its Resistance since basically March 13 2023, so if broken, it will be a massive bullish break-out signal.
In fact during the 2020 - 2021 Bullish Leg, once the price broke above the 1W MA50, the market got the final confirmation of the upcoming long-term rally.
We expect Ethereum to outperform Bitcoin for the rest of the year at least.
-------------------------------------------------------------------------------
** Please LIKE 👍, FOLLOW ✅, SHARE 🙌 and COMMENT ✍ if you enjoy this idea! Also share your ideas and charts in the comments section below! This is best way to keep it relevant, support us, keep the content here free and allow the idea to reach as many people as possible. **
-------------------------------------------------------------------------------
💸💸💸💸💸💸
👇 👇 👇 👇 👇 👇
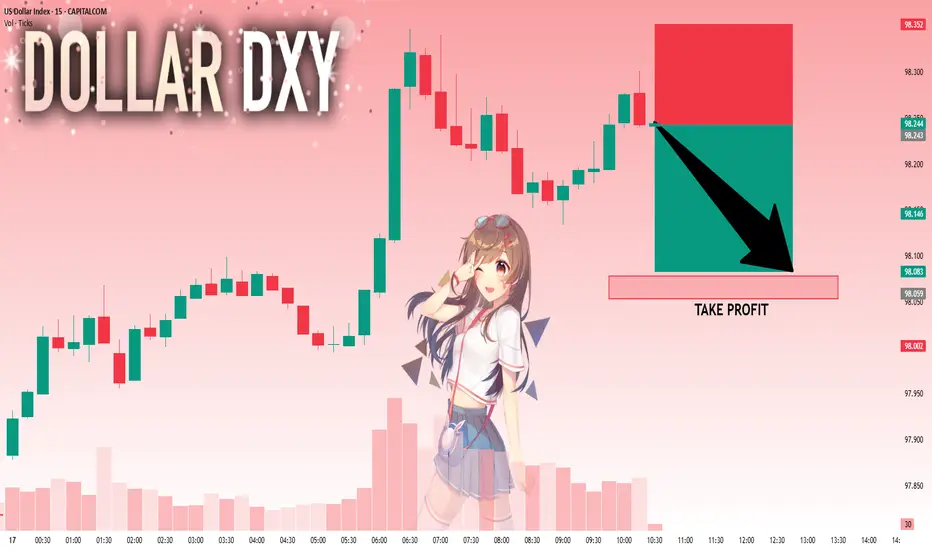
DXY: Next Move Is Down! Short!
My dear friends,
Today we will analyse DXY together☺️
The price is near a wide key level
and the pair is approaching a significant decision level of 98.243 Therefore, a strong bearish reaction here could determine the next move down.We will watch for a confirmation candle, and then target the next key level of 98.078..Recommend Stop-loss is beyond the current level.
❤️Sending you lots of Love and Hugs❤️
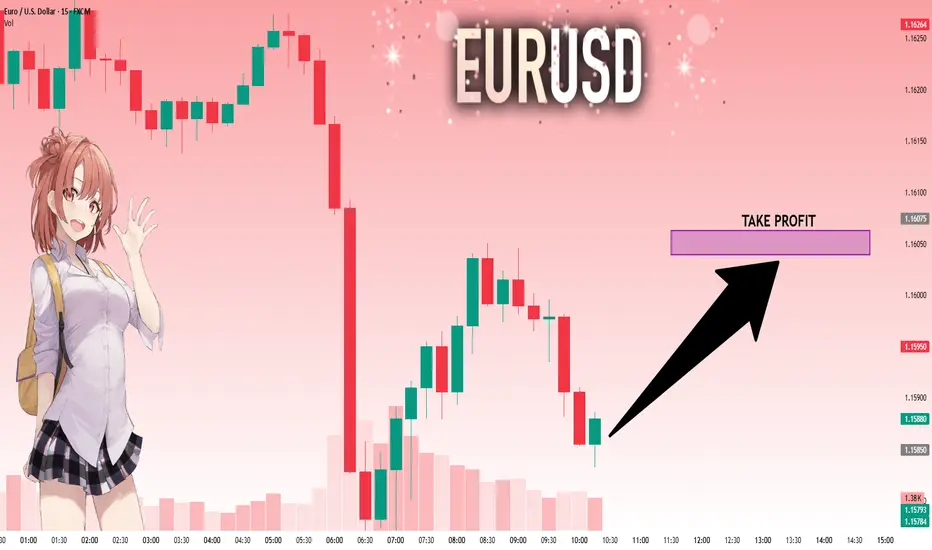
EURUSD: Target Is Up! Long!
My dear friends,
Today we will analyse EURUSD together☺️
The recent price action suggests a shift in mid-term momentum. A break above the current local range around 1.15850 will confirm the new direction upwards with the target being the next key level of 1.16039 and a reconvened placement of a stop-loss beyond the range.
❤️Sending you lots of Love and Hugs❤️
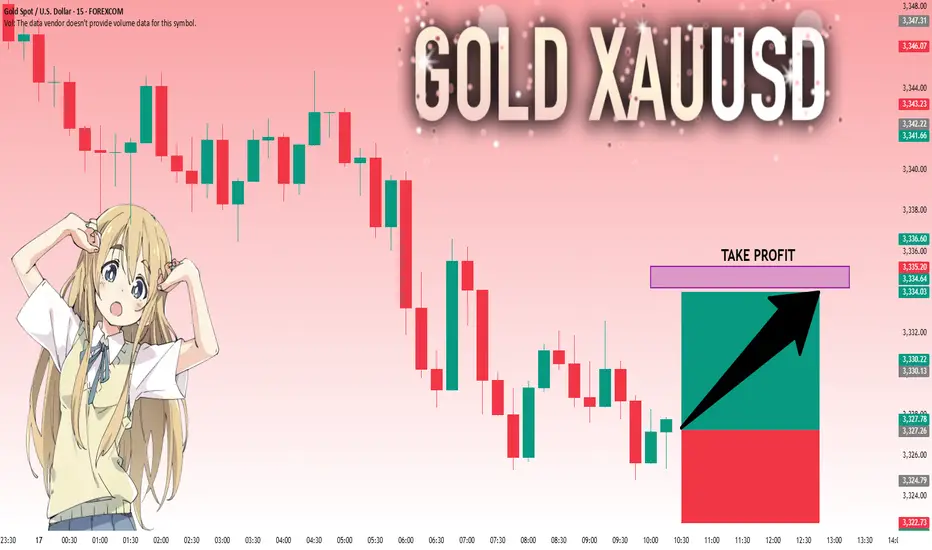
GOLD: Move Up Expected! Long!
My dear friends,
Today we will analyse GOLD together☺️
The in-trend continuation seems likely as the current long-term trend appears to be strong, and price is holding above a key level of 3,327.26 So a bullish continuation seems plausible, targeting the next high. We should enter on confirmation, and place a stop-loss beyond the recent swing level.
❤️Sending you lots of Love and Hugs❤️
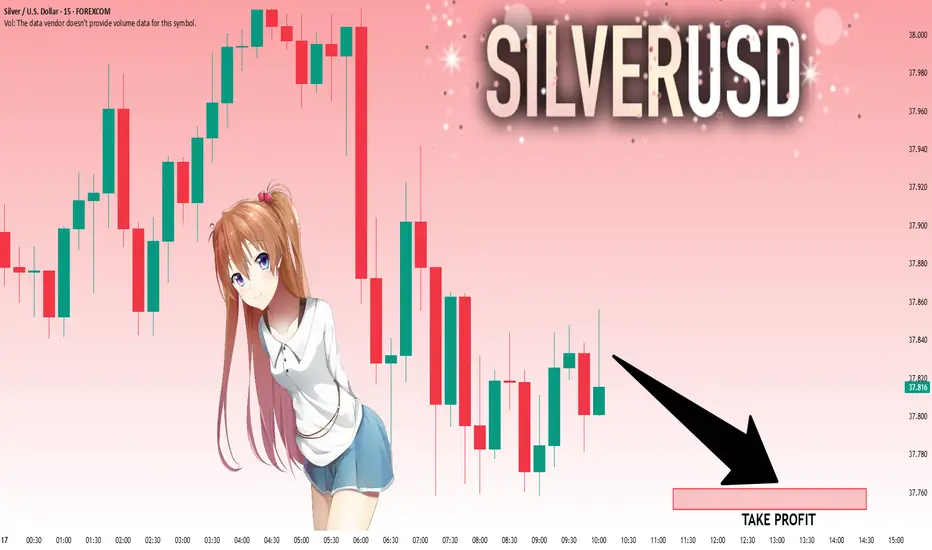
SILVER: Local Bearish Bias! Short!
My dear friends,
Today we will analyse SILVER together☺️
The market is at an inflection zone and price has now reached an area around 37.832 where previous reversals or breakouts have occurred.And a price reaction that we are seeing on multiple timeframes here could signal the next move down so we can enter on confirmation, and target the next key level of 37.762..Stop-loss is recommended beyond the inflection zone.
❤️Sending you lots of Love and Hugs❤️
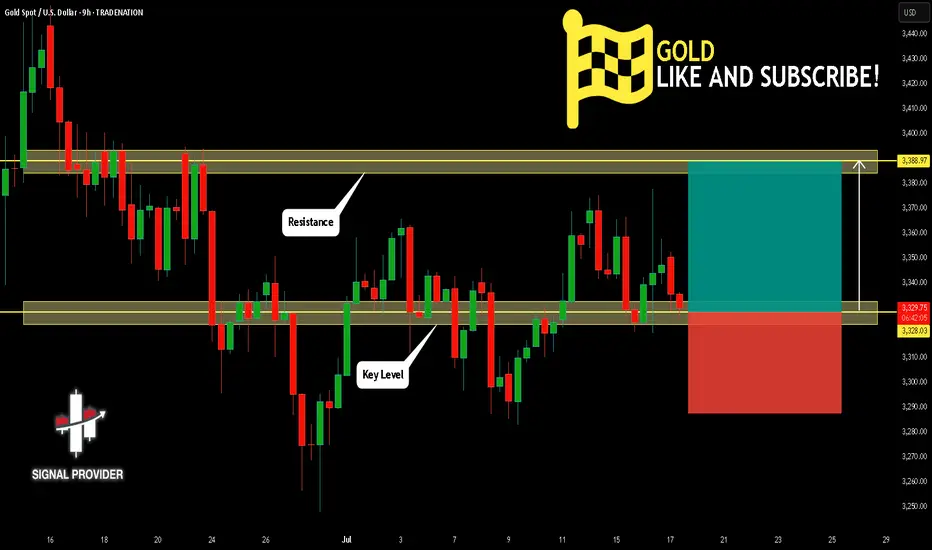
GOLD Is Very Bullish! Buy!
Please, check our technical outlook for GOLD.
Time Frame: 9h
Current Trend: Bullish
Sentiment: Oversold (based on 7-period RSI)
Forecast: Bullish
The market is approaching a key horizontal level 3,328.03.
Considering the today's price action, probabilities will be high to see a movement to 3,388.97.
P.S
Overbought describes a period of time where there has been a significant and consistent upward move in price over a period of time without much pullback.
Disclosure: I am part of Trade Nation's Influencer program and receive a monthly fee for using their TradingView charts in my analysis.
Like and subscribe and comment my ideas if you enjoy them!
EURJPY Is Going Up! Long!
Here is our detailed technical review for EURJPY.
Time Frame: 7h
Current Trend: Bullish
Sentiment: Oversold (based on 7-period RSI)
Forecast: Bullish
The market is approaching a significant support area 172.355.
The underlined horizontal cluster clearly indicates a highly probable bullish movement with target 174.222 level.
P.S
Please, note that an oversold/overbought condition can last for a long time, and therefore being oversold/overbought doesn't mean a price rally will come soon, or at all.
Disclosure: I am part of Trade Nation's Influencer program and receive a monthly fee for using their TradingView charts in my analysis.
Like and subscribe and comment my ideas if you enjoy them!
