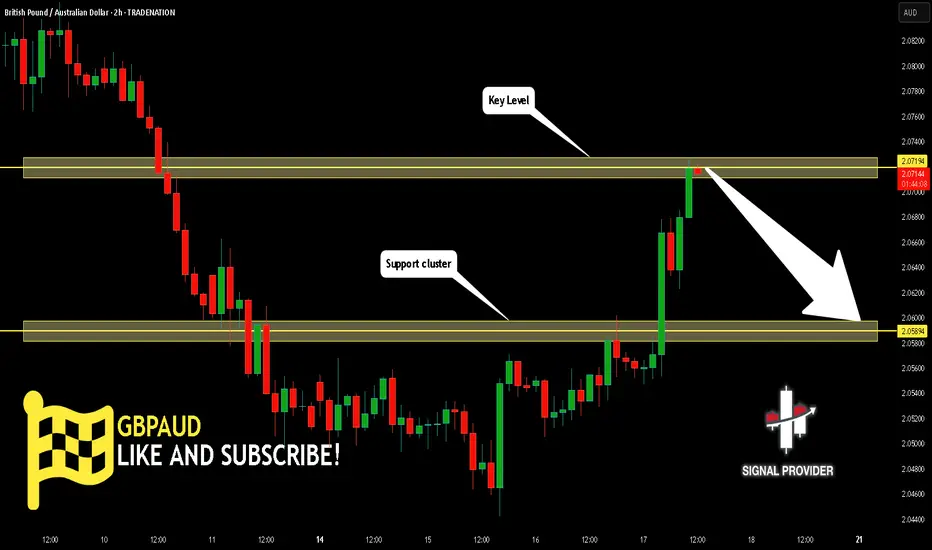
GBPAUD Will Go Lower From Resistance! Sell!
Please, check our technical outlook for GBPAUD.
Time Frame: 2h
Current Trend: Bearish
Sentiment: Overbought (based on 7-period RSI)
Forecast: Bearish
The price is testing a key resistance 2.071.
Taking into consideration the current market trend & overbought RSI, chances will be high to see a bearish movement to the downside at least to 2.058 level.
P.S
We determine oversold/overbought condition with RSI indicator.
When it drops below 30 - the market is considered to be oversold.
When it bounces above 70 - the market is considered to be overbought.
Disclosure: I am part of Trade Nation's Influencer program and receive a monthly fee for using their TradingView charts in my analysis.
Like and subscribe and comment my ideas if you enjoy them!
Signals
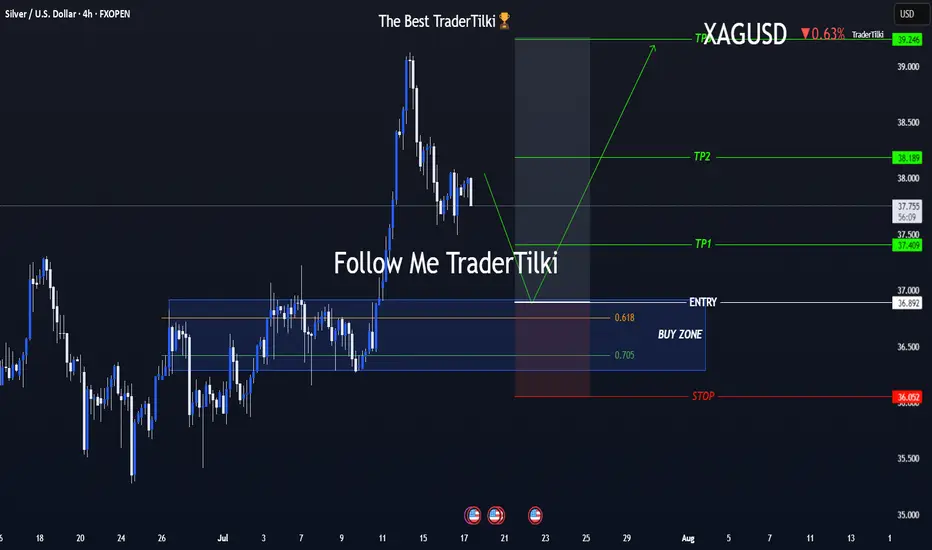
One Shot, Clear Strategy – Silver Buy Zone in SightHey everyone 👋
📌 BUY LIMIT ORDER / XAGUSD-SILVER Key Levels
🟢 Entry: 36,892
🎯 Target 1: 37,409
🎯 Target 2: 38,189
🎯 Target 3: 39,246
🔴 Stop: 36,052
📈 Risk/Reward Ratio: 2,79
I double-checked the levels and put together a clean, focused analysis just for you. Every single like seriously boosts my motivation to keep sharing 📈 Your support means the world to me! Huge thanks to everyone who likes and backs this work 💙 Our goals are crystal clear, our strategy is solid. Let’s keep moving forward with confidence and smart execution!
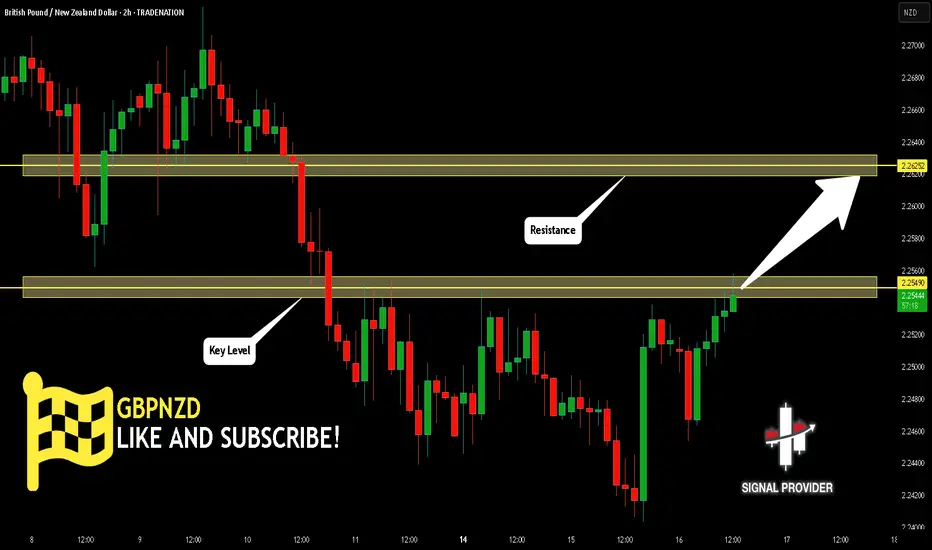
GBPNZD Is Bullish! Buy!
Here is our detailed technical review for GBPNZD.
Time Frame: 2h
Current Trend: Bullish
Sentiment: Oversold (based on 7-period RSI)
Forecast: Bullish
The market is approaching a significant support area 2.254.
The underlined horizontal cluster clearly indicates a highly probable bullish movement with target 2.262 level.
P.S
We determine oversold/overbought condition with RSI indicator.
When it drops below 30 - the market is considered to be oversold.
When it bounces above 70 - the market is considered to be overbought.
Disclosure: I am part of Trade Nation's Influencer program and receive a monthly fee for using their TradingView charts in my analysis.
Like and subscribe and comment my ideas if you enjoy them!
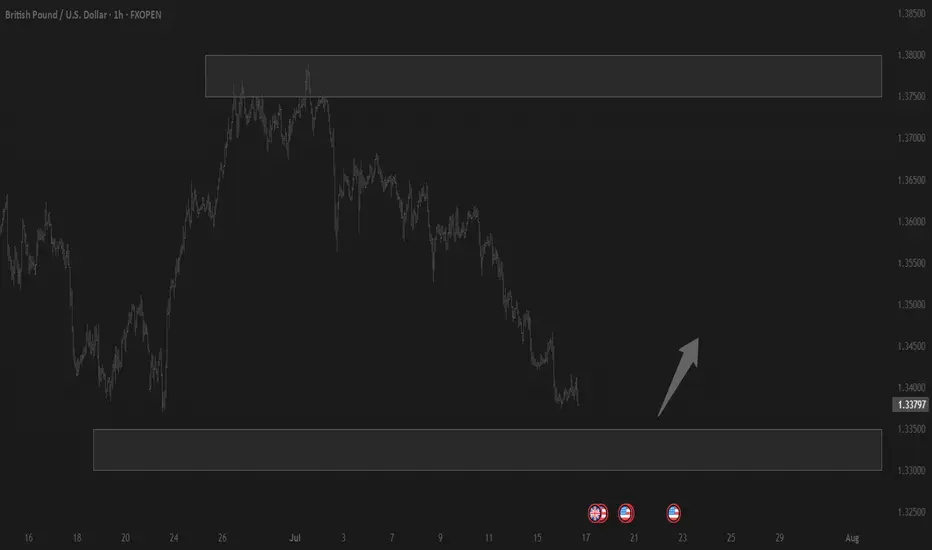
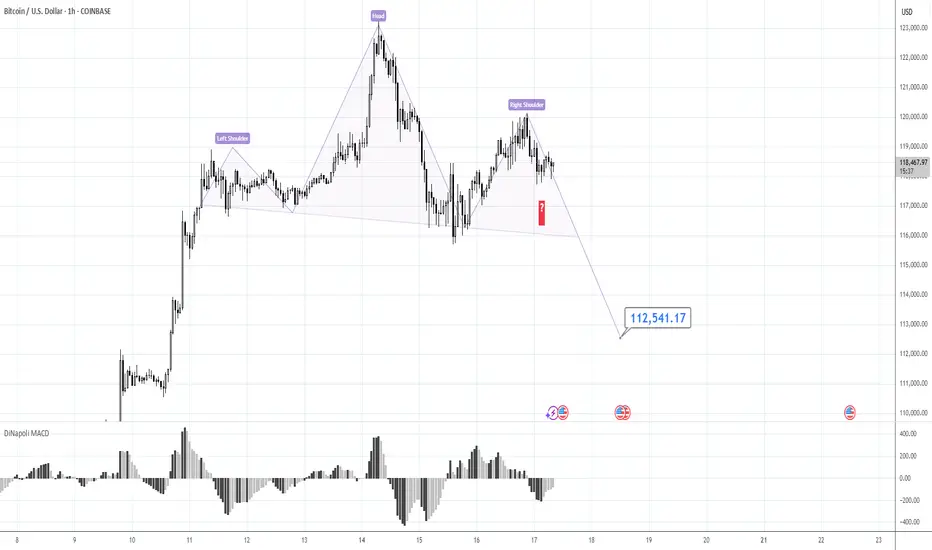
120K is the Key.Morning folks,
Our last plan worked perfect - market re-tested 117K support and jumped out. If you have longs - you could keep it.
We consider now two alternative scenarios, although we think that this one with triangle is more probable, we do not exclude the H&S shape on 1H chart that could lead BTC down to 112-113K support area.
So, if you do not know how to deal with this - keep an eye on the 120K area and top of the right arm. Upside breakout will confirm H&S failure and triangle scenario. Otherwise, until market stands under 120K - consider H&S as a basic scenario, just for safety.
Take care, S.
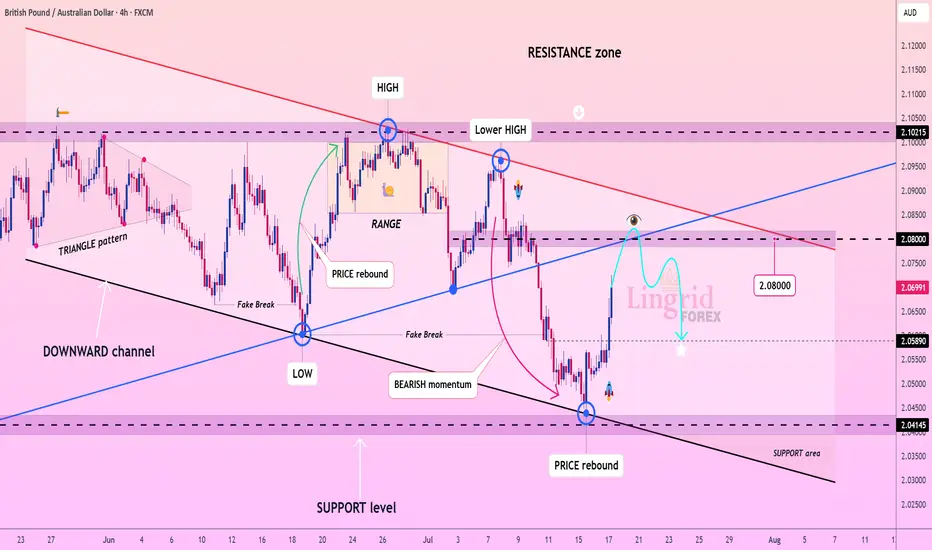
Lingrid | GBPAUD Selling Opportunity From the Key LevelFX:GBPAUD rebounded sharply from the key support zone near 2.0415, forming a corrective leg toward the mid-range resistance at 2.0800. However, the overall structure remains within a downward channel, and the recent lower high under the red resistance trendline suggests continuation of bearish pressure. A rejection from the 2.08–2.10 zone would likely resume the prior impulse leg toward lower support levels. Until a breakout above the descending red trendline occurs, rallies remain corrective.
📉 Key Levels
Sell trigger: Rejection from 2.0800–2.0900
Sell zone: 2.0750–2.0850
Target: 2.0589 and potentially 2.0415
Invalidation: Break and close above 2.1020
💡 Risks
Breakout from the red resistance line could reverse the downtrend
Sudden AUD weakness from macro events
Price closes above the descending channel boundary
If this idea resonates with you or you have your own opinion, traders, hit the comments. I’m excited to read your thoughts!
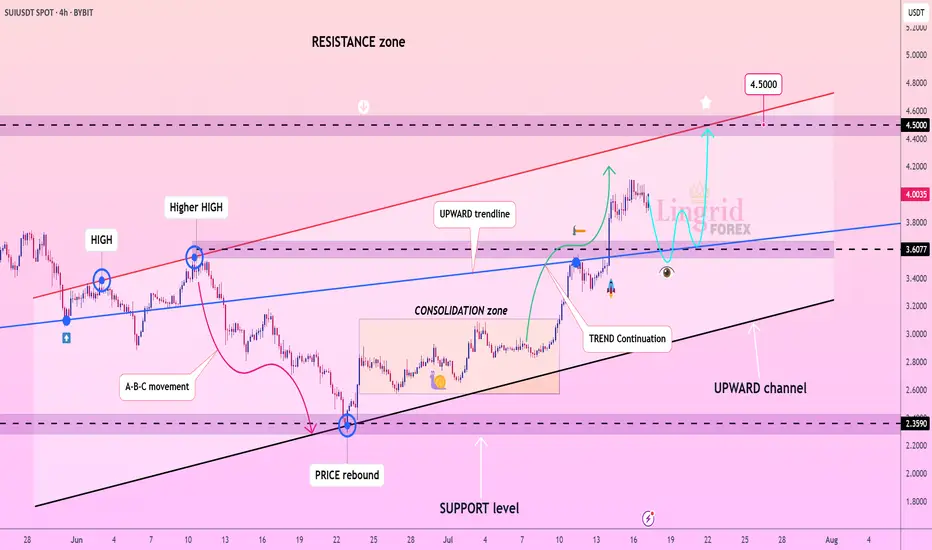
Lingrid | SUIUSDT Pullback and New Higher High PotentialBINANCE:SUIUSDT has rebounded strongly from the support level at $3.60, continuing its bullish sequence of higher highs and higher lows. The price broke out of the consolidation zone and climbed above the blue upward trendline, confirming a continuation of the bullish trend. A retest of the breakout area is likely before a push toward the major resistance zone at $4.50. The structure remains bullish as long as the channel support holds.
📉 Key Levels
Buy trigger: Bounce from $3.60 zone
Buy zone: $3.55–$3.70 (retest range)
Target: $4.50 (red resistance line)
Invalidation: Close below $3.45 trendline support
💡 Risks
Breakdown of the black channel line
Volume divergence or failure to hold the $3.60 support
Broader market weakness across altcoins
If this idea resonates with you or you have your own opinion, traders, hit the comments. I’m excited to read your thoughts!
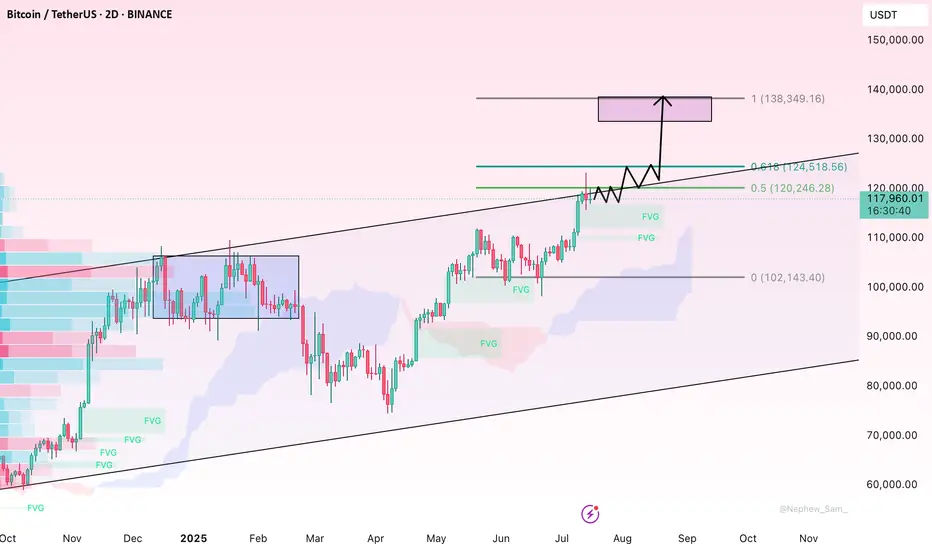
BTC Nears $120K – Pullback Risk or Breakout Launchpad?Bitcoin has rallied strongly after breaking its multi-week consolidation, now hovering just under the key psychological and historical resistance at $120K. The daily chart shows price floating above the 20EMA, with no signs of distribution—yet. However, the dense liquidity pocket between $110K–$114K remains a magnet in case of a technical pullback.
If bulls defend $118K and price cleanly breaks above $121K with strong volume, the next target lies in the $125K–$128K zone. Spot ETF inflows remain healthy, and any dovish pivot from the Fed could set off another crypto-wide bull wave.
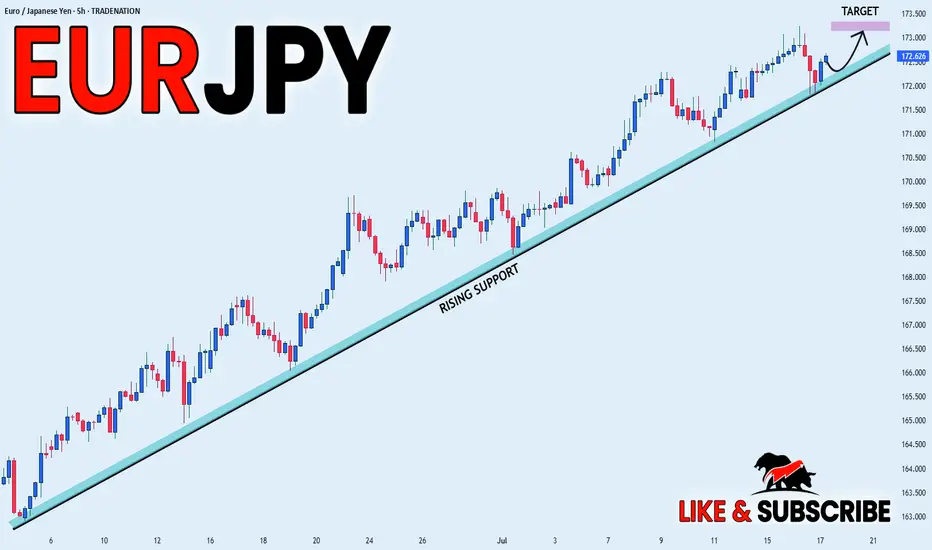
EUR_JPY WILL GO UP|LONG|
✅EUR_JPY is trading along the rising support line
And as the pair is going up now
After the retest of the line
I am expecting the price to keep growing
To retest the supply levels above at 173.166
LONG🚀
✅Like and subscribe to never miss a new idea!✅
Disclosure: I am part of Trade Nation's Influencer program and receive a monthly fee for using their TradingView charts in my analysis.
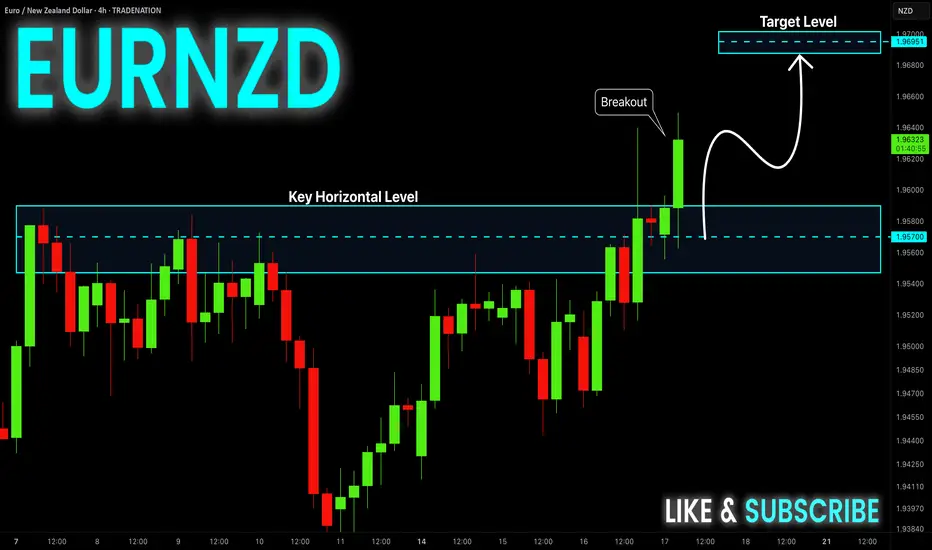
EUR-NZD Will Keep Growing! Buy!
Hello,Traders!
EUR-NZD is trading in a
Strong uptrend and the
Pair made a bullish breakout
Of the key horizontal level
Of 1.9580 so we are bullish
Biased and we will be expecting
A further bullish move up
Buy!
Comment and subscribe to help us grow!
Check out other forecasts below too!
Disclosure: I am part of Trade Nation's Influencer program and receive a monthly fee for using their TradingView charts in my analysis.
USD/JPY – Rising Wedge Meets Major ResistanceChart Overview:
USD/JPY is printing a textbook rising wedge formation, typically a bearish pattern—especially when occurring at the top of a major move.
What makes this setup compelling:
Price is testing the upper wedge resistance near the 148.50–149.00 region, a historically reactive zone.
There’s clear confluence with the 200 SMA, horizontal resistance, and wedge structure—all signaling potential exhaustion.
🔍 Key Technicals:
Resistance Zone: 148.00–149.00 (Highlighted Supply Zone)
Rejection Candle Pattern: Recent upper wick shows rejection and buyer fatigue
Bearish Divergence on RSI (14): Price made higher highs, RSI printed lower highs — a classic warning signal
🧠 Educational Note: Rising Wedge Patterns
A rising wedge is a bearish reversal pattern, especially potent when it forms after an extended rally. The structure narrows as buyers lose steam, leading to a likely breakdown once support is breached.
Pro Tip: Always confirm a wedge breakdown with a close below support + volume spike or bearish engulfing.
🔄 Invalidation:
This idea becomes invalid above 150.467, where the wedge breaks upward and price potentially enters a new bullish phase. Marked clearly as “Idea Invalid” on the chart.
🧠 Final Thoughts:
This chart combines price action, pattern structure, RSI divergence, and SMA confluence — a high-probability scenario favored by elite traders. If you trade based on confirmation rather than prediction, this could be a setup to watch closely.
🗣 Drop your thoughts or questions below!
💬 Let’s learn and grow together.

XAU/USD 1H – Bullish Breakout in Play | Eyes on 3,400+XAU/USD has officially broken out of a falling wedge pattern, triggering a classic bullish continuation setup. The rejection off the 0.618–0.705 fib retracement zone ($3,280–$3,290) acted as a powerful launchpad, pushing price above the mid-structure confluence and EMAs.
✅ Key Technical Highlights:
Structure Break: Clear bullish breakout from descending wedge + EMA crossover confirmation (20/50 over 200).
Fibonacci Anchors: Price respected the golden pocket (0.618–0.705), now aiming for full fib extension targets.
Targets:
🎯 TP1: 3,397 (-0.27 fib)
🎯 TP2: 3,440 (-0.618 fib / upper wedge trend-line resistance)
Support Zone: 3,304 – 3,319 (0.5–0.382 fib zone), now acting as fresh demand area.
RSI: Rebounding from 50 with momentum, no divergence, suggesting room for continuation.
🔔 Bullish Scenario:
As long as price holds above the breakout retest zone (≈3,336), momentum favors the bulls with high probability toward 3,400+. Clean higher highs and higher lows confirm trend alignment.
⚠️ Invalidation Level:
Break and close back below 3,304 would shift this from breakout to fakeout — watch for bearish pressure toward 3,280 if that occurs.
📌 Wright Way Outlook:
Momentum is on the side of the bulls. With fundamentals aligned and structure broken, this setup favors precision swing entries with clean RR.
Stay patient, stay tactical. Trade the Wright Way.

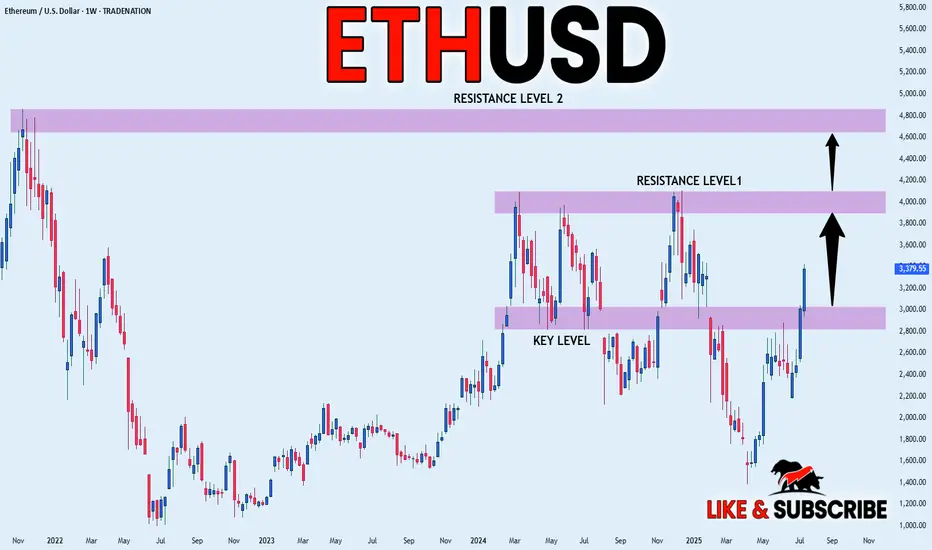
ETHEREUM WILL KEEP GROWING|LONG|
✅ETHEREUM is trading in a
Strong uptrend and the coin
Broke the important horizontal level
Of 3000$ which is now a support
And we are very bullish biased
And we think that ETH will
Reach at least the previous ATH
Of just short of 5000$ but the
First target is to reach and break
A resistance level of 4100$
LONG🚀
✅Like and subscribe to never miss a new idea!✅
Disclosure: I am part of Trade Nation's Influencer program and receive a monthly fee for using their TradingView charts in my analysis.
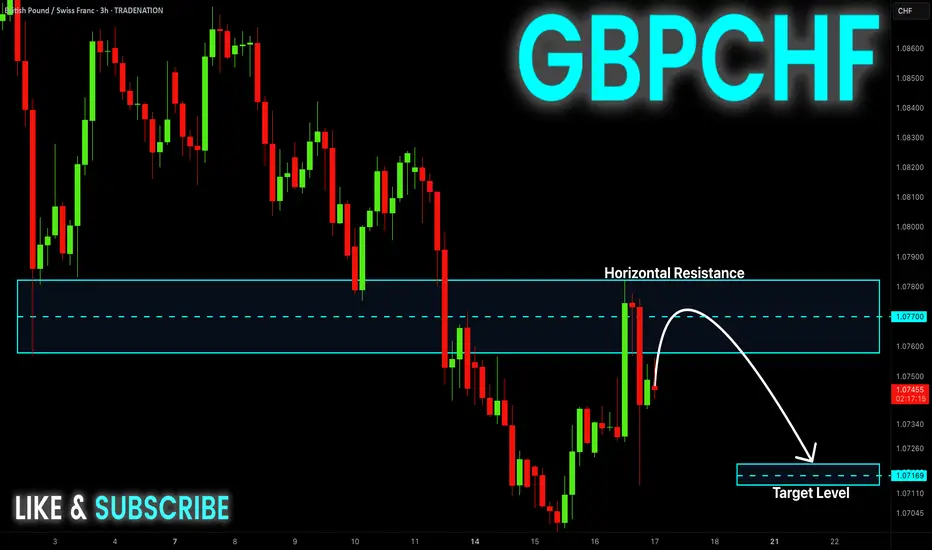
GBP-CHF Local Short! Sell!
Hello,Traders!
GBP-CHF made a retest of
The wide horizontal resistance
Of 1.0780 and we are already
Seeing a bearish pullback
So as the pair is trading in a
Downtrend we will be expecting
A further bearish move down
Sell!
Comment and subscribe to help us grow!
Check out other forecasts below too!
Disclosure: I am part of Trade Nation's Influencer program and receive a monthly fee for using their TradingView charts in my analysis.
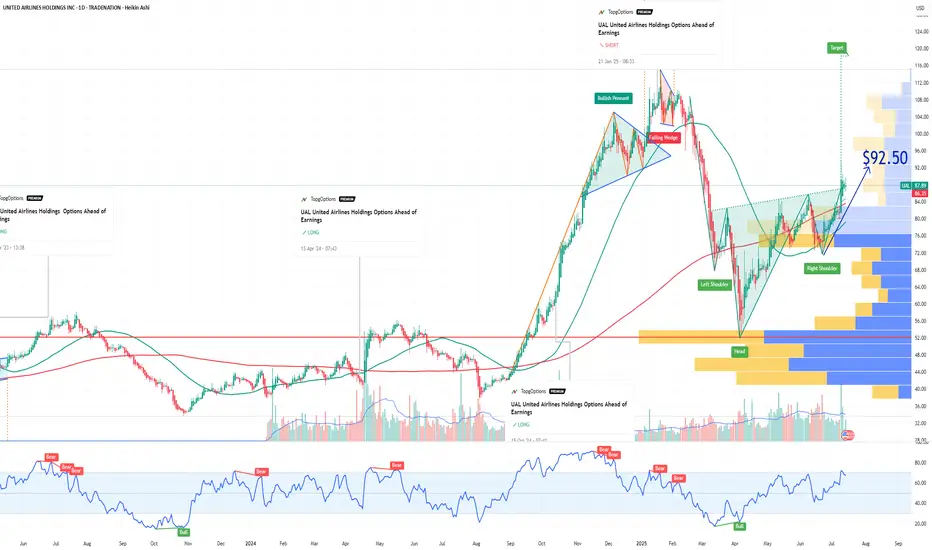
UAL United Airlines Holdings Options Ahead of EarningsIf you haven`t exited UAL before the recent selloff:
Now analyzing the options chain and the chart patterns of UAL United Airlines Holdings prior to the earnings report this week,
I would consider purchasing the 92.5usd strike price Calls with
an expiration date of 2025-9-19,
for a premium of approximately $5.12.
If these options prove to be profitable prior to the earnings release, I would sell at least half of them.
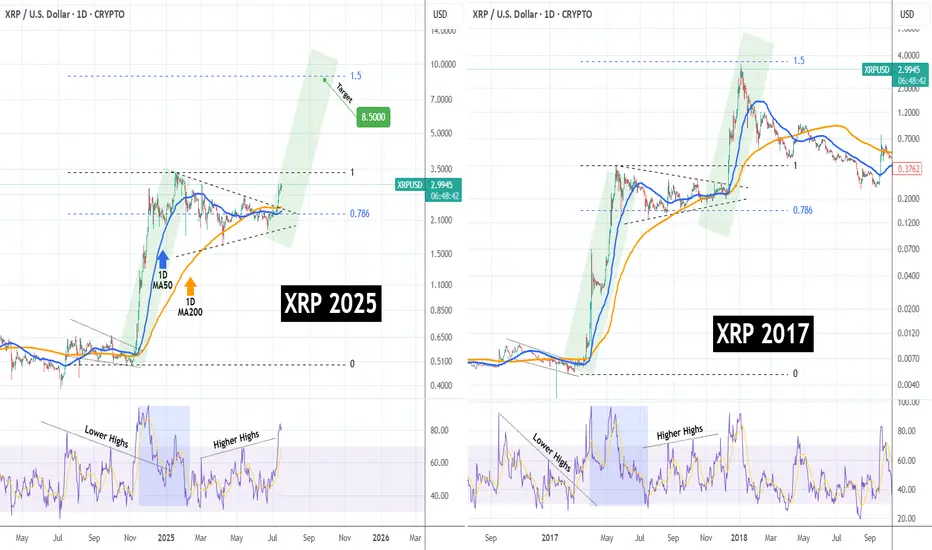
XRPUSD Has it started the mega rally to $8.500??XRP (XRPUSD) has been trading within a Triangle pattern for the past 6 months (January - July 2025) and only recently, it broke to the upside. Ahead of a pending 1D Golden Cross, this pattern is no different than the one of the previous Cycle from May - December 2017.
That setup resulted into the final Parabolic Rally of the Cycle that peaked just below the 1.5 Fibonacci extension. As you can see, both fractals are identical even from their starts, both initiated after a Falling Wedge that produced the first Parabolic Rally (green), which transitioned into the Triangle we described. Even their 1D RSI sequences are similar.
As a result, it is more than probable to see XRP hit $8.500 (Fib 1.5 ext), by the end of the year.
-------------------------------------------------------------------------------
** Please LIKE 👍, FOLLOW ✅, SHARE 🙌 and COMMENT ✍ if you enjoy this idea! Also share your ideas and charts in the comments section below! This is best way to keep it relevant, support us, keep the content here free and allow the idea to reach as many people as possible. **
-------------------------------------------------------------------------------
💸💸💸💸💸💸
👇 👇 👇 👇 👇 👇
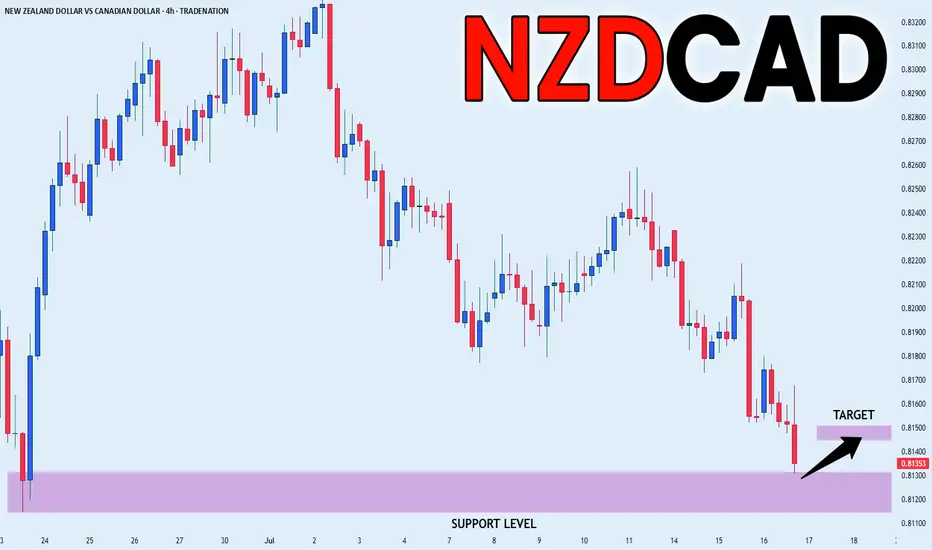
NZD_CAD LOCAL LONG|
✅NZD_CAD is set to retest a
Strong support level below at 0.8114
After trading in a local downtrend for some time
Which makes a bullish rebound a likely scenario
With the target being a local resistance above at 0.8145
LONG🚀
✅Like and subscribe to never miss a new idea!✅
Disclosure: I am part of Trade Nation's Influencer program and receive a monthly fee for using their TradingView charts in my analysis.
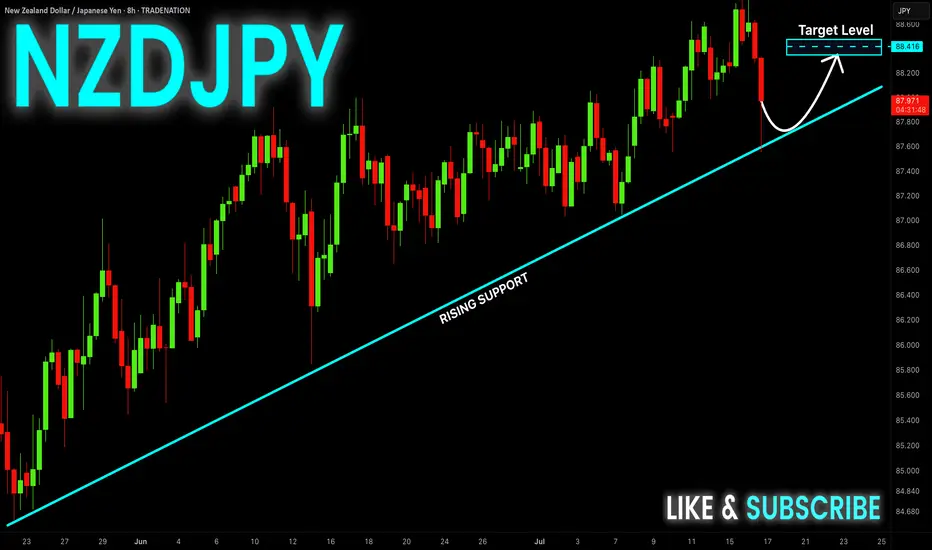
NZD-JPY Long From Rising Support! Buy!
Hello,Traders!
NZD-JPY keeps trading in
An uptrend along the rising
Support line and the pair made
A quick retest and we are seeing
A rejection so we are bullish
Biased and we will be expecting
A further bullish move up
Buy!
Comment and subscribe to help us grow!
Check out other forecasts below too!
Disclosure: I am part of Trade Nation's Influencer program and receive a monthly fee for using their TradingView charts in my analysis.
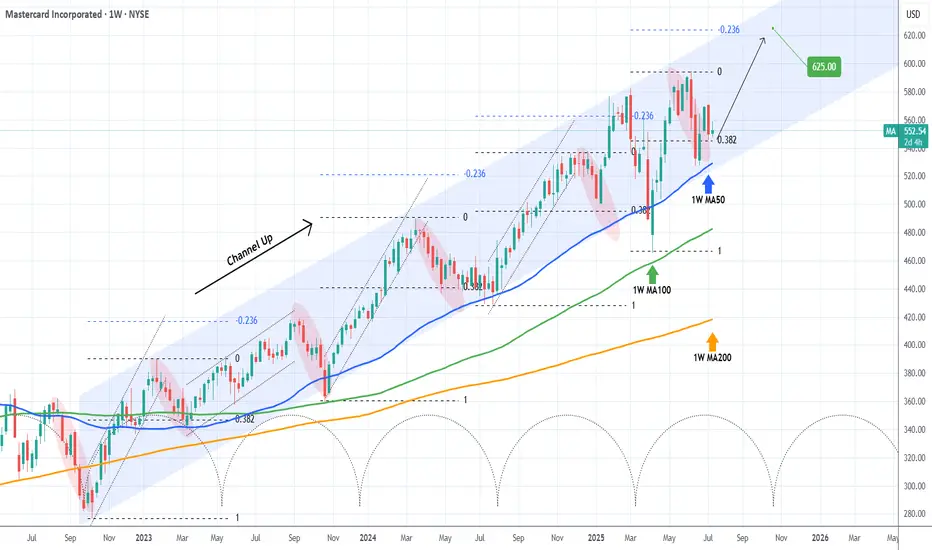
MASTERCARD Best buy entry now. Target $625.Mastercard (MA) has been trading within almost a 3-year Channel Up that only broke (but recovered naturally) during Trump's trade war. Still, the 1W MA100 (green trend-line) contained the downfall, as it always had.
Normally the Bearish Legs of this pattern tend to find Support on the 1W MA50 (blue trend-line), as the latest one did 3 weeks ago. Now that the price is trading still on the 0.382 Fibonacci retracement level, it historically is the best buy opportunity, as per all previous Bullish Legs.
The Channel Up has always priced its Higher High (top) on at least the -0.236 Fibonacci extension. As a result, we are targeting $625.00 before the year ends.
-------------------------------------------------------------------------------
** Please LIKE 👍, FOLLOW ✅, SHARE 🙌 and COMMENT ✍ if you enjoy this idea! Also share your ideas and charts in the comments section below! This is best way to keep it relevant, support us, keep the content here free and allow the idea to reach as many people as possible. **
-------------------------------------------------------------------------------
💸💸💸💸💸💸
👇 👇 👇 👇 👇 👇
Gold – Bullish Structure Still Intact, but Bears are Knocking📉 What happened yesterday?
As expected, XAUUSD made another leg down, breaking even below my buy zone (3330–3335) and hitting a low at 3320. From there, we’re now seeing a modest rebound, with gold trading around 3333 at the time of writing.
📌 Current position:
I'm currently holding a long position. It hovers around break-even – fluctuating between small gains and small losses. Nothing solid yet.
❓ Key question:
Was this just a deep pullback within a bullish structure… or the beginning of a deeper trend reversal?
🔍 Why bulls still have a case:
• Price prints higher lows – bullish structure technically remains intact
• A clean break above 3350 would show short-term strength
• A confirmed break above 3375 would activate a bullish ascending triangle → targeting the 3450 zone
⚠️ But here's the concern:
• Yesterday’s dip to 3330 happened during the New York session (strong volume)
• The bounce from 3320 has been weak, with no follow-through
• Daily candle closed near the lows, showing a long upper wick → a classic bearish signal
• The confluence support now lies at 3310–3320. A red daily candle closing in this area could mean the medium-term trend is flipping
🎯 My trading plan:
Although I'm still holding my buy, if bulls don’t recover 3350 quickly, I will consider closing early. The break of 3310 would shift my bias bearish.
________________________________________
📌 Conclusion:
We’re in a critical zone. The bullish structure isn’t broken yet, but yesterday’s action was not encouraging. If buyers fail to reclaim control soon, the market may be preparing for a deeper correction. Stay sharp. 🚀
Disclosure: I am part of TradeNation's Influencer program and receive a monthly fee for using their TradingView charts in my analyses and educational articles.

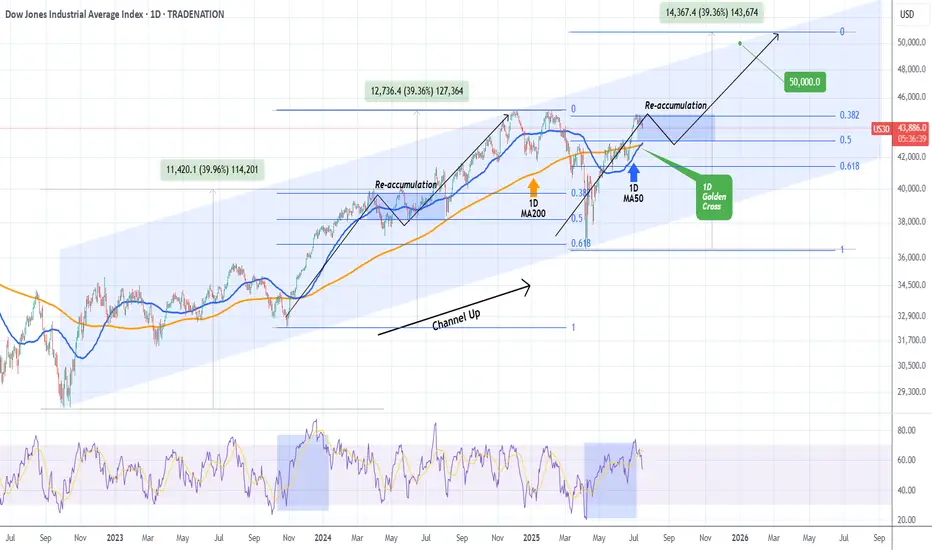
DOW JONES formed 1st 1D Golden Cross since 2022!Dow Jones (DJIA) completed on Monday its 1st Golden Cross on the 1D time-frame since December 12 2022! This powerful bullish pattern comes with the price close to its All Time High (ATH).
Being inside almost a 3-year Channel Up, the current rise is the pattern's latest Bullish Leg following the April 07 2025 bottom (Higher Low). Both previous Bullish Legs rose by +39.96% before forming a Higher High.
Based on the Fibonacci retracement levels, last time the previous Bullish Leg was within the 0.382 - 0.5 Fibonacci Zone, it formed a Re-accumulation Phase for 3 months. As a result, we shouldn't dismiss the fact of trading sideways for the rest of the Summer and then picking up the pace. Our end-of-year Target remains 50000.
-------------------------------------------------------------------------------
** Please LIKE 👍, FOLLOW ✅, SHARE 🙌 and COMMENT ✍ if you enjoy this idea! Also share your ideas and charts in the comments section below! This is best way to keep it relevant, support us, keep the content here free and allow the idea to reach as many people as possible. **
-------------------------------------------------------------------------------
Disclosure: I am part of Trade Nation's Influencer program and receive a monthly fee for using their TradingView charts in my analysis.
💸💸💸💸💸💸
👇 👇 👇 👇 👇 👇
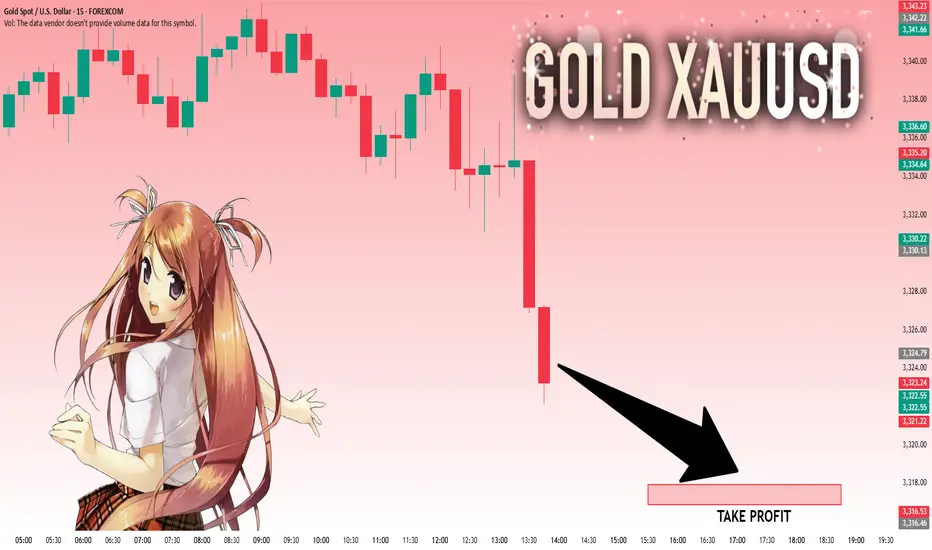
GOLD: Absolute Price Collapse Ahead! Short!
My dear friends,
Today we will analyse GOLD together☺️
The price is near a wide key level
and the pair is approaching a significant decision level of 3.324.79 Therefore, a strong bearish reaction here could determine the next move down.We will watch for a confirmation candle, and then target the next key level of 3,317.96..Recommend Stop-loss is beyond the current level.
❤️Sending you lots of Love and Hugs❤️
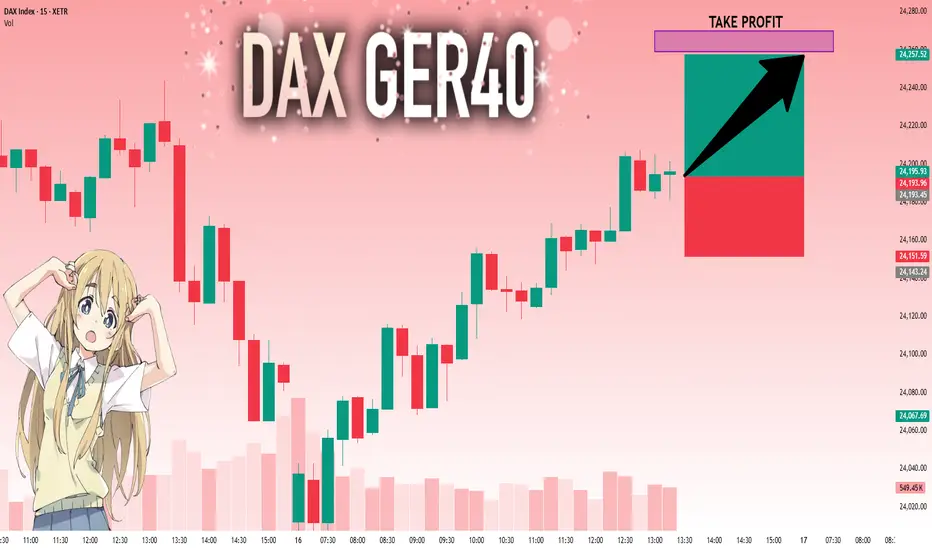
DAX: Will Go Up! Long!
My dear friends,
Today we will analyse DAX together☺️
The recent price action suggests a shift in mid-term momentum. A break above the current local range around 24,193.45 will confirm the new direction upwards with the target being the next key level of 24,258.97 and a reconvened placement of a stop-loss beyond the range.
❤️Sending you lots of Love and Hugs❤️
Trading balanceTrading balance The price of the asset has rebounded from the balance zone. With the prospect of growth into the resistance zone.