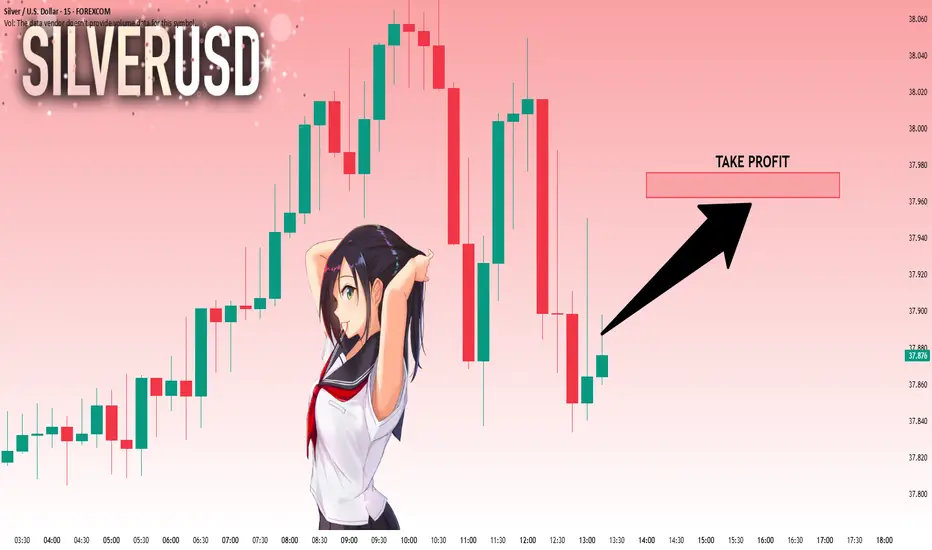
SILVER: Strong Bullish Sentiment! Long!
My dear friends,
Today we will analyse SILVER together☺️
The market is at an inflection zone and price has now reached an area around 37.873 where previous reversals or breakouts have occurred.And a price reaction that we are seeing on multiple timeframes here could signal the next move down so we can enter on confirmation, and target the next key level of 37.962..Stop-loss is recommended beyond the inflection zone.
❤️Sending you lots of Love and Hugs❤️
Signals
BITCOIN Should we still trust the Stock to Flow model??It sure worked perfectly during Bitcoin's (BTCUSD) first Cycles, but the Stock-to-Flow model has greatly diverged from the current price action since March 2024.
Right now the model sits at around $750000, which is vastly above the current market price of $119000. It's been trading sideways actually since June 2024 and all of the times that it was ranging, Bitcoin eventually caught up and closed the gap.
It has always been a 'story' of divergence and convergence but it sure seems unrealistic to catch up this time, especially during if this Cycle continues to follow the 4-year model.
So what do you think? Should we still trust what seems more and more like an 'obsolete' model as mass adoption kicks in? Feel free to let us know in the comments section below!
-------------------------------------------------------------------------------
** Please LIKE 👍, FOLLOW ✅, SHARE 🙌 and COMMENT ✍ if you enjoy this idea! Also share your ideas and charts in the comments section below! This is best way to keep it relevant, support us, keep the content here free and allow the idea to reach as many people as possible. **
-------------------------------------------------------------------------------
💸💸💸💸💸💸
👇 👇 👇 👇 👇 👇

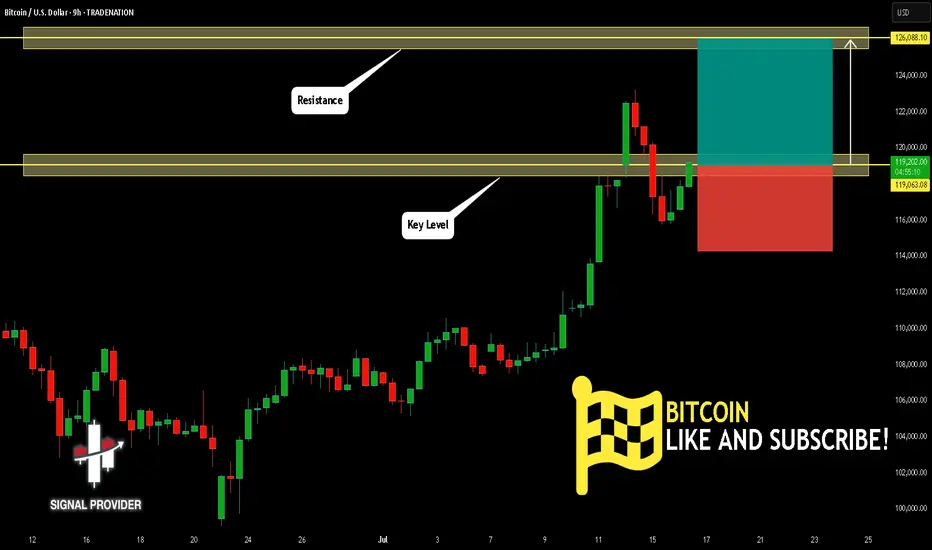
BITCOIN Will Go Higher! Long!
Here is our detailed technical review for BITCOIN.
Time Frame: 9h
Current Trend: Bullish
Sentiment: Oversold (based on 7-period RSI)
Forecast: Bullish
The market is trading around a solid horizontal structure 119,063.08.
The above observations make me that the market will inevitably achieve 126,088.10 level.
P.S
Overbought describes a period of time where there has been a significant and consistent upward move in price over a period of time without much pullback.
Disclosure: I am part of Trade Nation's Influencer program and receive a monthly fee for using their TradingView charts in my analysis.
Like and subscribe and comment my ideas if you enjoy them!
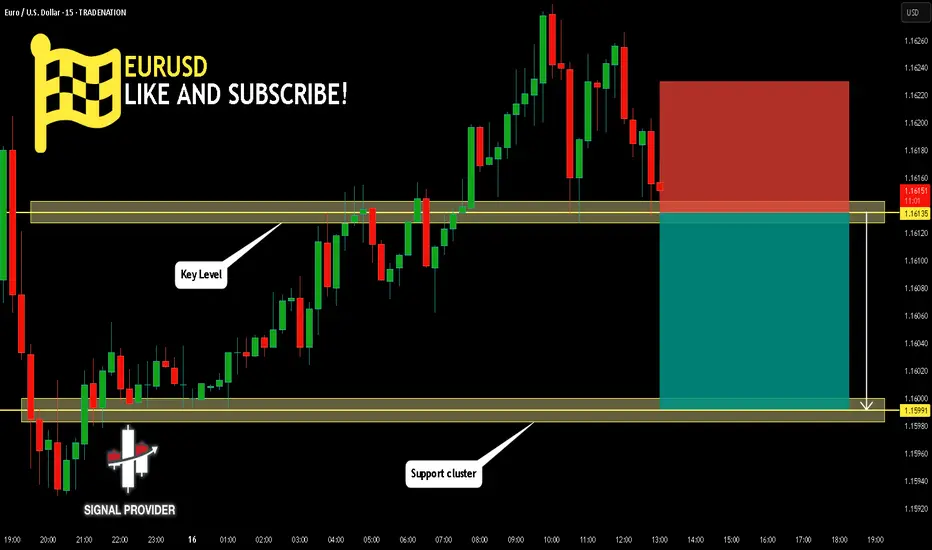
EURUSD Will Go Down! Short!
Take a look at our analysis for EURUSD.
Time Frame: 15m
Current Trend: Bearish
Sentiment: Overbought (based on 7-period RSI)
Forecast: Bearish
The market is testing a major horizontal structure 1.161.
Taking into consideration the structure & trend analysis, I believe that the market will reach 1.159 level soon.
P.S
Please, note that an oversold/overbought condition can last for a long time, and therefore being oversold/overbought doesn't mean a price rally will come soon, or at all.
Disclosure: I am part of Trade Nation's Influencer program and receive a monthly fee for using their TradingView charts in my analysis.
Like and subscribe and comment my ideas if you enjoy them!
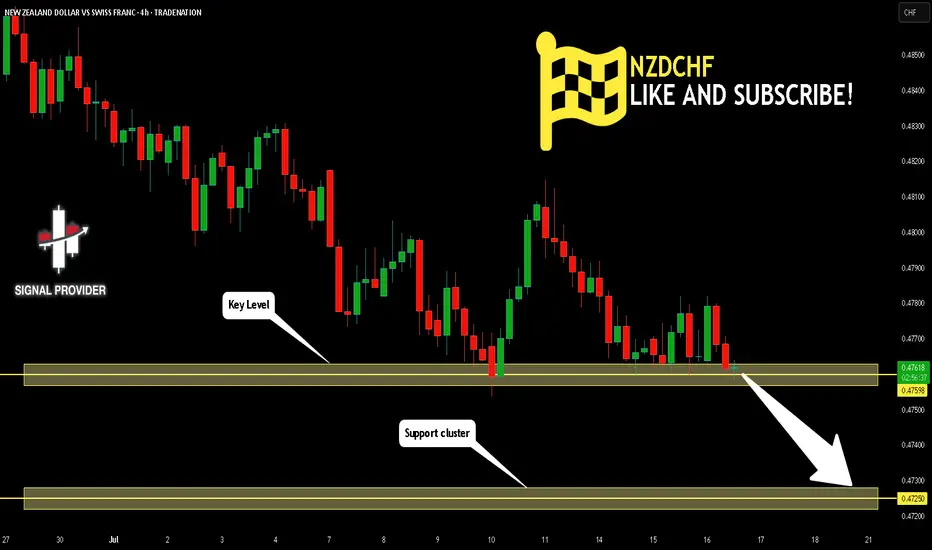
NZDCHF Will Move Lower! Sell!
Please, check our technical outlook for NZDCHF.
Time Frame: 4h
Current Trend: Bearish
Sentiment: Overbought (based on 7-period RSI)
Forecast: Bearish
The market is approaching a key horizontal level 0.475.
Considering the today's price action, probabilities will be high to see a movement to 0.472.
P.S
The term oversold refers to a condition where an asset has traded lower in price and has the potential for a price bounce.
Overbought refers to market scenarios where the instrument is traded considerably higher than its fair value. Overvaluation is caused by market sentiments when there is positive news.
Disclosure: I am part of Trade Nation's Influencer program and receive a monthly fee for using their TradingView charts in my analysis.
Like and subscribe and comment my ideas if you enjoy them!
GOLD Is Going Down! Short!
Please, check our technical outlook for GOLD.
Time Frame: 2h
Current Trend: Bearish
Sentiment: Overbought (based on 7-period RSI)
Forecast: Bearish
The price is testing a key resistance 3,363.11.
Taking into consideration the current market trend & overbought RSI, chances will be high to see a bearish movement to the downside at least to 3,342.15 level.
P.S
Please, note that an oversold/overbought condition can last for a long time, and therefore being oversold/overbought doesn't mean a price rally will come soon, or at all.
Disclosure: I am part of Trade Nation's Influencer program and receive a monthly fee for using their TradingView charts in my analysis.
Like and subscribe and comment my ideas if you enjoy them!

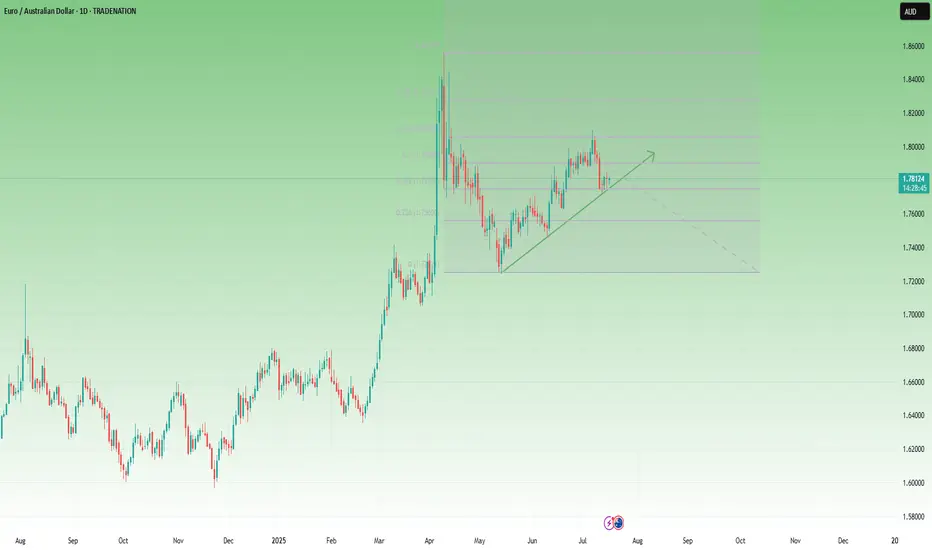
EURAUD Flag Forming Below 1.80 – Time to Sell the Rally?📈 The Big Picture
In mid-February, EURAUD exploded to the upside, gaining over 2000 pips in just two weeks. After peaking near 1.85, the pair corrected sharply, returning to more balanced levels around 1.72.
🕰️ What’s happened since?
The market has resumed its climb and just recently made a new local high at 1.81. On the surface, it looks like bulls are still in control – but a closer look reveals warning signs.
🔍 Key structure observations:
• The current rally appears to be a measured move, topping out near the 61.8% Fibonacci retracement of the previous drop
• Price structure is overlapping, suggesting weak momentum
• A large flag pattern is developing – typically bearish in this context
• The pair still trades above the ascending trendline, but a breakdown is looming
📍 Current price: 1.7805
🎯 Swing Trade Plan
From a swing trading perspective, I’m looking to sell rallies near the 1.80 zone, with:
• Negation: if the price breaks clearly above the recent high
• Target: the recent low around 1.7250 – where the last correction ended
________________________________________
📌 Conclusion:
EURAUD may have exhausted its bullish energy. The technical picture suggests we are in the late stage of the rally, with bearish patterns stacking up. Unless bulls manage a clean breakout above 1.80, this looks like a great place to position for a medium-term reversal. 🚀
Disclosure: I am part of TradeNation's Influencer program and receive a monthly fee for using their TradingView charts in my analyses and educational articles.
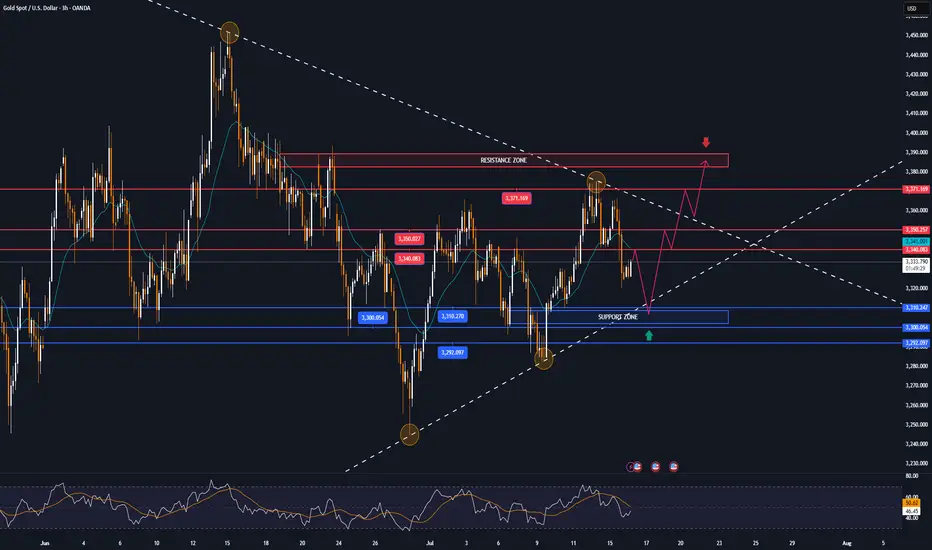
GOLD in narrow range, after sharp drop on US CPI dataOANDA:XAUUSD fell sharply on Tuesday (July 15) as the US Dollar TVC:DXY gained significantly after the US CPI report was released. As of now (July 16), gold is trading at 3,326 USD/oz, equivalent to an increase of only 2 USD in the day.
The US Consumer Price Index (CPI) in June was in line with expectations but higher than the previous value. The surge in the Dollar after the US released the June CPI is the main reason for the pressure on gold prices so far.
• Data released by the US on Tuesday showed that the US CPI increased by 2.7% compared to the same period last year in June, in line with expectations, but higher than the 2.4% in May.
• The US CPI rose 0.3% month-on-month in June, in line with market expectations but up from a 0.1% increase, the largest increase since January this year.
• In addition, the US core CPI rose 2.9% year-on-year in June, up from 2.8% in May, while the core CPI in June rose 0.2% month-on-month.
The market generally believes that US President Trump's tariff policies have increased price pressures, prompting the Federal Reserve to wait and see what further action to take. Federal Reserve Chairman Powell previously said he expected prices to rise in the summer.
The market is still expecting the first rate cut in September. Investors are looking ahead to Wednesday's U.S. producer price index data for more information on the Federal Reserve's move.
Since gold does not yield interest, it typically performs well in low-interest-rate environments, whereas high-interest-rate environments or expectations of future rate hikes put pressure on gold prices.
Technical Outlook Analysis OANDA:XAUUSD
On the daily chart, gold is trading in a fairly narrow range after 2 sessions of downward adjustment, but the specific trend is still unclear, as sent to readers throughout last week, the technical conditions mainly show a sideways accumulation movement. After testing the 0.236% Fibonacci retracement level, gold was unable to overcome this resistance, and the decline from this position brought the gold price close to the support of 3,310 USD and then the area of the original price point of 3,300 USD with the 0.382% Fibonacci retracement.
With the technical conditions not giving a specific trend as they are now, for gold to be able to have a new bullish cycle it needs to move the price action above the 0.236% Fibonacci retracement level, then the target would be around $3,400 in the short term, more than $3,430. On the other hand, if gold falls below the 0.382% Fibonacci retracement level again, it could be a good signal for an expectation of a bullish cycle, then the target would be around $3,246 in the short term, more than the 0.50% Fibonacci retracement level.
The relative strength index is hovering around 50, indicating that the market is hesitant in terms of momentum and is not leaning towards a specific trend.
During the day, with the current sideways accumulation, gold will be noticed by the following technical levels.
Support: 3,310 – 3,300 – 3,292 USD
Resistance: 3,240 – 3,250 – 3,371 USD
SELL XAUUSD PRICE 3383 - 3381⚡️
↠↠ Stop Loss 3387
→Take Profit 1 3375
↨
→Take Profit 2 3369
BUY XAUUSD PRICE 3304 - 3306⚡️
↠↠ Stop Loss 3300
→Take Profit 1 3312
↨
→Take Profit 2 3318
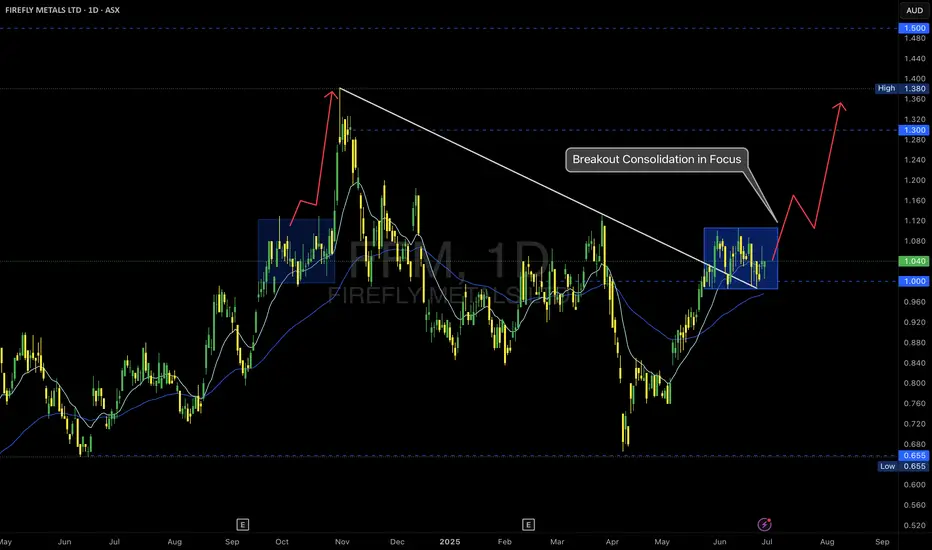
FFM -- ASX – Breakout Consolidation in Focus
📝 Description
Firefly Metals is setting up a classic breakout continuation scenario after reclaiming the $1.00 psychological level and breaking the long-term trendline resistance.
🔹 Key Observations:
• Trendline Break: The descending trendline from the prior high was decisively breached, signaling a structural shift.
• Accumulation Zone: Price has consolidated in a tight range above $1.00, forming a bullish flag or box accumulation.
• EMA Cluster Support: Both the 15 and 60 EMAs are aligned below the consolidation, providing dynamic support.
🔹 Potential Scenarios:
✅ Bullish Continuation:
A clean breakout above the top of the blue box could trigger a momentum rally toward $1.30 and ultimately the $1.38–$1.50 resistance levels.
✅ Deeper Pullback:
If price loses the $1.00 support decisively, a retracement to retest the breakout base is possible.
Trade Plan:
I am monitoring for a confirmed breakout candle with volume expansion to validate the continuation thesis.
• Entry trigger above the range high ($1.10 area)
• Stops below recent swing low / $1.00 level
• First target: $1.30 resistance
As always, risk management first—no breakout, no trade.
#MJTrading
#FFM #FireflyMetals #ASXTrading #BreakoutSetup #TechnicalAnalysis #PriceAction #TradingPlan #ChartOfTheDay #AustralianStocks #MomentumTrading #MJTrading
Gold Pullback in Play – Still Aiming for 3450 📌 In yesterday’s analysis, I argued that bulls likely won the battle and that a new leg up toward 3450 could be next from a swing trade perspective. I also mentioned that buying dips remains the preferred strategy.
And indeed – we got that dip.
📉 Price pulled back to 3340 and bounced,
but it hasn’t yet touched my key area of interest: 3330–3335.
What now?
My view stays the same –I still expect a move toward the 3450 zone,but I also believe a deeper dip toward support is still on the table – likely a liquidity grab before the next leg up.
Trading Plan:
✅ Buying dips remains the core strategy
🚫 Invalidation only comes on a break below 3305–3310
🎯 Upside target remains well above 3400, aiming for 1000+ pips
Let’s stay focused and let price come to us.
🚀
Disclosure: I am part of TradeNation's Influencer program and receive a monthly fee for using their TradingView charts in my analyses and educational articles.

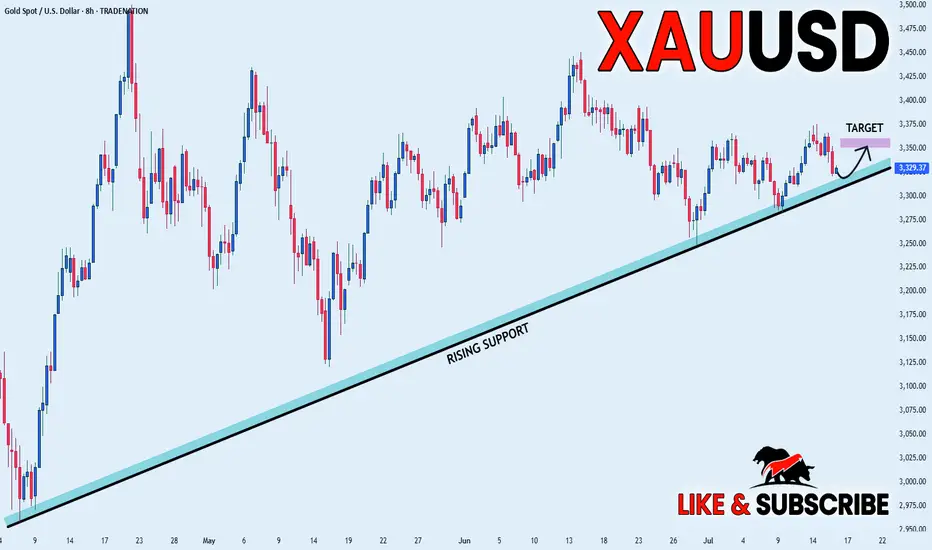
GOLD LONG FROM RISING SUPPORT|
✅GOLD is trading in an uptrend
Which makes me bullish biased
And the price is retesting the rising support
Thus, a rebound and a move up is expected
With the target of retesting the level above at 3,350$
LONG🚀
✅Like and subscribe to never miss a new idea!✅
Disclosure: I am part of Trade Nation's Influencer program and receive a monthly fee for using their TradingView charts in my analysis.
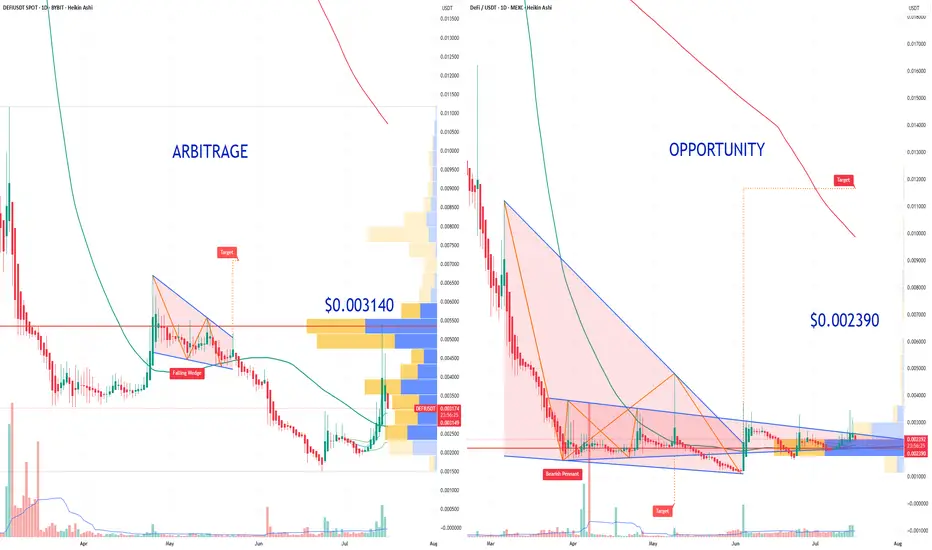
Arbitrage Opportunity!I believe I’ve identified an arbitrage opportunity involving the DEFI cryptocurrency: it trades at $0.003200 on Bybit, compared to only $0.002390 on MEXC.
I recall encountering a similar situation with Shiba Inu, when the price gap between Binance and Coinbase was as high as 8X. Feel free to play the chart below to see the outcome:
I also remember the 2016–2017 period, when such arbitrage opportunities existed even with Bitcoin, due to price discrepancies between Asian exchanges and those available to European traders.
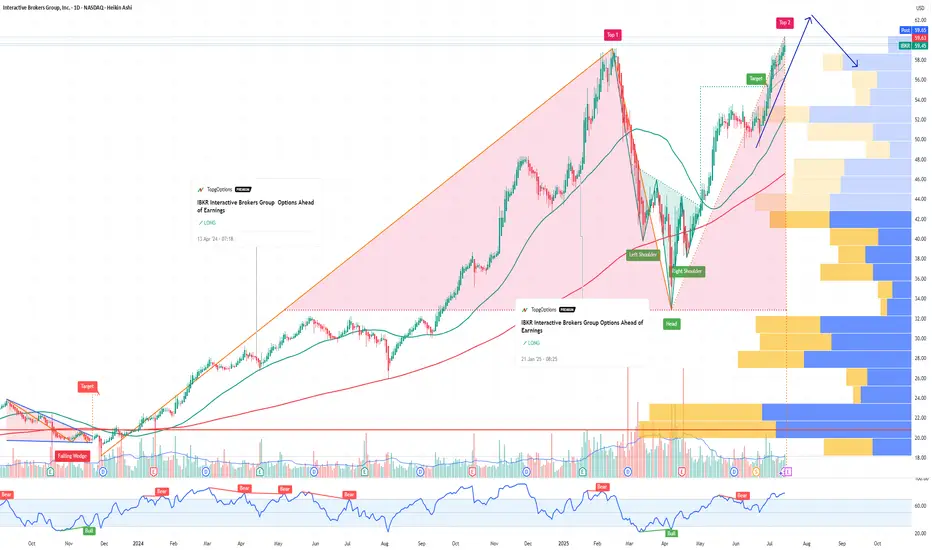
IBKR Interactive Brokers Group Options Ahead of EarningsIf you haven`t bought IBKR before the rally:
Now analyzing the options chain and the chart patterns of IBKR Interactive Brokers prior to the earnings report this week,
I would consider purchasing the 60usd strike price Calls with
an expiration date of 2025-9-19,
for a premium of approximately $3.90.
If these options prove to be profitable prior to the earnings release, I would sell at least half of them.
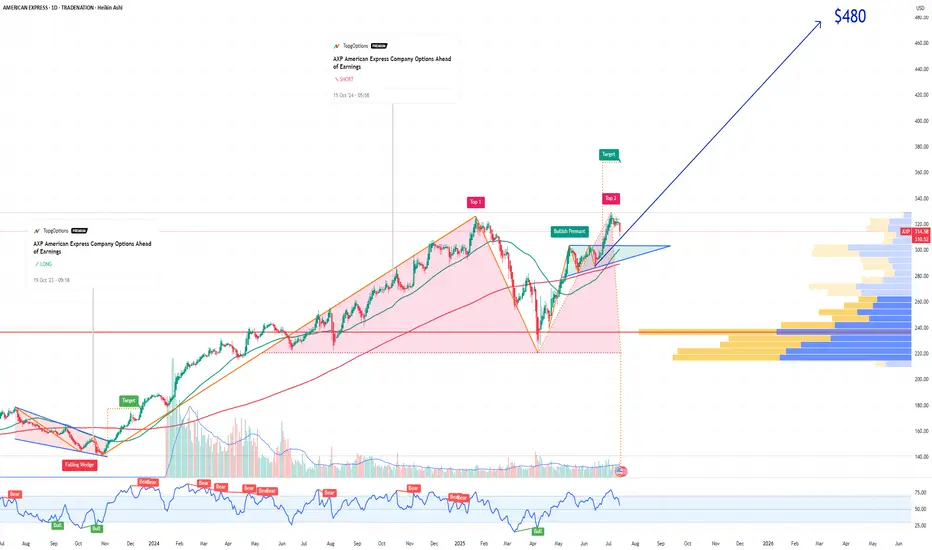
AXP American Express Company Options Ahead of EarningsIf you haven`t bought AXP before the rally:
Now analyzing the options chain and the chart patterns of AXP American Express Company prior to the earnings report this week,
I would consider purchasing the 480usd strike price Calls with
an expiration date of 2027-1-15,
for a premium of approximately $6.25.
If these options prove to be profitable prior to the earnings release, I would sell at least half of them.
Disclosure: I am part of Trade Nation's Influencer program and receive a monthly fee for using their TradingView charts in my analysis.
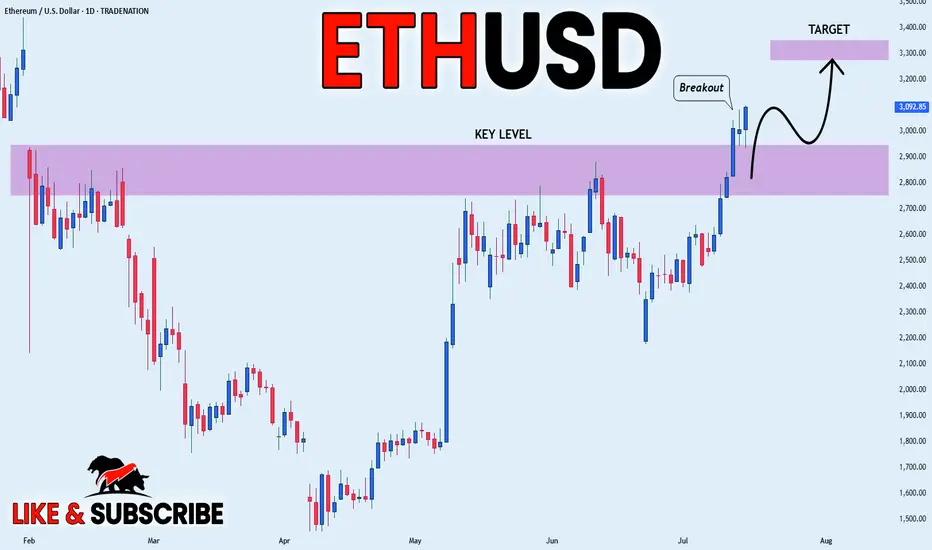
ETHEREUM WILL KEEP GROWING|LONG|
✅ETHEREUM is going up
Now and the coin made a bullish
Breakout of the key horizontal
Level of 3000$ and the breakout
Is confirmed so we are bullish
Biased and we will be expecting
A further bullish move up
LONG🚀
✅Like and subscribe to never miss a new idea!✅
Disclosure: I am part of Trade Nation's Influencer program and receive a monthly fee for using their TradingView charts in my analysis.
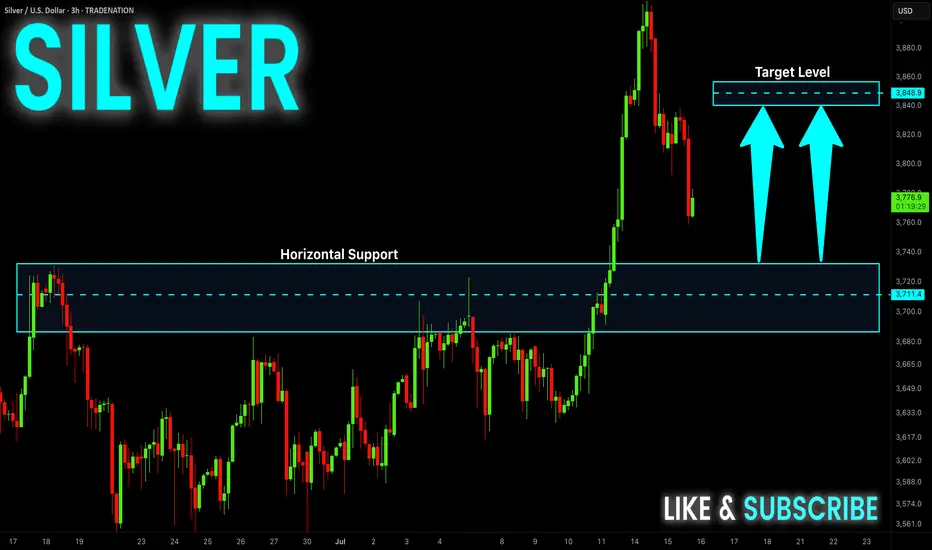
SILVER Support Ahead! Buy!
Hello,Traders!
SILVER is going down now
But the price is trading in a
Long-term uptrend so we are
Bullish biased and after the
Price retests of the horizontal
Support support below
Around 37.20$ we will be
Expecting a bullish rebound
Buy!
Comment and subscribe to help us grow!
Check out other forecasts below too!
Disclosure: I am part of Trade Nation's Influencer program and receive a monthly fee for using their TradingView charts in my analysis.
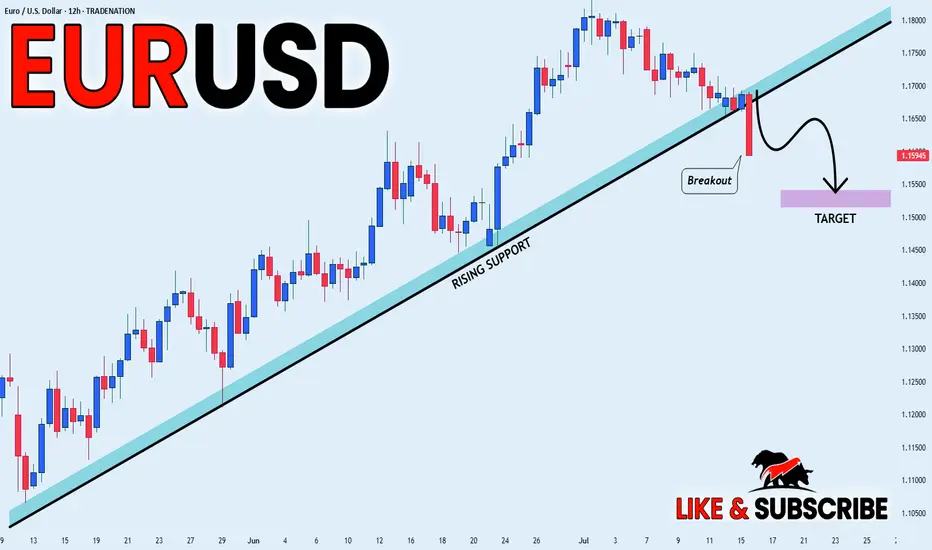
EUR_USD BEARISH BREAKOUT|SHORT|
✅EUR_USD was trading along
The rising support line but
Now we are seeing a strong bearish
Breakout and the breakout is
Confirmed so we are bearish
Biased and we will be expecting
A further bearish move down
After the potential pullback
SHORT🔥
✅Like and subscribe to never miss a new idea!✅
Disclosure: I am part of Trade Nation's Influencer program and receive a monthly fee for using their TradingView charts in my analysis.
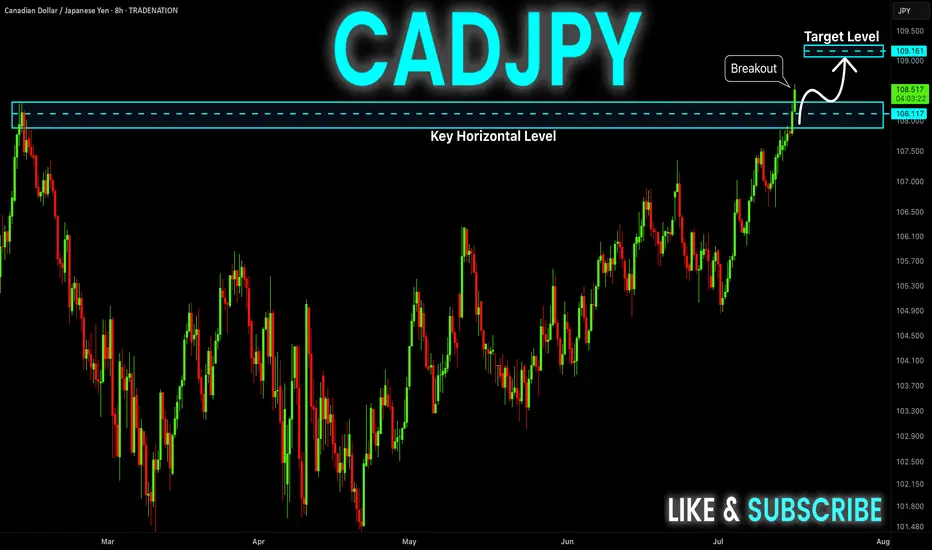
CAD-JPY Strong Bullish Breakout! Buy!
Hello,Traders!
CAD-JPY keeps trading in a
Strong uptrend and the pair
Made a strong bullish breakout
Of the key horizontal level
Of 108.299 so we are bullish
Biased and we will be expecting
A further bullish move up
Buy!
Comment and subscribe to help us grow!
Check out other forecasts below too!
Disclosure: I am part of Trade Nation's Influencer program and receive a monthly fee for using their TradingView charts in my analysis.
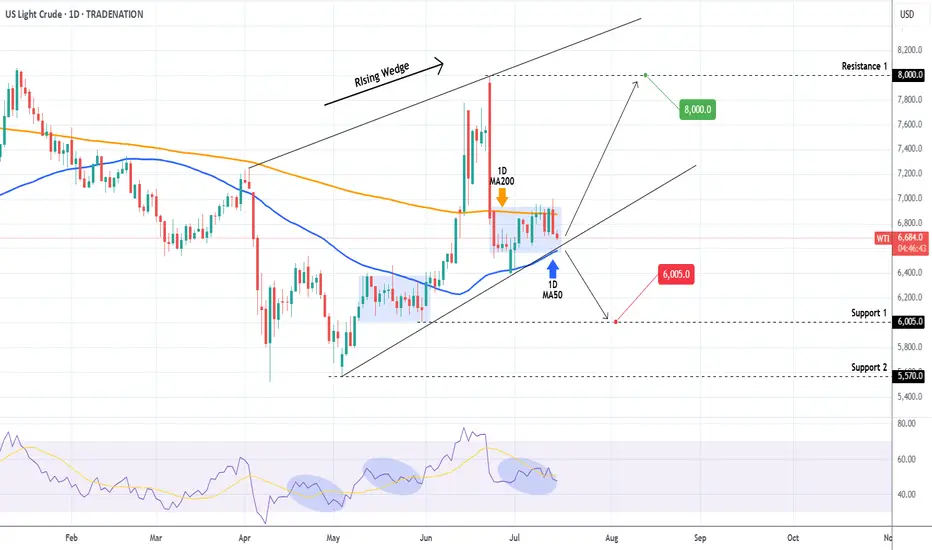
WTI OIL Is it forming a bottom?WTI Oil (USOIL) Has been trading within a Rising Wedge pattern and since June 02, it has turned its 1D MA50 as a Support. Technically the recent 2-week consolidation within the 1D MA50 (blue trend-line) and 1D MA200 (orange trend-line) is a bottom formation on the Higher Lows trend-line of the Rising Wedge.
As long as the 1D MA50 holds, we remain bullish, targeting $80.00 (Resistance 1). If the 1D MA50 breaks (closes a 1D candle below it), we will take the loss, and turn bearish instead, targeting $60.05 (Support 1).
-------------------------------------------------------------------------------
** Please LIKE 👍, FOLLOW ✅, SHARE 🙌 and COMMENT ✍ if you enjoy this idea! Also share your ideas and charts in the comments section below! This is best way to keep it relevant, support us, keep the content here free and allow the idea to reach as many people as possible. **
-------------------------------------------------------------------------------
Disclosure: I am part of Trade Nation's Influencer program and receive a monthly fee for using their TradingView charts in my analysis.
💸💸💸💸💸💸
👇 👇 👇 👇 👇 👇
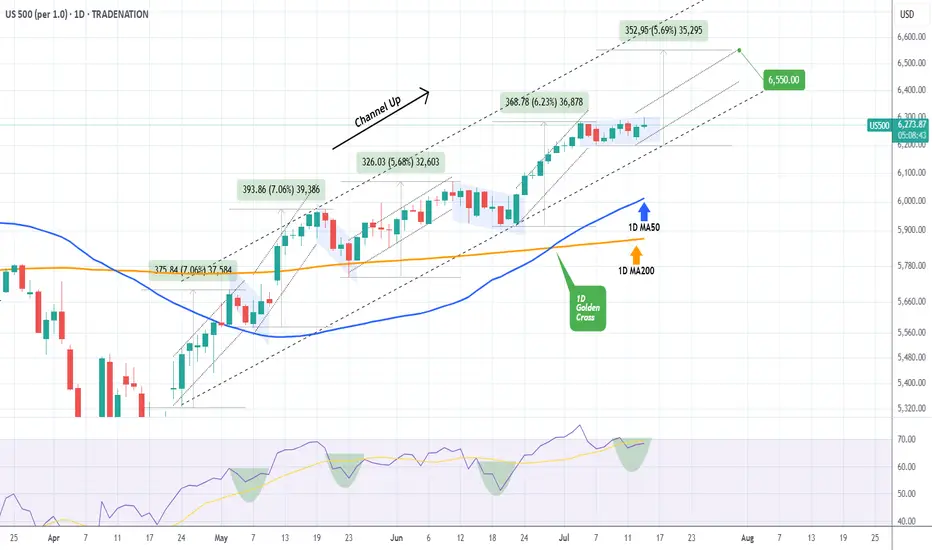
S&P500 Accumulation almost over. New rally begins.The S&P500 index (SPX) has been trading within a 3-month Channel Up pattern, within which, it's been replicating almost the same structure. This involves an aggressive Bullish Leg Phase (dotted Channel Up), followed by a correction/ Accumulation Phase (blue Channels), which eventually leads to the new Bullish Leg.
The 1D RSI fractals among those patterns are similar and right now it seems that we are about to complete the latest Accumulation Phase. Having completed a 1D Golden Cross 2 weeks ago, the time-frame looks more bullish than ever and as long as the 1D MA50 (blue trend-line) holds, we expect at least a +5.68% rise (the minimum of the previous Bullish Legs), targeting 6550.
-------------------------------------------------------------------------------
** Please LIKE 👍, FOLLOW ✅, SHARE 🙌 and COMMENT ✍ if you enjoy this idea! Also share your ideas and charts in the comments section below! This is best way to keep it relevant, support us, keep the content here free and allow the idea to reach as many people as possible. **
-------------------------------------------------------------------------------
Disclosure: I am part of Trade Nation's Influencer program and receive a monthly fee for using their TradingView charts in my analysis.
💸💸💸💸💸💸
👇 👇 👇 👇 👇 👇
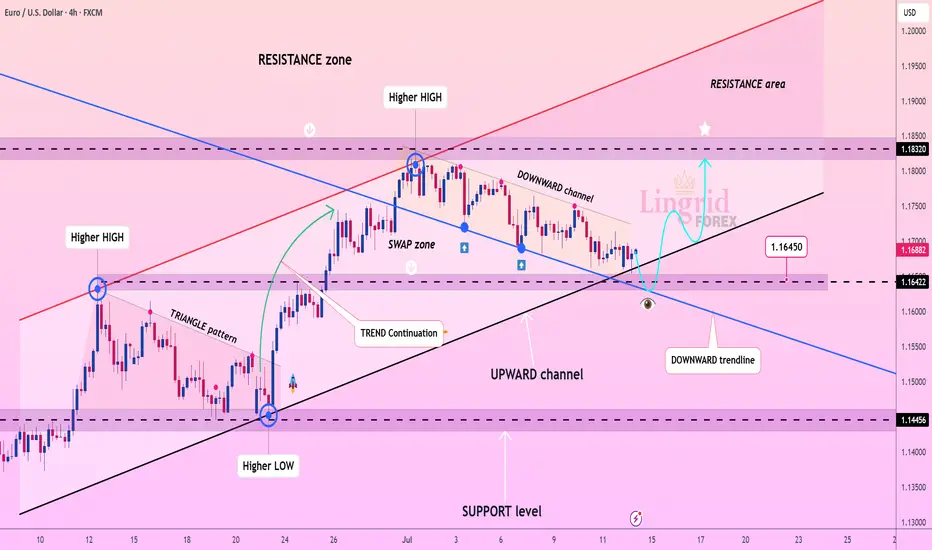
Lingrid | EURUSD Pulled Back to Key Support levelFX:EURUSD is approaching a major confluence zone at 1.16422 where the downward channel meets the upward trendline and horizontal support. The structure remains bullish with a sequence of higher highs and higher lows, and the current pullback fits within a healthy correction phase. A strong bounce from this triple-support region could trigger a reversal toward 1.18320, validating the continuation of the broader uptrend. All eyes are now on the 1.16450 reaction point for early momentum signs.
📉 Key Levels
Buy trigger: bullish reaction from 1.16422 support zone
Buy zone: 1.16200–1.16500 (channel base + trendline + demand)
Target: 1.18320
Invalidation: confirmed 4H close below 1.1600 breaks upward structure
💡 Risks
Deeper push below the trendline may trap early buyers
Low liquidity during the bounce can cause fakeouts
Unexpected USD strength could stall recovery momentum
If this idea resonates with you or you have your own opinion, traders, hit the comments. I’m excited to read your thoughts!
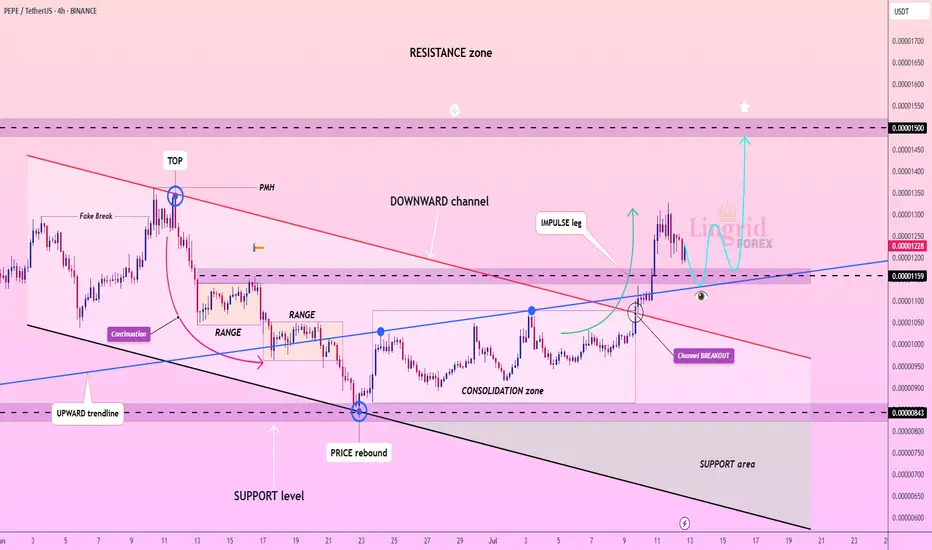
Lingrid | PEPEUSDT Corrective Channel BreakoutThe price perfectly fulfilled my previous idea . BINANCE:PEPEUSDT rebounded powerfully from the 0.00000843 support and broke out of the long-standing downward channel, marking the start of a bullish impulse leg. Price is now holding above the breakout point and consolidating above the 0.00001159 structure, setting the stage for continuation. As long as buyers defend this reclaimed level, price could attempt another leg toward the upper resistance zone at 0.00001500. Structure and volume suggest that accumulation is complete and bulls are in control.
📉 Key Levels
Buy trigger: sustained support above 0.00001159 and breakout follow-through
Buy zone: 0.00001100–0.00001159 (former resistance turned support)
Target: 0.00001500
Invalidation: breakdown below 0.00001100 risks trapping longs
💡 Risks
Volatility around breakout retests may shake weak hands
Failure to reclaim momentum at 0.00001250 could stall the push
Re-entry into the old consolidation range may delay upside momentum
If this idea resonates with you or you have your own opinion, traders, hit the comments. I’m excited to read your thoughts!
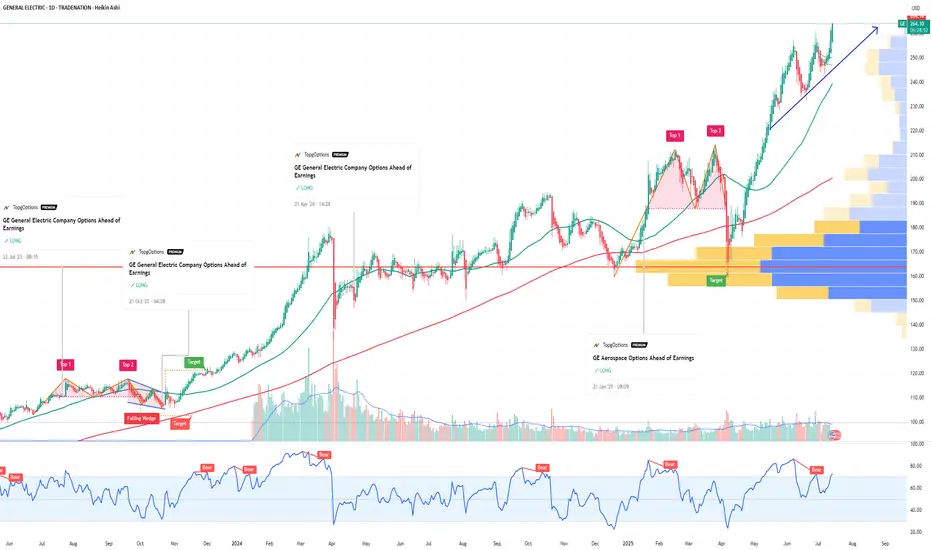
GE Aerospace Options Ahead of EarningsIf you haven`t bought GE before the rally:
Now analyzing the options chain and the chart patterns of GE Aerospace prior to the earnings report this week,
I would consider purchasing the 270usd strike price Calls with
an expiration date of 2025-8-15,
for a premium of approximately $8.60.
If these options prove to be profitable prior to the earnings release, I would sell at least half of them.
Disclosure: I am part of Trade Nation's Influencer program and receive a monthly fee for using their TradingView charts in my analysis.