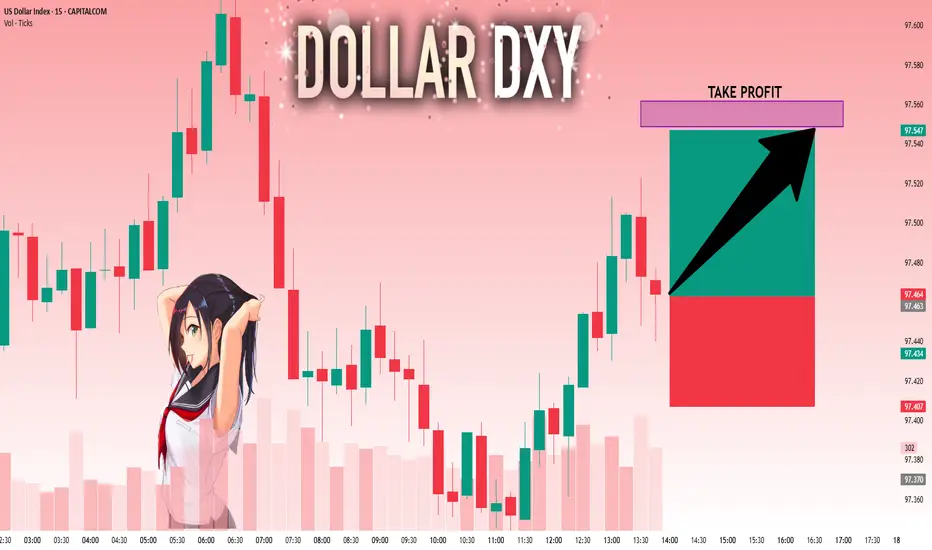
DXY: The Market Is Looking Up! Long!
My dear friends,
Today we will analyse DXY together☺️
The in-trend continuation seems likely as the current long-term trend appears to be strong, and price is holding above a key level of 97.463 So a bullish continuation seems plausible, targeting the next high. We should enter on confirmation, and place a stop-loss beyond the recent swing level.
❤️Sending you lots of Love and Hugs❤️
Signals
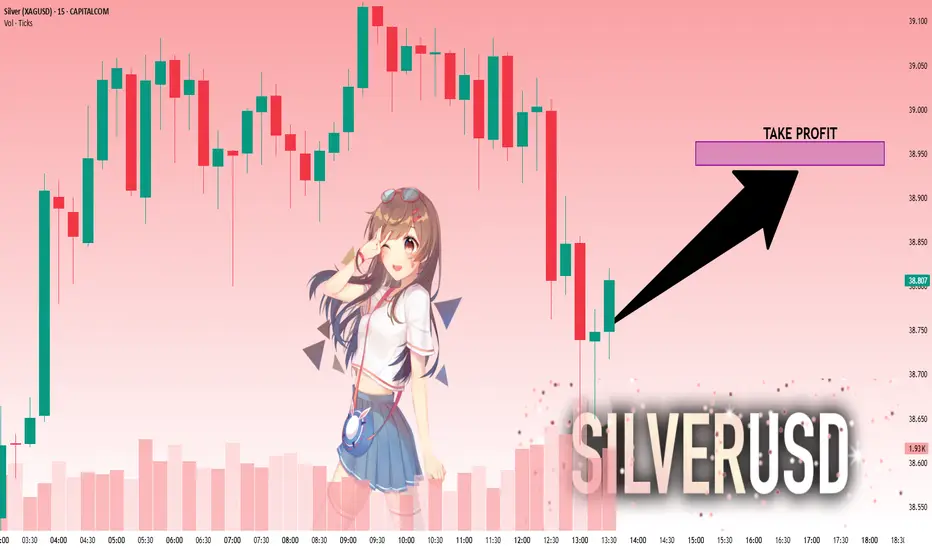
SILVER: Strong Bullish Sentiment! Long!
My dear friends,
Today we will analyse SILVER together☺️
The market is at an inflection zone and price has now reached an area around 38.768 where previous reversals or breakouts have occurred.And a price reaction that we are seeing on multiple timeframes here could signal the next move up so we can enter on confirmation, and target the next key level of 38.937.Stop-loss is recommended beyond the inflection zone.
❤️Sending you lots of Love and Hugs❤️
Trading balanceTrading balance The price of the asset has rebounded from the balance zone. With the prospect of growth into the resistance zone.
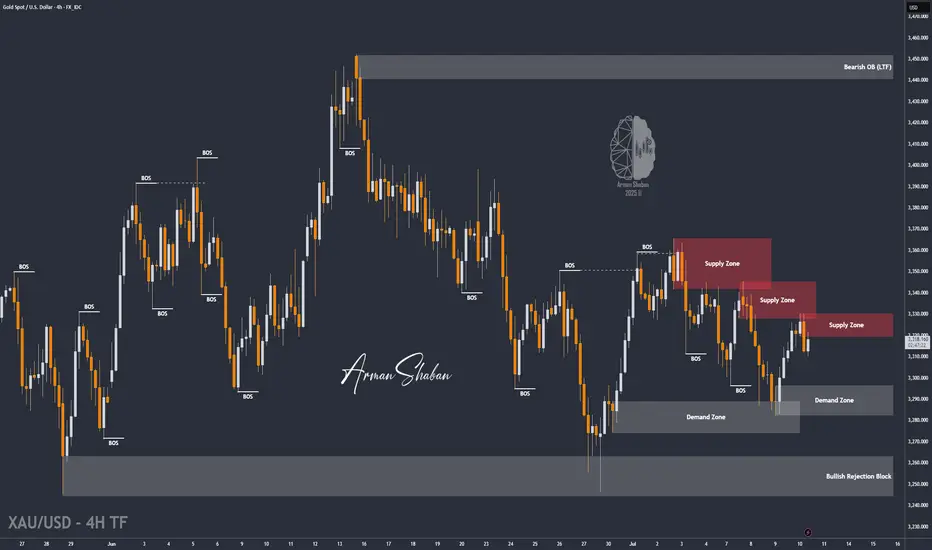
XAU/USD : Gold at a Turning Point – Rejection or Breakout Ahead?By analyzing the TVC:GOLD (XAUUSD) chart on the 4-hour timeframe, we can see that price climbed to $3330 today, entering a key supply zone, which triggered a pullback down to $3310. Gold is now trading around $3317, and I’m watching several potential setups closely.
Scenario 1:
If gold stabilizes below $3320, we could see a bearish move toward $3296.
Scenario 2:
If price breaks above the $3333 resistance, it may enter the next supply zone between $3341 and $3351, which could trigger a strong rejection—potentially offering a 100 to 400 pip move.
Now let’s break down the key levels to watch:
Supply zones: $3320, $3333, $3342, $3358
Demand zones: $3303, $3296, $3289, $3278
Monitor how price reacts to each of these zones — they may provide excellent opportunities.
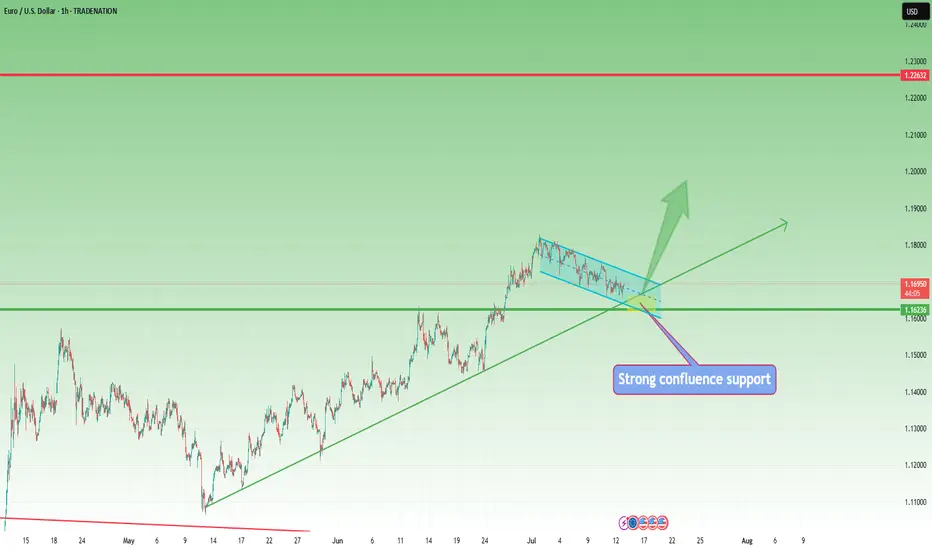
EUR/USD –Bullish Flag After Long Term Trend Shift: Is 1.20 Next?📌 In my previous EUR/USD analysis, I mentioned that the long-term trend likely reversed, and we could see a move toward the 1.23 zone in the medium to longer term.
That view is playing out.
Recently, the pair printed a new local high above 1.18, confirming the trend change.
📉 After this rise, EUR/USD pulled back –but the structure is clearly corrective: overlapping and a classic bullish flag formation.
What's next?
This correction looks close to completion, and bulls may soon return to push toward the key 1.20 level.
Trading Plan:
The 1.1620–1.1650 area stands out as a strong confluence zone – ideal for looking for buying opportunities.
The trend has changed. The setup is forming. Now it’s about timing.
Disclosure: I am part of TradeNation's Influencer program and receive a monthly fee for using their TradingView charts in my analyses and educational articles.
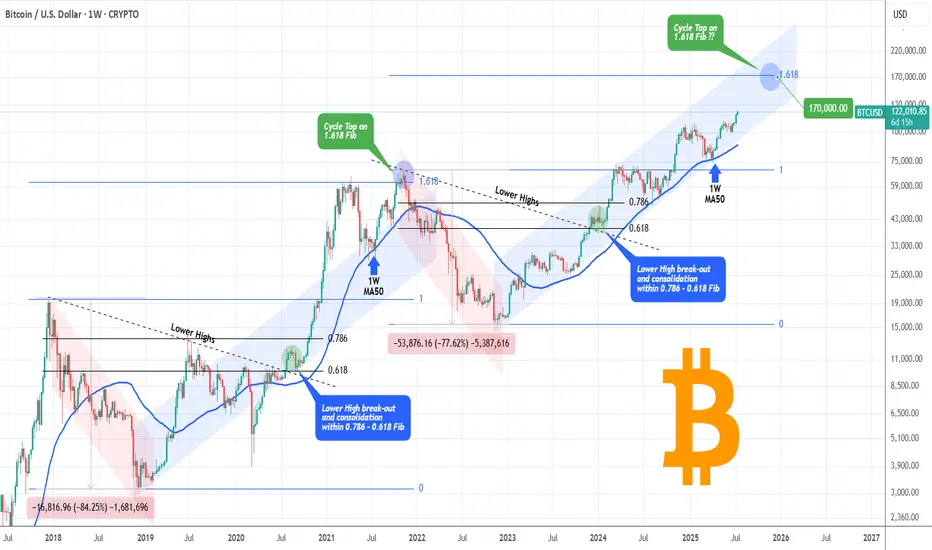
BITCOIN High after High going for the Cycle Top!Bitcoin (BTCUSD) made a new All Time High (ATH) today, just north of $123000 and shows absolutely no signs of stopping there!
The brilliantly structured 2.5-year Channel Up (blue) that has been dominating the entirety of the current Bull Cycle since the November 2022 market bottom, has been on its latest Bullish Leg since the April 07 2025 rebound on the 1W MA50 (blue trend-line).
The 1W MA50 has been the Cycle's natural Support level since the March 13 2023 bullish break-out, never broken after, just like it has been for the 2019 - 2021 Bull Cycle (excluding of course the Black Swan event of the March 2020 COVID crash).
In fact the similarities of the whole 2022 - 2025 Cycle are strong with the 2018 - 2021 Cycle. Similar Bear Cycles of -80% on average, followed by strong Lower Highs break-outs and subsequent consolidations within the 0.786 - 0.618 Fibonacci range, takes us to today with the April 2025 1W MA50 bounce resembling the July 2021 one.
Eventually, that Bullish Leg led to the Cycle's Top a little above the 1.618 Fibonacci extension. The market seems to be only one step away of completing that past pattern and if it does, BTC may hit $170000 before the Cycle peaks.
Do you think that is a likely scenario after today's new fresh ATH? Feel free to let us know in the comments section below!
-------------------------------------------------------------------------------
** Please LIKE 👍, FOLLOW ✅, SHARE 🙌 and COMMENT ✍ if you enjoy this idea! Also share your ideas and charts in the comments section below! This is best way to keep it relevant, support us, keep the content here free and allow the idea to reach as many people as possible. **
-------------------------------------------------------------------------------
💸💸💸💸💸💸
👇 👇 👇 👇 👇 👇
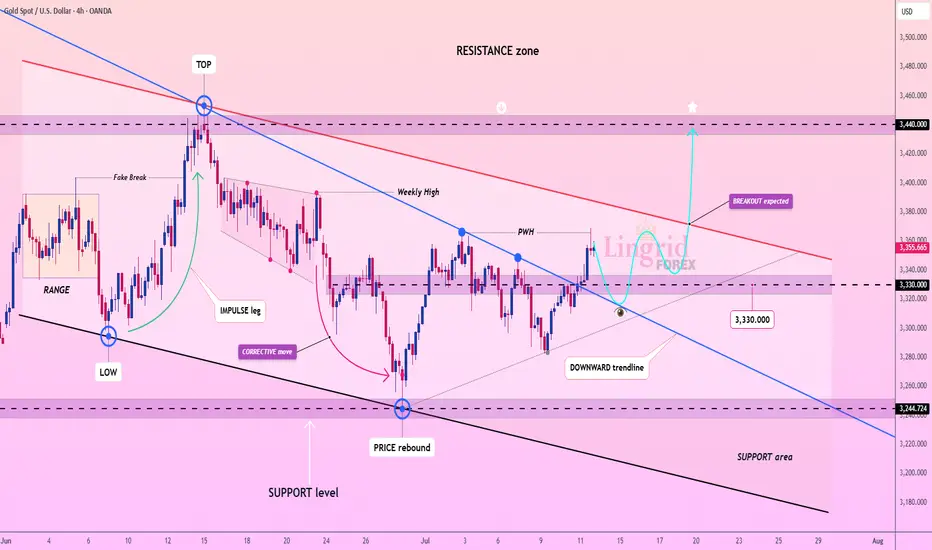
Lingrid | GOLD Weekly Market AnalysisOANDA:XAUUSD markets are navigating through a technical consolidation phase following the recent rally, maintaining underlying bullish momentum despite current volatility. The precious metal is trading between critical levels that will determine the next major directional move.
4H chart reveals a complex structure with a retest of the resistance zone around $3,440, gold has initiated a corrective move along the descending channel. The current setup suggests a healthy pullback toward the support zone near $3,330. Breaking above the downward trendline will constitute an important technical signal for bullish continuation.
The higher timeframe provides a broader perspective with an A-B pattern currently forming. Equal tests at resistance levels indicate significant institutional accumulation. The rising trendline (HL) continues to support prices, confirming the long-term bullish structure. The target zone above $3,600 remains viable if gold can successfully break through the current resistance cluster.
Key levels to monitor include the $3,330 support and $3,440 resistance. A decisive break above previous week high could trigger the next leg toward $3,400-$3,450, while failure to hold support might see a deeper correction toward $3,250. The overall technical picture suggests this consolidation represents a continuation pattern within the broader uptrend. If this idea resonates with you or you have your own opinion, traders, hit the comments. I’m excited to read your thoughts!
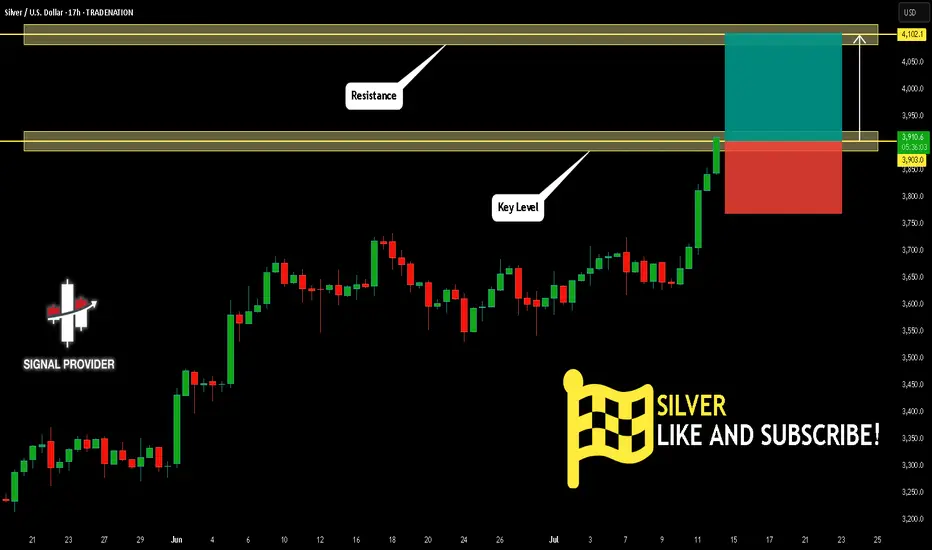
SILVER Will Go Up From Support! Buy!
Please, check our technical outlook for SILVER.
Time Frame: 17h
Current Trend: Bullish
Sentiment: Oversold (based on 7-period RSI)
Forecast: Bullish
The market is approaching a key horizontal level 3,903.0.
Considering the today's price action, probabilities will be high to see a movement to 4,102.1.
P.S
Overbought describes a period of time where there has been a significant and consistent upward move in price over a period of time without much pullback.
Disclosure: I am part of Trade Nation's Influencer program and receive a monthly fee for using their TradingView charts in my analysis.
Like and subscribe and comment my ideas if you enjoy them!
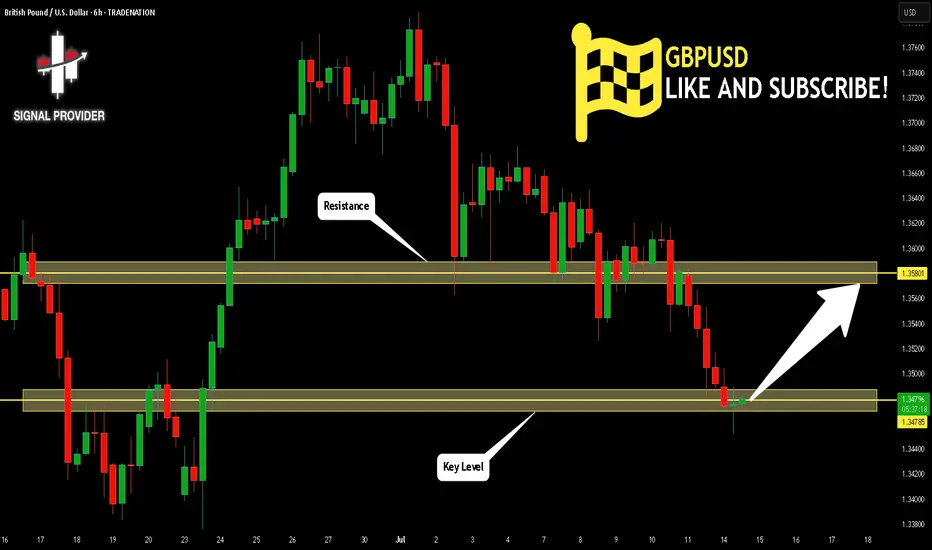
GBPUSD Will Go Up! Long!
Take a look at our analysis for GBPUSD.
Time Frame: 6h
Current Trend: Bullish
Sentiment: Oversold (based on 7-period RSI)
Forecast: Bullish
The market is on a crucial zone of demand 1.347.
The oversold market condition in a combination with key structure gives us a relatively strong bullish signal with goal 1.358 level.
P.S
The term oversold refers to a condition where an asset has traded lower in price and has the potential for a price bounce.
Overbought refers to market scenarios where the instrument is traded considerably higher than its fair value. Overvaluation is caused by market sentiments when there is positive news.
Disclosure: I am part of Trade Nation's Influencer program and receive a monthly fee for using their TradingView charts in my analysis.
Like and subscribe and comment my ideas if you enjoy them!
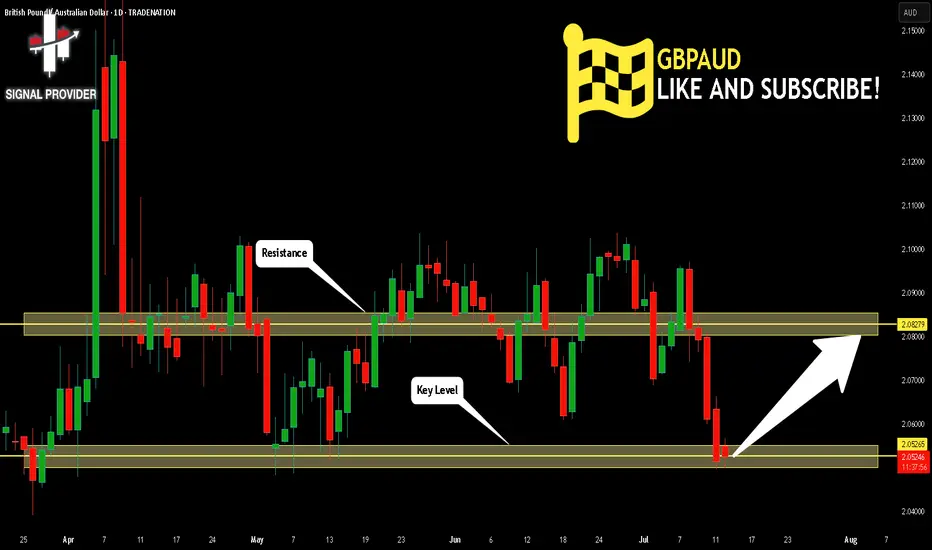
GBPAUD Will Move Higher! Buy!
Please, check our technical outlook for GBPAUD.
Time Frame: 1D
Current Trend: Bullish
Sentiment: Oversold (based on 7-period RSI)
Forecast: Bullish
The price is testing a key support 2.052.
Current market trend & oversold RSI makes me think that buyers will push the price. I will anticipate a bullish movement at least to 2.082 level.
P.S
We determine oversold/overbought condition with RSI indicator.
When it drops below 30 - the market is considered to be oversold.
When it bounces above 70 - the market is considered to be overbought.
Disclosure: I am part of Trade Nation's Influencer program and receive a monthly fee for using their TradingView charts in my analysis.
Like and subscribe and comment my ideas if you enjoy them!
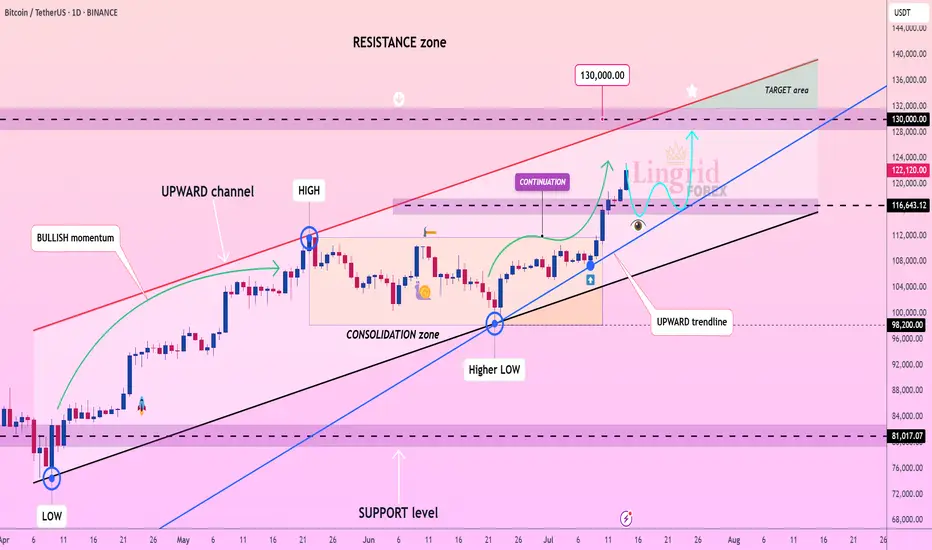
Lingrid | BTCUSDT strong Bullish Trend Continues The price perfectly fulfilled my last idea . BINANCE:BTCUSDT CRYPTOCAP:BTC broke out of a long consolidation range and confirmed a higher low at 98,200, initiating a new impulsive rally inside the upward channel. The price is now trading well above the 116,643 breakout level and holding near the mid-range of the next resistance zone. As long as the bullish structure holds, price is expected to target the upper resistance band near 130,000 in the coming sessions. Momentum and structure remain in favor of the bulls, supported by trendline and volume strength.
📉 Key Levels
Buy trigger: breakout and sustained move above 116,643
Buy zone: 116,643–120,000 (retest of structure and upper trendline)
Target: 130,000
Invalidation: drop below 116,000 breaks upward trend bias
💡 Risks
False breakouts around resistance zone may delay continuation
Macro uncertainty or ETF-related news can shift sentiment
Failure to hold above 116,643 would expose the trend to deeper correction
If this idea resonates with you or you have your own opinion, traders, hit the comments. I’m excited to read your thoughts!
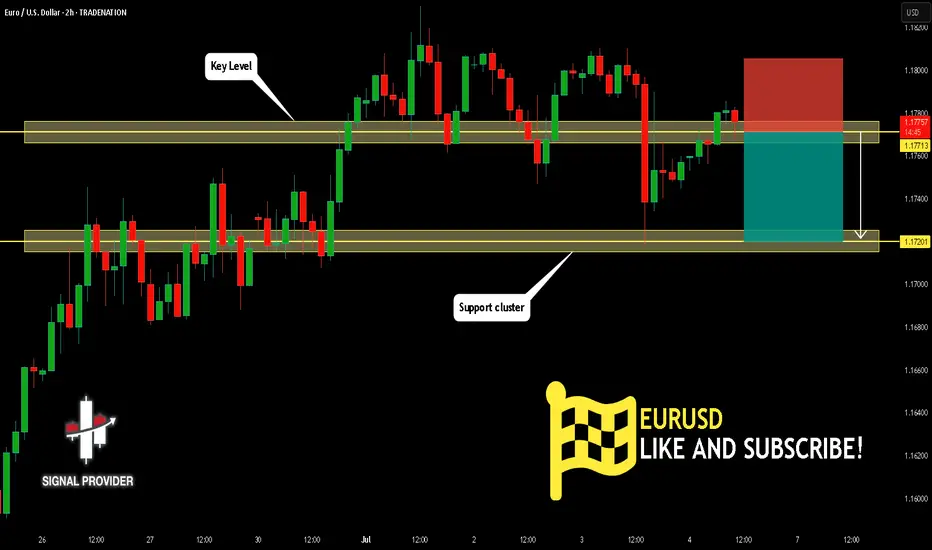
EURUSD Will Go Down From Resistance! Short!
Here is our detailed technical review for EURUSD.
Time Frame: 2h
Current Trend: Bearish
Sentiment: Overbought (based on 7-period RSI)
Forecast: Bearish
The market is trading around a solid horizontal structure 1.177.
The above observations make me that the market will inevitably achieve 1.172 level.
P.S
We determine oversold/overbought condition with RSI indicator.
When it drops below 30 - the market is considered to be oversold.
When it bounces above 70 - the market is considered to be overbought.
Disclosure: I am part of Trade Nation's Influencer program and receive a monthly fee for using their TradingView charts in my analysis.
Like and subscribe and comment my ideas if you enjoy them!
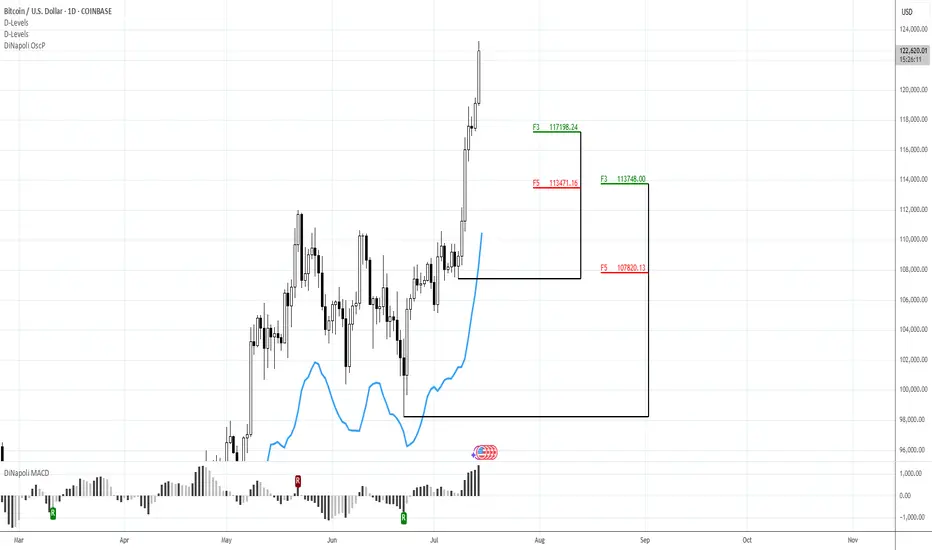
127KMorning folks,
So, BTC shows even better performance that we thought, although it obviously something stands behind, this is not market-natural motion. Anyway, we consider 127K level as all-time nearest target that stands on monthly chart.
If any pullback starts (BTC now is at daily overbought and near Yearly Resistance Pivot), we keep an eye on 117.2K and 113.5K levels to decide on long entry
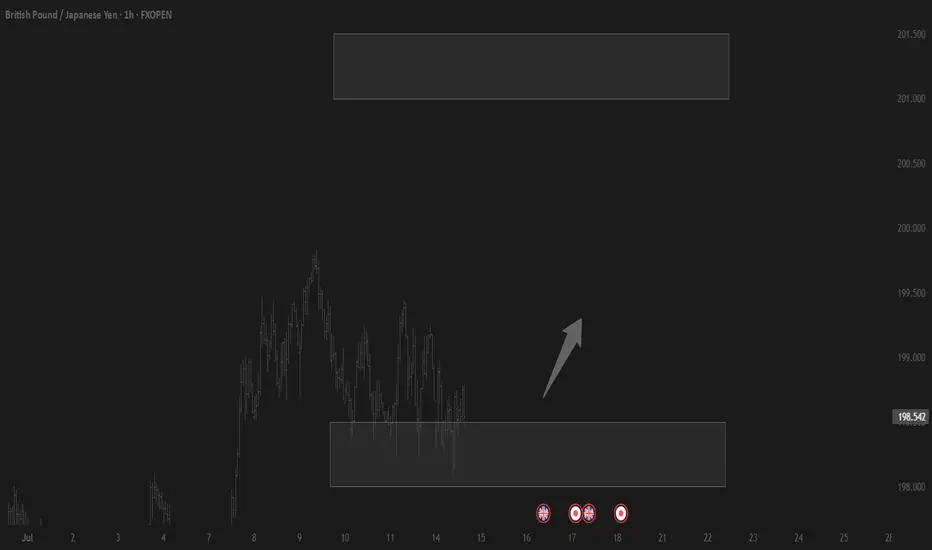
EUR/JPY BEST PLACE TO SELL FROM|SHORT
Hello, Friends!
EUR/JPY pair is trading in a local uptrend which we know by looking at the previous 1W candle which is green. On the 2H timeframe the pair is going up too. The pair is overbought because the price is close to the upper band of the BB indicator. So we are looking to sell the pair with the upper BB line acting as resistance. The next target is 171.514 area.
Disclosure: I am part of Trade Nation's Influencer program and receive a monthly fee for using their TradingView charts in my analysis.
✅LIKE AND COMMENT MY IDEAS✅

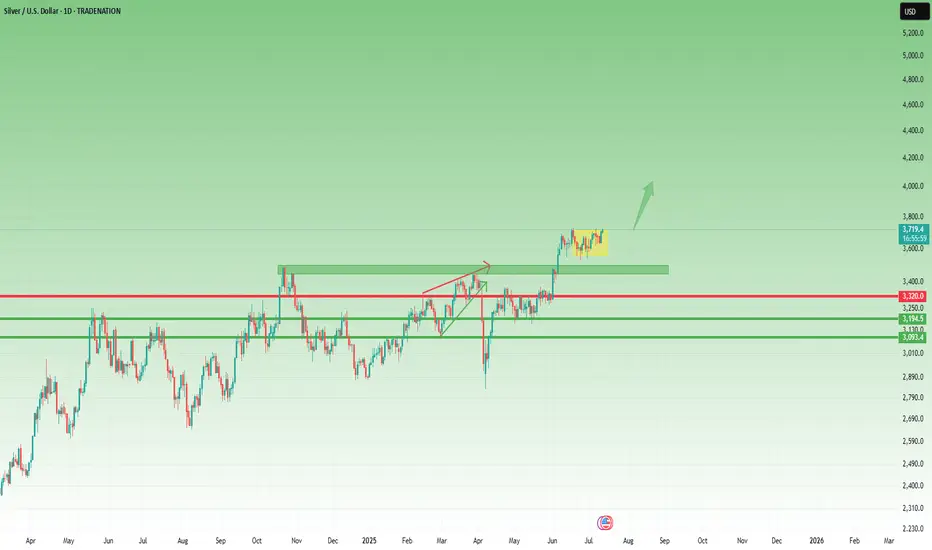
Silver Analysis – Strong Bulls and a Clean Setup AheadLast month, Silver printed a new multi-decade high, a major technical milestone.
Since then, price has entered a sideways consolidation, forming a rectangle — but what stands out is this:
👉 Silver bulls have absorbed every dip, even when Gold dropped.
That’s strength. And strength usually precedes breakout.
🔍 Current Situation
At the time of writing, price is trading around 37.20,
and from the current structure, it looks like nothing is standing in the way of an upside break.
We don’t predict — we prepare...
And this chart looks ready.
🎯 Next Target: 40.00 USD?
A push to 40.00 looks like the next “normal” target.
But don’t forget: that’s a 3,000 pip move.
This type of move will require patience
Plan your trade.
Respect your risk.
Let the bulls work. 🚀
Disclosure: I am part of TradeNation's Influencer program and receive a monthly fee for using their TradingView charts in my analyses and educational articles.
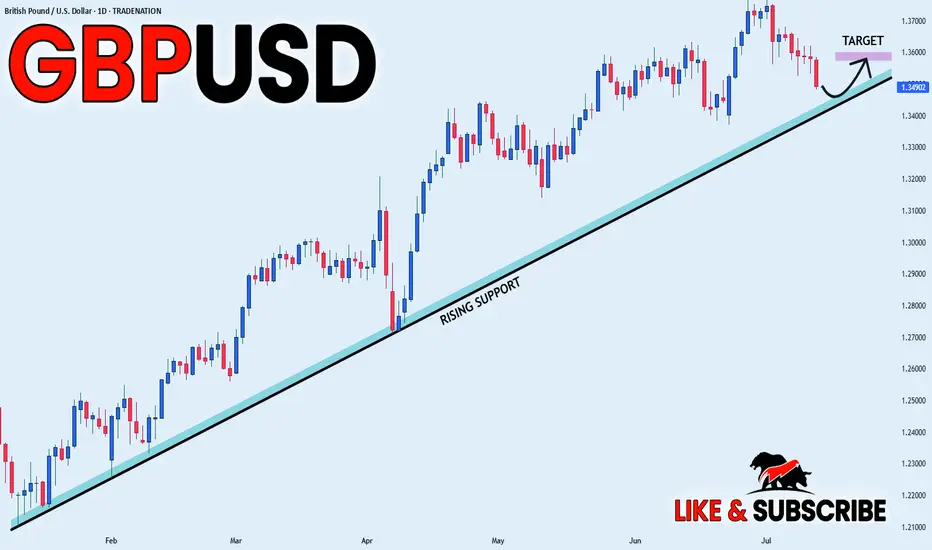
GBP_USD RISING SUPPORT AHEAD|LONG|
✅GBP_USD is going down now
But a strong rising support level is ahead
Thus I am expecting a rebound
And a move up towards the target of 1.3600
LONG🚀
✅Like and subscribe to never miss a new idea!✅
Disclosure: I am part of Trade Nation's Influencer program and receive a monthly fee for using their TradingView charts in my analysis.
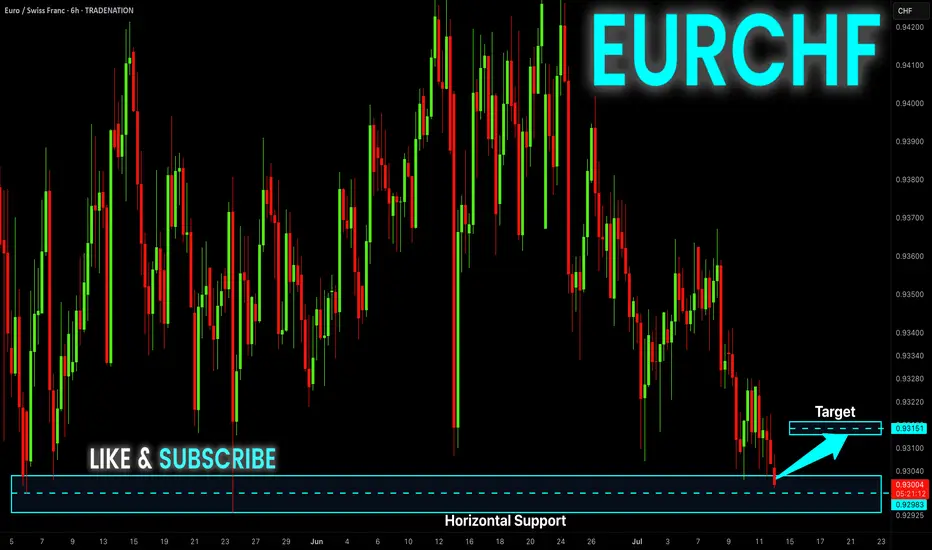
EUR-CHF Local Long! Buy!
Hello,Traders!
EUR-CHF is about to retest
The strong horizontal support
Of 0.9298 and as the pair
Is locally oversold we will be
Expecting a local bullish
Rebound and a move up
Buy!
Comment and subscribe to help us grow!
Check out other forecasts below too!
Disclosure: I am part of Trade Nation's Influencer program and receive a monthly fee for using their TradingView charts in my analysis.
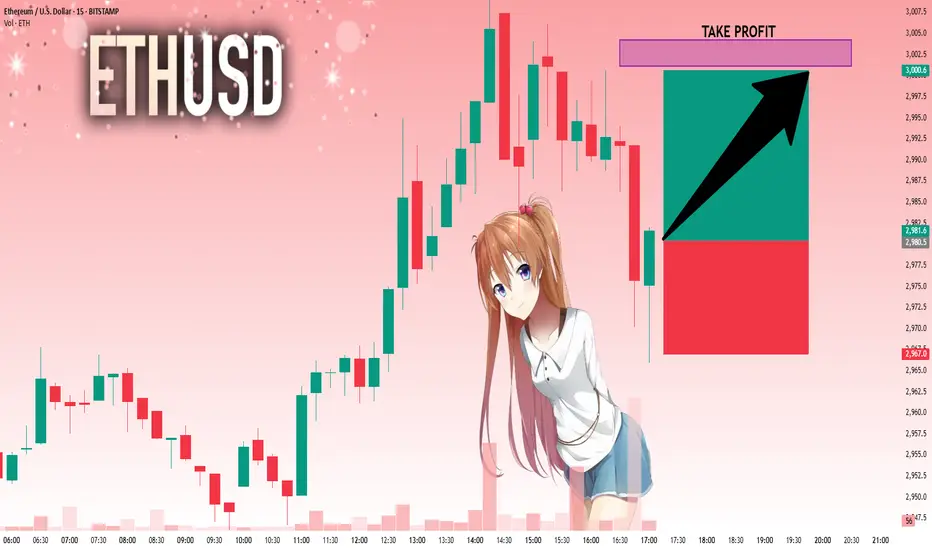
ETHUSD: Bulls Are Winning! Long!
My dear friends,
Today we will analyse ETHUSD together☺️
The price is near a wide key level
and the pair is approaching a significant decision level of 2,980.5 Therefore, a strong bullish reaction here could determine the next move up.We will watch for a confirmation candle, and then target the next key level of 3,001.1.Recommend Stop-loss is beyond the current level.
❤️Sending you lots of Love and Hugs❤️
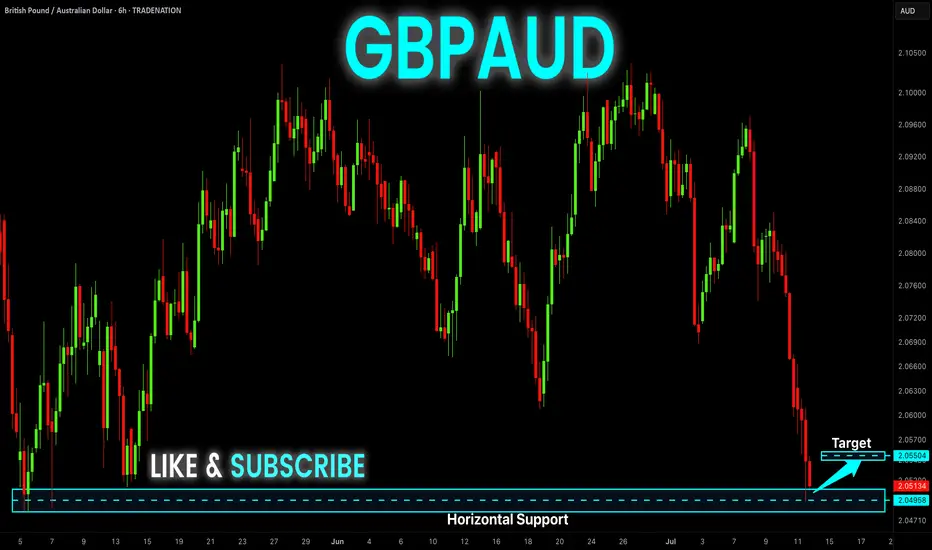
GBP-AUD Risky Long! Buy!
Hello,Traders!
GBP-AUD keeps falling and
The pair is locally oversold
So as the pair is retesting
The horizontal support
Of 2.0480 we will be expecting
A local bullish correction
On Monday
Buy!
Comment and subscribe to help us grow!
Check out other forecasts below too!
Disclosure: I am part of Trade Nation's Influencer program and receive a monthly fee for using their TradingView charts in my analysis.
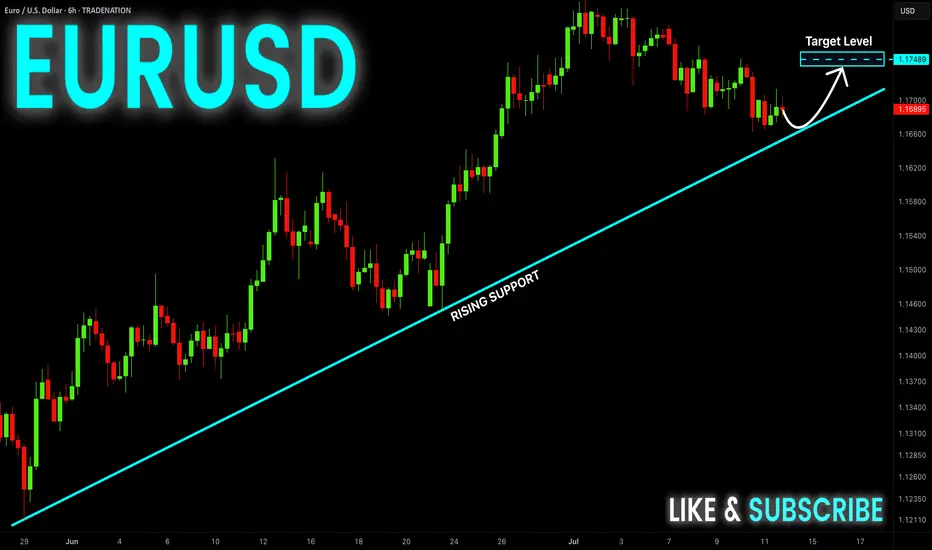
EUR-USD Will Keep Growing! Buy!
Hello,Traders!
EUR-USD keep trading in
An uptrend along the rising support
So as the pair is approaching
A the support we will be
Expecting a bullish rebound
And a move up on Monday
Buy!
Comment and subscribe to help us grow!
Check out other forecasts below too!
Disclosure: I am part of Trade Nation's Influencer program and receive a monthly fee for using their TradingView charts in my analysis.
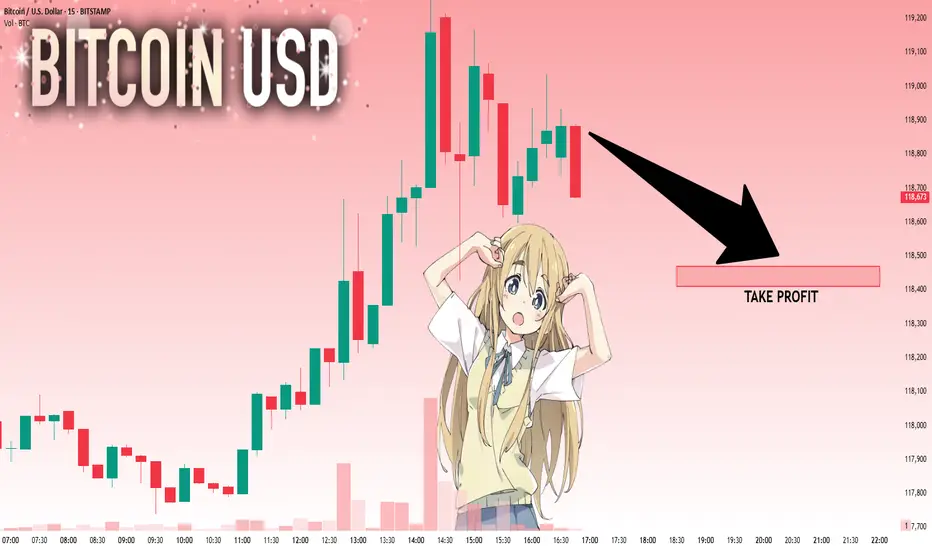
BTCUSD: Next Move Is Down! Short!
My dear friends,
Today we will analyse BTCUSD together☺️
The recent price action suggests a shift in mid-term momentum. A break below the current local range around 118.878 will confirm the new direction downwards with the target being the next key level of 118.470.and a reconvened placement of a stop-loss beyond the range.
❤️Sending you lots of Love and Hugs❤️
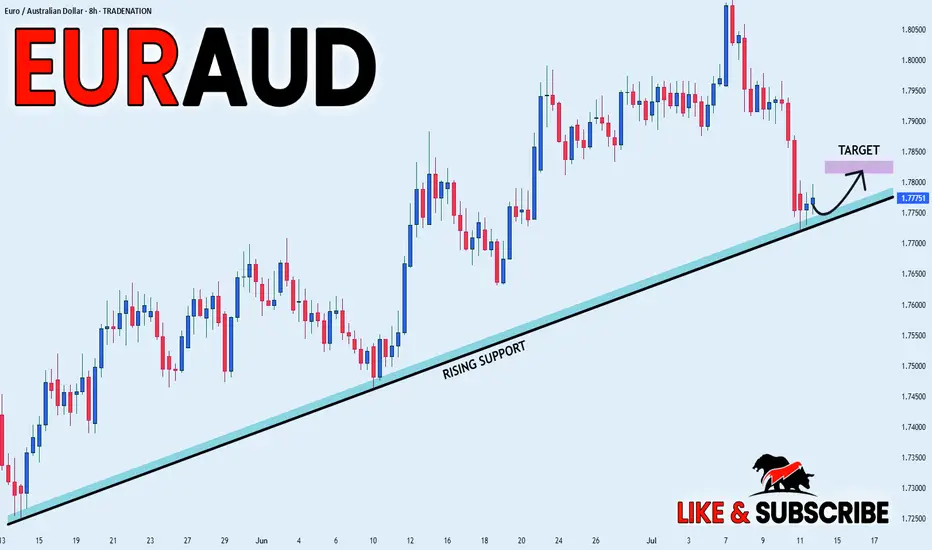
EUR_AUD WILL GO UP|LONG|
✅EUR_AUD is trading in an uptrend
And the bullish bias is confirmed
By the rebound we are seeing
After the pair retested the support
So I think the growth will continue
LONG🚀
✅Like and subscribe to never miss a new idea!✅
Disclosure: I am part of Trade Nation's Influencer program and receive a monthly fee for using their TradingView charts in my analysis.
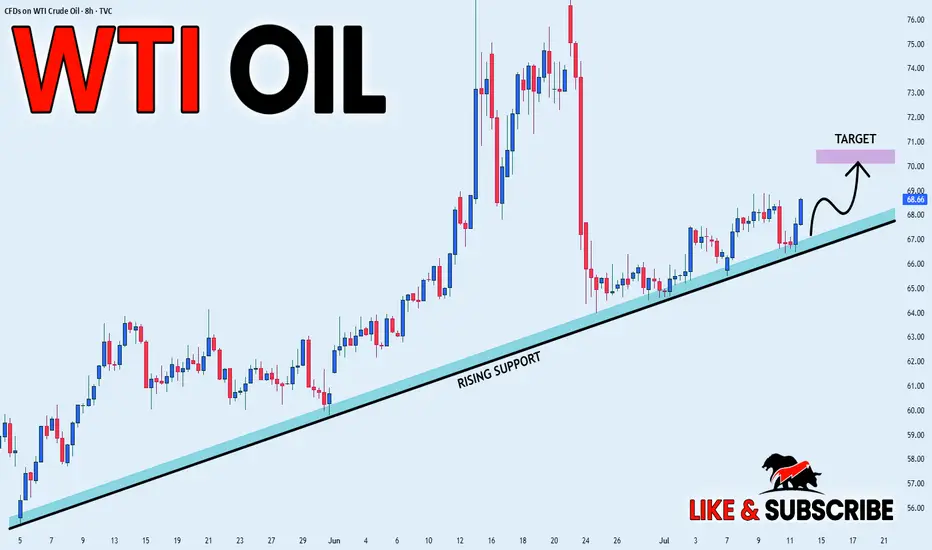
USOIL RISKY LONG|
✅CRUDE OIL is trading along
The rising support line
And as the price is going up now
After the retest of the line
I am expecting the price to keep growing
To retest the supply levels above at 70.20$
LONG🚀
✅Like and subscribe to never miss a new idea!✅
Disclosure: I am part of Trade Nation's Influencer program and receive a monthly fee for using their TradingView charts in my analysis.