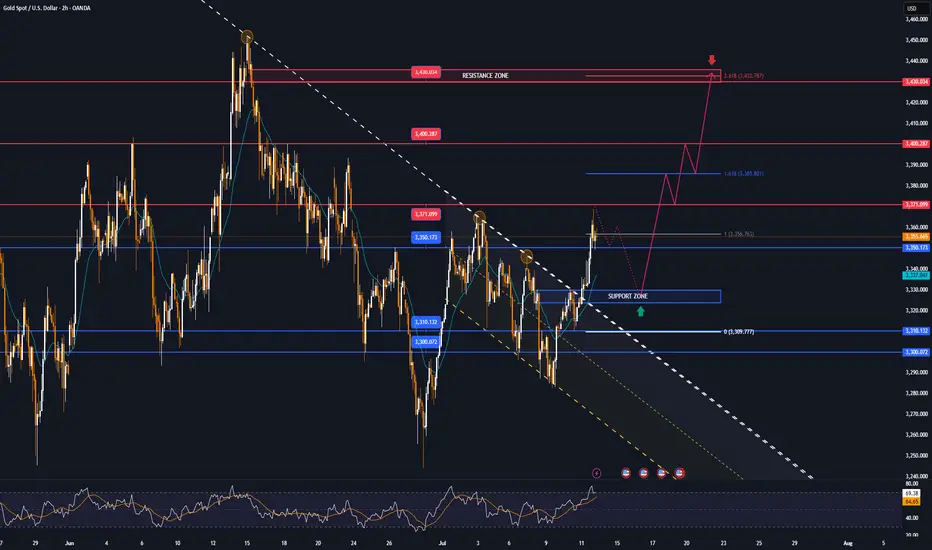
GOLD MARKET ANALYSIS AND COMMENTARY - [Jul 14 - Jul 18]This week, OANDA:XAUUSD opened at $3,342/oz, dropped to $3,282/oz, but then rebounded sharply to close at $3,355/oz. The recovery was mainly driven by former President Trump's announcement of new tariffs ranging from 20% to 50% on imports from 22 countries, effective August 1st. Particularly, a 35% tariff on Canadian goods — a key U.S. trading partner — raised concerns about global trade stability and supply chains.
Trump also proposed 15–20% tariffs on most other trading partners, reigniting fears of global trade disruptions. At the same time, ongoing conflict between Israel and Hamas continued to weigh on sentiment, despite U.S. diplomatic efforts showing little progress.
However, analysts note that gold still lacks strong momentum for a breakout. Trump's tariff threats may be more about negotiation leverage than triggering a full-blown trade war. Meanwhile, with the labor market recovering and inflation rising, the Fed is expected to maintain its neutral monetary policy, limiting short-term gold price movements.
Although geopolitical tensions remain (e.g., Russia-Ukraine, Israel-Hamas), the ceasefire between Israel and Iran has reduced gold’s geopolitical risk premium.
Looking ahead, key U.S. economic data next week — including CPI, PPI, and retail sales — will be closely watched. A strong June core CPI (0.4% or higher) could reduce the likelihood of a Fed rate cut in September, strengthening the USD and pushing gold lower. Conversely, weaker inflation data could boost expectations of a rate cut, supporting gold prices.
📌In terms of technical analysis, gold prices next week may continue to adjust and accumulate. Accordingly, if they surpass the 3,370 USD/oz mark, gold prices next week will challenge the 3,400-3,450 USD/oz range. On the contrary, gold prices next week will adjust down to 3,285 USD/oz, or even 3,245 USD/oz.
Notable technical levels are listed below.
Support: 3,350 – 3,310 – 3,300USD
Resistance: 3,371 – 3,400 – 3,430USD
SELL XAUUSD PRICE 3435 - 3433⚡️
↠↠ Stop Loss 3439
BUY XAUUSD PRICE 3329 - 3331⚡️
↠↠ Stop Loss 3326
Signals
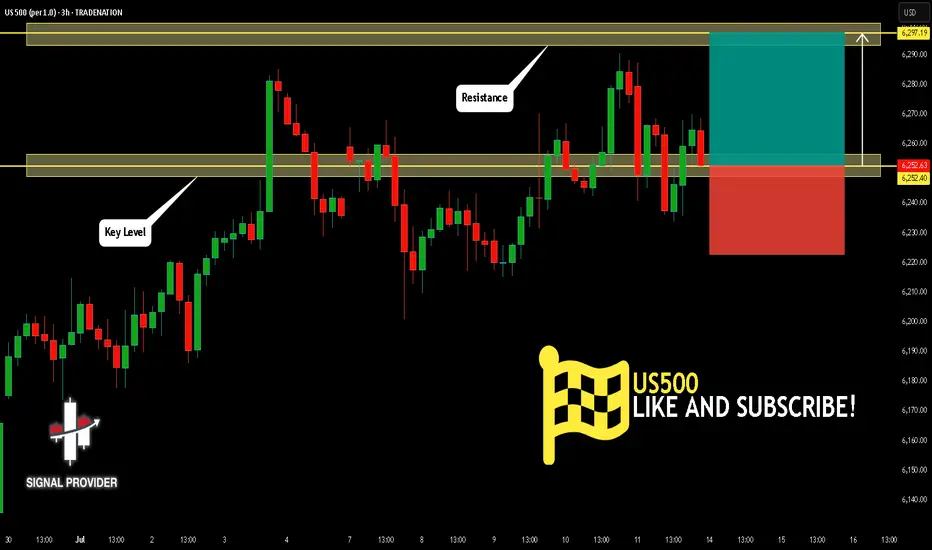
US500 Is Bullish! Long!
Here is our detailed technical review for US500.
Time Frame: 3h
Current Trend: Bullish
Sentiment: Oversold (based on 7-period RSI)
Forecast: Bullish
The market is trading around a solid horizontal structure 6,252.40.
The above observations make me that the market will inevitably achieve 6,297.19 level.
P.S
Overbought describes a period of time where there has been a significant and consistent upward move in price over a period of time without much pullback.
Disclosure: I am part of Trade Nation's Influencer program and receive a monthly fee for using their TradingView charts in my analysis.
Like and subscribe and comment my ideas if you enjoy them!
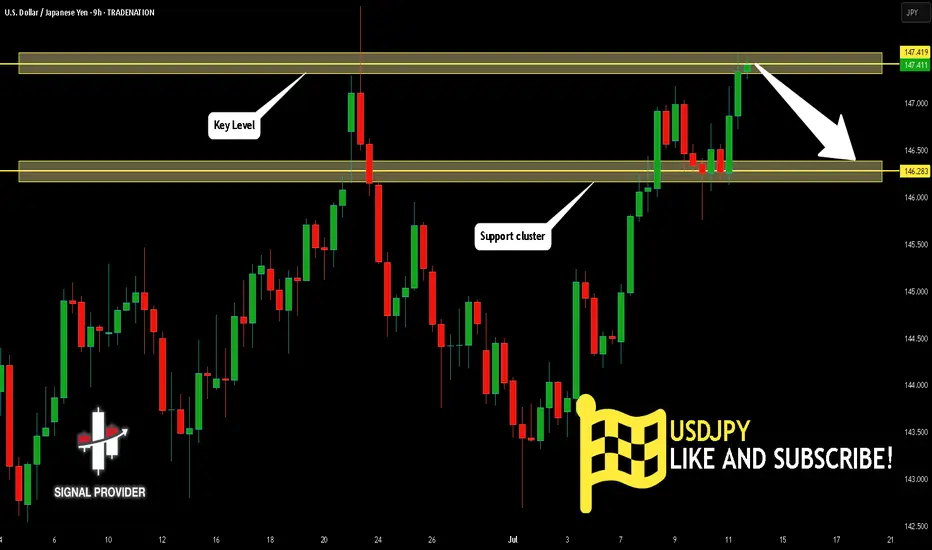
USDJPY Is Very Bearish! Short!
Take a look at our analysis for USDJPY.
Time Frame: 9h
Current Trend: Bearish
Sentiment: Overbought (based on 7-period RSI)
Forecast: Bearish
The market is testing a major horizontal structure 147.419.
Taking into consideration the structure & trend analysis, I believe that the market will reach 146.283 level soon.
P.S
Please, note that an oversold/overbought condition can last for a long time, and therefore being oversold/overbought doesn't mean a price rally will come soon, or at all.
Disclosure: I am part of Trade Nation's Influencer program and receive a monthly fee for using their TradingView charts in my analysis.
Like and subscribe and comment my ideas if you enjoy them!
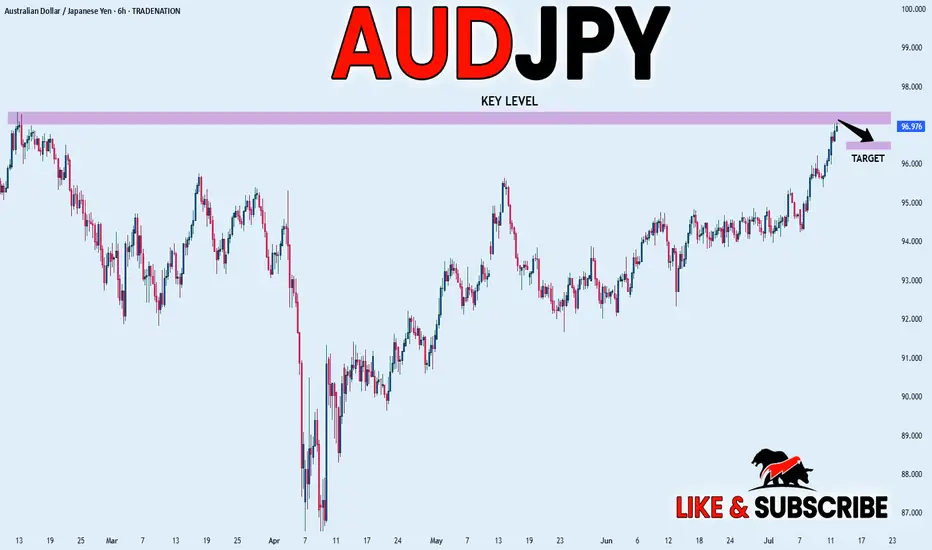
AUD_JPY IS OVERBOUGHT|SHORT|
✅AUD_JPY is trading in a strong
Uptrend but the pair is now
Locally overbought so after the
Pair hits the horizontal resistance
Level of 97.350 we will be expecting
A pullback and a bearish correction
On Monday!
SHORT🔥
✅Like and subscribe to never miss a new idea!✅
Disclosure: I am part of Trade Nation's Influencer program and receive a monthly fee for using their TradingView charts in my analysis.
GBP-CHF Bearish Breakout! Sell!
Hello,Traders!
GBP-CHF is trading in a strong
Downtrend and the pair
Broke the key horizontal
Level around 1.0780 which
Reinforces our bearish
Bias and we will be
Expecting a further
Bearish move down
On Monday!
Sell!
Comment and subscribe to help us grow!
Check out other forecasts below too!
Disclosure: I am part of Trade Nation's Influencer program and receive a monthly fee for using their TradingView charts in my analysis.

EUR_CAD GROWTH AHEAD|LONG|
✅EUR_CAD went down to retest
A horizontal support of 1.5964
Which makes me locally bullish biased
And I think that a move up
From the level is to be expected
Towards the target above at 1.6040
LONG🚀
✅Like and subscribe to never miss a new idea!✅
Disclosure: I am part of Trade Nation's Influencer program and receive a monthly fee for using their TradingView charts in my analysis.

EUR-AUD Bullish Bias! Buy!
Hello,Traders!
EUR-AUD went down but
A strong horizontal support
Level is below around 1.7690
And as the pair is trading in
An uptrend we will be expecting
A round and a move up
On Monday!
Buy!
Comment and subscribe to help us grow!
Check out other forecasts below too!
Disclosure: I am part of Trade Nation's Influencer program and receive a monthly fee for using their TradingView charts in my analysis.

USOIL: Local Bearish Bias! Short!
My dear friends,
Today we will analyse USOIL together☺️
The market is at an inflection zone and price has now reached an area around 68.669 where previous reversals or breakouts have occurred.And a price reaction that we are seeing on multiple timeframes here could signal the next move down so we can enter on confirmation, and target the next key level of 67.925..Stop-loss is recommended beyond the inflection zone.
❤️Sending you lots of Love and Hugs❤️

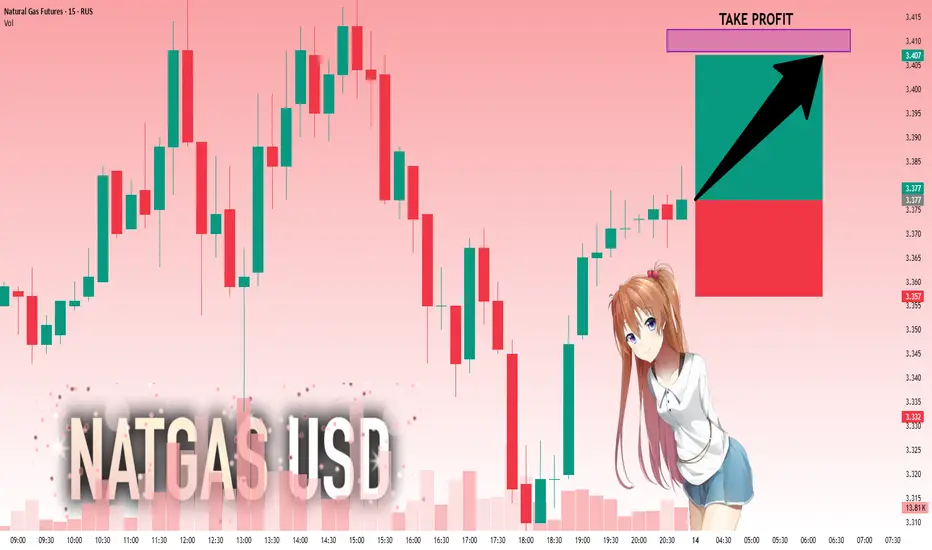
NG1!: Strong Growth Ahead! Long!
My dear friends,
Today we will analyse NG1! together☺️
The price is near a wide key level
and the pair is approaching a significant decision level of 3.377 Therefore, a strong bullish reaction here could determine the next move up.We will watch for a confirmation candle, and then target the next key level of 3.408.Recommend Stop-loss is beyond the current level.
❤️Sending you lots of Love and Hugs❤️
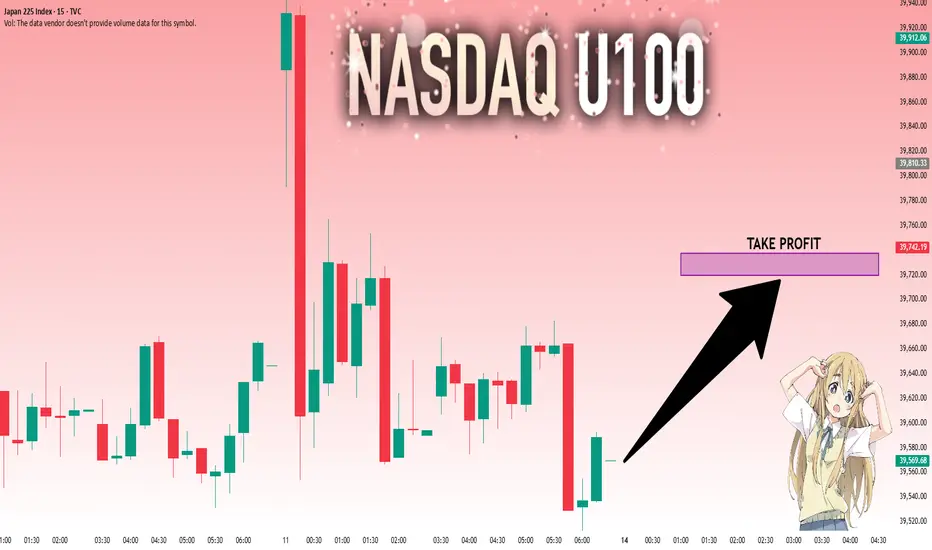
NI225: Will Go Up! Long!
My dear friends,
Today we will analyse NI225 together☺️
The recent price action suggests a shift in mid-term momentum. A break above the current local range around 39,581.12 will confirm the new direction upwards with the target being the next key level of 39,719.48 and a reconvened placement of a stop-loss beyond the range.
❤️Sending you lots of Love and Hugs❤️
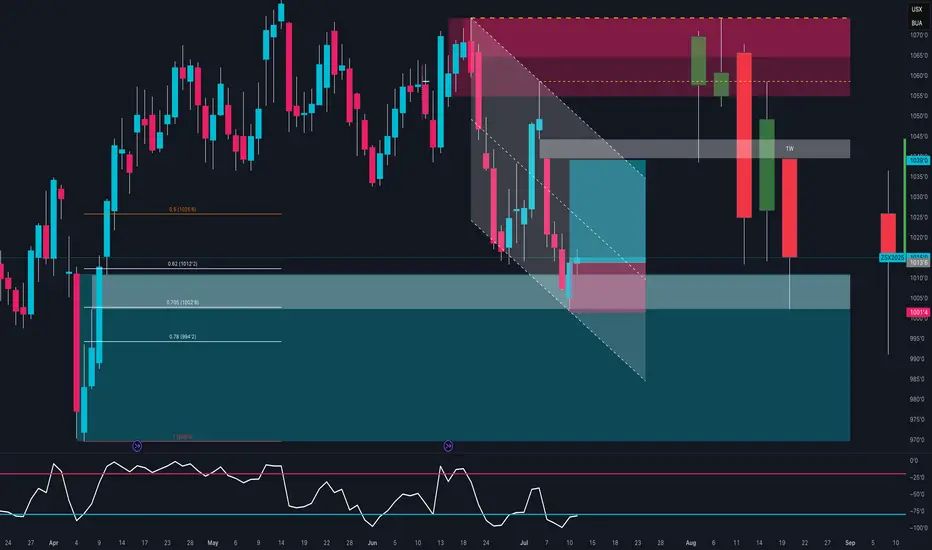
Soybeans Loading a Bounce? Demand Zone + COT1. Price Action & Technical Structure
Price has bounced off a strong daily demand zone (1011–969).
Today’s daily candle shows a clear rejection wick from the low, and RSI is signaling a potential reversal.
The market is trading inside a falling channel, currently near the lower boundary — setting up a possible breakout move.
Technical Targets:
• First upside target: 1039–1049
Invalidation: daily close below 990, which would confirm structural breakdown.
2. COT Report – Soybeans Futures (as of July 9, 2025)
• Non-Commercials:
+11,539 spreads | +7,017 shorts | –7,520 longs → Slight bearish pressure, though spreads suggest growing speculative complexity.
• Commercials:
+7,876 longs | –9,084 shorts → Moderate commercial bullish bias.
• Open Interest:
+8,076 contracts → Market activity increasing.
Overall COT positioning is neutral to slightly bullish, with growing signs of accumulation around the 1000 level.
3. Seasonality – MarketBulls
Historically, July is one of the weakest months for Soybeans:
• –44.82 (20Y avg)
• –36.86 (15Y avg)
• –34.74 (10Y avg)
However, early August shows signs of seasonal recovery, and price action is already diverging from typical seasonal behavior.
This makes a deeper breakdown less likely — we could be nearing the end of the seasonal weakness.
Operational Takeaway
Current Bias: Neutral-to-Bullish
Confluence of signals supports the idea of a technical rebound:
✅ Bullish reaction candle in demand
✅ Fibonacci support + lower trendline touch
✅ COT data stabilizing with rising open interest
✅ Seasonal weakness possibly exhausted
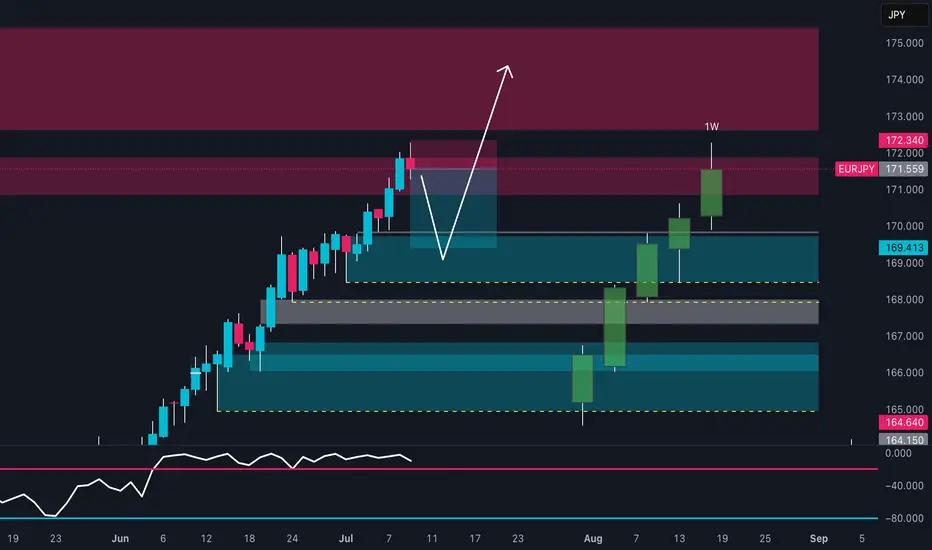
EURJPY Hits Supply | Pullback Is ComingPrice has entered the daily supply zone (red area) between 170.80 and 171.80, showing immediate rejection with a long upper wick — a signal of potential short-term bearish reaction.
The RSI is turning lower, indicating loss of momentum, although it hasn’t reached extreme levels yet.
The current map suggests a technical pullback toward the 169.40–168.50 zone (FVG + dynamic support) before any potential bullish continuation toward 174+.
The overall structure remains bullish, but a correction looks likely due to technical exhaustion and retail positioning.
📊 2. COT Report (JPY Futures – as of 2025-07-01)
Non-Commercials (speculators) reduced long positions on the JPY by -7,779 contracts, and also slightly trimmed shorts → clear sign of position reduction.
Net positioning remains strongly negative (JPY weakness), but it's starting to recover slightly.
Commercials added both longs (+2,830) and shorts (+5,977), indicating indecision but growing interest.
Open interest slightly decreased (–516), though it remains elevated.
👉 The market has not yet reversed, but the JPY downtrend may be approaching exhaustion.
🧠 3. Retail Sentiment
86% of retail traders are short EUR/JPY — a strong contrarian bullish signal.
Average retail short entry: 166.27, while current price is 171.55 → retail traders are trapped and under pressure.
A short squeeze is likely underway or already completed, increasing the risk of a technical correction after distribution.
📅 4. Seasonality
July is historically weak for EUR/JPY:
20Y: -0.35
15Y: -0.49
10Y: -0.18
August tends to be even worse from a seasonal perspective.
This supports the idea of a potential pullback in the coming days or weeks.
Trading Conclusion
Current Bias: Short-term Neutral–Bearish, Medium-term Bullish.
✳️ Potential pullback from 172.30 toward 169.40–168.50
🎯 If price holds and builds clean bullish structure, expect continuation toward 174.00–175.00
❌ Invalidation on daily close below 167.80
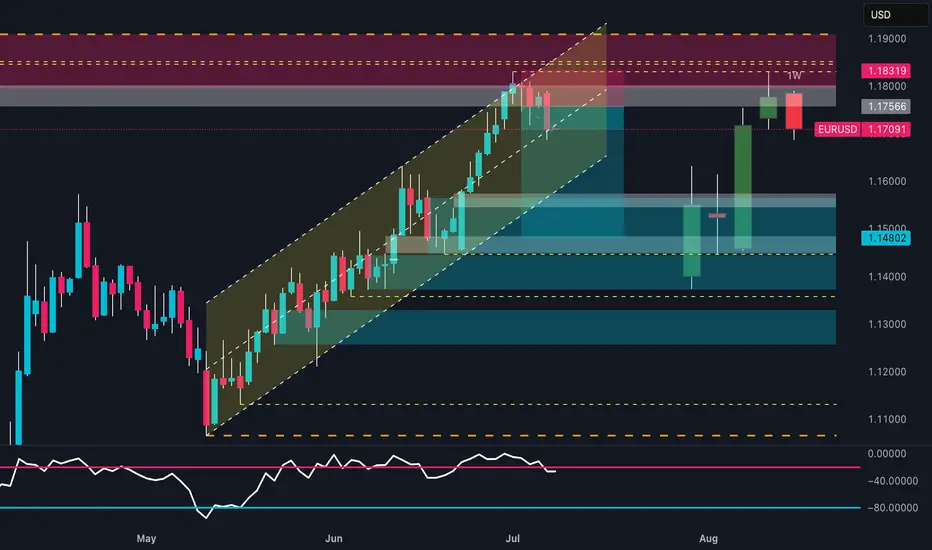
EUR/USD Reversal Ahead? COT + DXY Strength Signal Price has broken below the ascending channel that started in mid-May.
The current candle is rejecting the weekly supply zone (1.17566–1.18319), leaving a significant upper wick.
Daily RSI is losing strength but has not yet reached extreme levels.
A key daily Fair Value Gap (FVG) lies between 1.1600 and 1.1480, with the first potential downside target at 1.14802, which aligns with support and the FVG zone.
A deeper bearish continuation could push price towards 1.1350, but only if the FVG lows are clearly broken.
📊 COT Data (CME - Euro FX & USD Index)
Euro FX
Net long: +15,334
Commercials increased both longs (+13,550) and shorts (+9,913) → mild divergence.
Non-Commercials (speculators) increased shorts (+4,786) more than longs (+1,188) → speculative bias tilting bearish.
USD Index
Strong net long accumulation across all trader types: +4,597 net.
Non-Commercials added +3,590 longs, with only a minor increase in shorts.
→ USD strength continues, reinforcing potential weakness in EUR/USD.
🧠 Retail Sentiment
67% of retail traders are short EUR/USD → typically a contrarian bullish signal.
However, the price is already showing distribution, not accumulation, so we may see price push lower first to trap remaining retail longs, invalidating the contrarian signal in the short term.
📅 Seasonality
July is historically bullish, especially on the 2Y (+0.0142) and 10Y (+0.0106) averages.
However, the 15Y and 20Y averages show a much more moderate performance (+0.007 / +0.0025).
Based on current price action, the seasonal rally may have already played out with the run-up to 1.1830. A correction now seems likely, even if the broader macro remains supportive mid-term.
🧩 Conclusion
Despite historically bullish seasonality for July, both price action and COT data indicate distribution with early signs of reversal.
Retail sentiment is too skewed short for a major breakdown just yet, but the technicals support a short-term pullback toward more balanced levels.
USD strength from COT and DXY structure reinforces a corrective short bias for now.
EURAUD Breakdown Incoming? Price + COT + Seasonality🧠 MACRO & INSTITUTIONAL FLOWS (COT)
EURO (EUR)
Strong increase in net long positions by non-commercials: +16,146
Commercials also added long exposure: +25,799
Bias: moderately bullish
AUSTRALIAN DOLLAR (AUD)
Non-commercials remain heavily net short (long/short ratio: 15% vs 63.6%)
Slight increase in commercial longs: +2,629
Bias: still bearish, but showing early signs of positioning exhaustion
COT Conclusion: EUR remains strong, AUD remains weak — but the recent extension calls for caution on fresh EURAUD longs.
📊 SEASONALITY (JULY)
EUR shows historically positive July performance across 2Y, 5Y, and 10Y averages
AUD also shows mild strength, but less consistent
🔎 Net differential: No strong seasonal edge on EURAUD in July
📈 RETAIL SENTIMENT
54% of retail traders are short EURAUD, 46% long
Slight contrarian bullish bias, but not extreme yet → neutral to slightly long
📉 TECHNICAL STRUCTURE – MULTI-TIMEFRAME
1. Weekly Chart
Strong bearish engulfing candle after 4 weeks of upside
RSI dropped below 50 → clear momentum shift
1.7960–1.8100 is now a liquidity zone that’s been tapped
2. Daily Chart
Confirmed break of the ascending channel formed since May
Price reacted from demand zone around 1.7460–1.7720, signaling potential pullback
Watch for rejection around 1.7910 (50% body of the weekly engulfing candle)
3. Entry Setup
Key area for short entries: 1.7910–1.7940
This zone aligns with:
✅ Former support now turned resistance
✅ Inside a valid bearish order block
✅ Ideal retracement level (50% engulfing body)
🎯 OPERATIONAL CONCLUSION
While the macro context still favors a stronger EUR against AUD, price action tells another story.
The weekly engulfing candle is a strong technical reversal signal, and the daily structure confirms the break.
→ Shorting the pullback into 1.7910–1.7940 could offer an excellent R/R trade setup.
Bias: Short-term bearish – Targeting 1.7700, 1.7550, and potentially 1.7315
Invalidation: Daily close above 1.8040

EUR_NZD RESISTANCE AHEAD|SHORT|
✅EUR_NZD has been growing recently
And the pair seems locally overbought
So as the pair is approaching a horizontal resistance of 1.9500
Price decline is to be expected
SHORT🔥
✅Like and subscribe to never miss a new idea!✅
Disclosure: I am part of Trade Nation's Influencer program and receive a monthly fee for using their TradingView charts in my analysis.

USD-JPY Short From Resistance! Sell!
Hello,Traders!
USD-JPY keeps growing but
A strong horizontal resistance
Is ahead around 148.500
So after the retest we will
Be expecting a local
Bearish correction on Monday!
Sell!
Comment and subscribe to help us grow!
Check out other forecasts below too!
Disclosure: I am part of Trade Nation's Influencer program and receive a monthly fee for using their TradingView charts in my analysis.

GBP-USD Swing Long! Buy!
Hello,Traders!
GBP-USD is trading in a
Long-term uptrend along
The rising support support
Line and the pair will soon
Hit it and from there we will
Be expecting a bullish
Rebound on Monday
Buy!
Comment and subscribe to help us grow!
Check out other forecasts below too!
Disclosure: I am part of Trade Nation's Influencer program and receive a monthly fee for using their TradingView charts in my analysis.

EUR_USD STRONG UPTREND|LONG|
✅EUR_USD is trading in an uptrend
With the pair set to retest
The rising support line
From where I think the growth will continue
LONG🚀
✅Like and subscribe to never miss a new idea!✅
Disclosure: I am part of Trade Nation's Influencer program and receive a monthly fee for using their TradingView charts in my analysis.

CAD_JPY BULLISH BREAKOUT|LONG|
✅CAD_JPY broke the key
Structure level of 107.400
While trading in a strong uptrend
Which makes me bullish biased
And I think that after the retest of
The broken level is complete
A rebound and bullish continuation will follow
LONG🚀
✅Like and subscribe to never miss a new idea!✅
Disclosure: I am part of Trade Nation's Influencer program and receive a monthly fee for using their TradingView charts in my analysis.

AUD-CHF Local Long! Buy!
Hello,Traders!
AUD-CHF made a bullish
Breakout of the key horizontal
Level of 0.5221 which is now a
Support and the pair is going down
To retest the level from where
We will be expecting a
Further bullish move up
Buy!
Comment and subscribe to help us grow!
Check out other forecasts below too!
Disclosure: I am part of Trade Nation's Influencer program and receive a monthly fee for using their TradingView charts in my analysis.

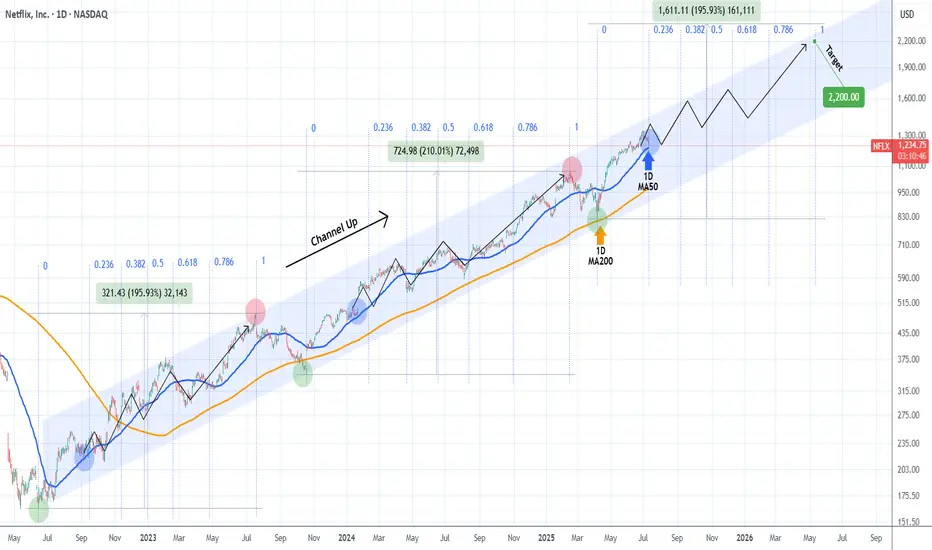
NETFLIX 1D MA50 test is a new buy opportunity.Netflix (NFLX) has been rising non-stop since the April 07 bottom on the 1D MA200 (orange trend-line). This bottom has been the latest Higher Low of the 3-year Channel Up that started on the June 14 2022 bottom.
This kickstarted its third long-term Bullish Leg. The previous two have been fairly similar (+210% and +195.93%) so we can assume a minimum total rise of +195.93% until the next top (Higher High of the Channel Up).
We can also see that on each Bullish Leg, after the initial rebound, the stock always tested the 1D MA50 (blue trend-line) around the 0.236 Time Fibonacci level. That has always been the best buy opportunity of that stage.
As a result, we believe that the recent short-term correction is a buy opportunity in disguise, targeting a Higher High at $2200.
Check out our previous analysis on Netflix:
-------------------------------------------------------------------------------
** Please LIKE 👍, FOLLOW ✅, SHARE 🙌 and COMMENT ✍ if you enjoy this idea! Also share your ideas and charts in the comments section below! This is best way to keep it relevant, support us, keep the content here free and allow the idea to reach as many people as possible. **
-------------------------------------------------------------------------------
💸💸💸💸💸💸
👇 👇 👇 👇 👇 👇
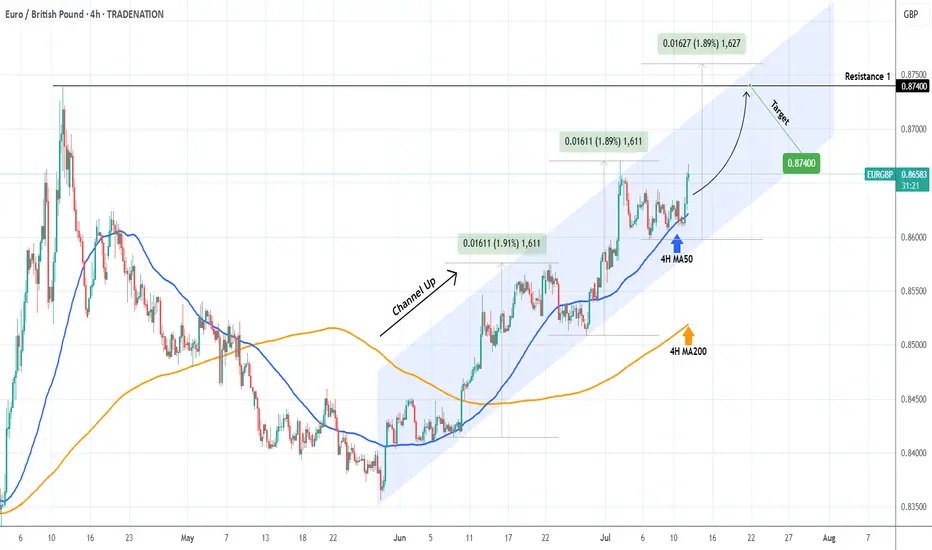
EURGBP Perfect Channel Up giving one more buy opportunity.Last time we looked at the EURGBP pair (May 30, see chart below) we gave the most timely buy signal right at the bottom (Higher Lows trend-line) of the Bullish Megaphone, and the price is only a few candles away from the 0.87400 Target:
If we look at the price action from a 4H perspective we can see that it is a Channel Up that has been driving the pair upwards since the May 28 bottom and today's rebound is taking place after a direct hit on the 4H MA50 (blue trend-line).
This is the start of the new Bullish Leg. Since the previous two have increased by +1.90%, this rally has the potential to even exceed our 0.87400 Target marginally. Still, this is a perfect bullish set-up.
-------------------------------------------------------------------------------
** Please LIKE 👍, FOLLOW ✅, SHARE 🙌 and COMMENT ✍ if you enjoy this idea! Also share your ideas and charts in the comments section below! This is best way to keep it relevant, support us, keep the content here free and allow the idea to reach as many people as possible. **
-------------------------------------------------------------------------------
Disclosure: I am part of Trade Nation's Influencer program and receive a monthly fee for using their TradingView charts in my analysis.
💸💸💸💸💸💸
👇 👇 👇 👇 👇 👇
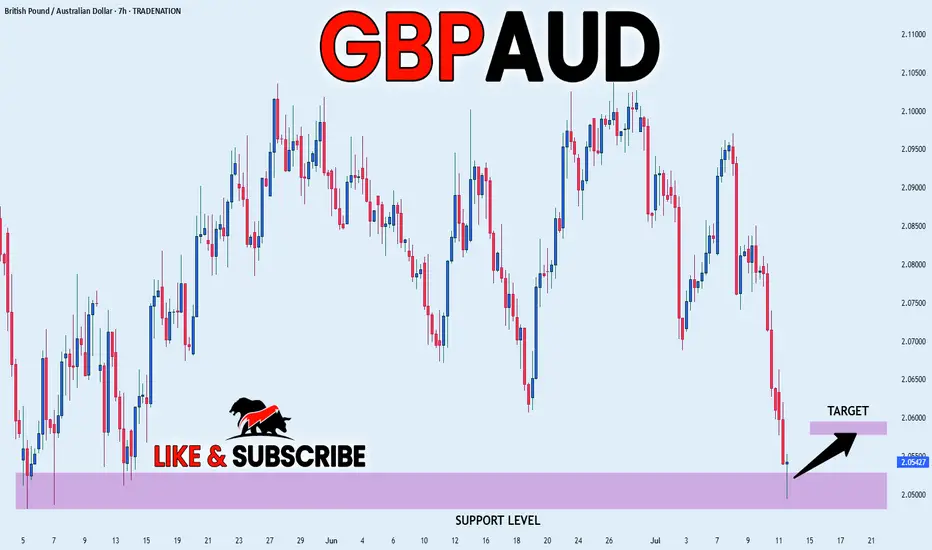
GBP_AUD LONG FROM SUPPORT|
✅GBP_AUD fell down sharply
But a strong support level was hit at 2.0500
Thus I am expecting a rebound
And a move up towards the target of 2.0580
LONG🚀
✅Like and subscribe to never miss a new idea!✅
Disclosure: I am part of Trade Nation's Influencer program and receive a monthly fee for using their TradingView charts in my analysis.