Good moment for try to Buy XRPGood moment for try to Buy XRP. We are in a sideways trend and are now approaching its upper border. We will take a breakout. Stop under the lower line of the channel. We'll see
Signals
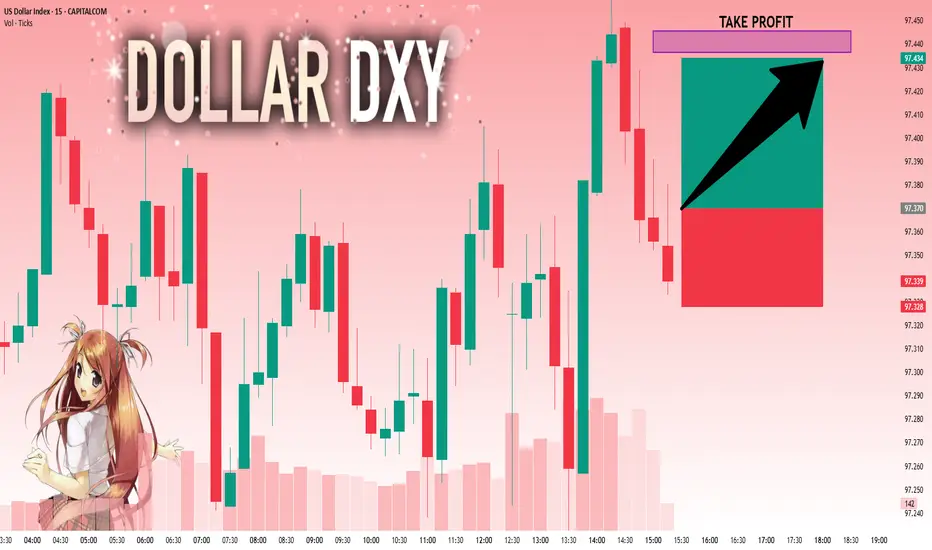
DXY: The Market Is Looking Down! Short!
My dear friends,
Today we will analyse DXY together☺️
The in-trend continuation seems likely as the current long-term trend appears to be strong, and price is holding above a key level of 97.370 So a bullish continuation seems plausible, targeting the next high. We should enter on confirmation, and place a stop-loss beyond the recent swing level.
❤️Sending you lots of Love and Hugs❤️
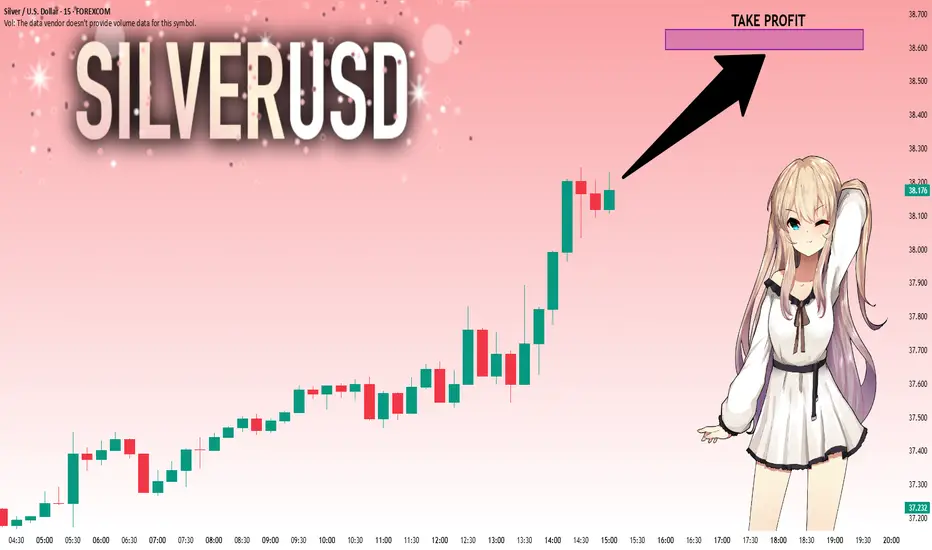
SILVER: Strong Bullish Sentiment! Long!
My dear friends,
Today we will analyse SILVER together☺️
The market is at an inflection zone and price has now reached an area around 38.207 where previous reversals or breakouts have occurred.And a price reaction that we are seeing on multiple timeframes here could signal the next move up so we can enter on confirmation, and target the next key level of 38.594.Stop-loss is recommended beyond the inflection zone.
❤️Sending you lots of Love and Hugs❤️
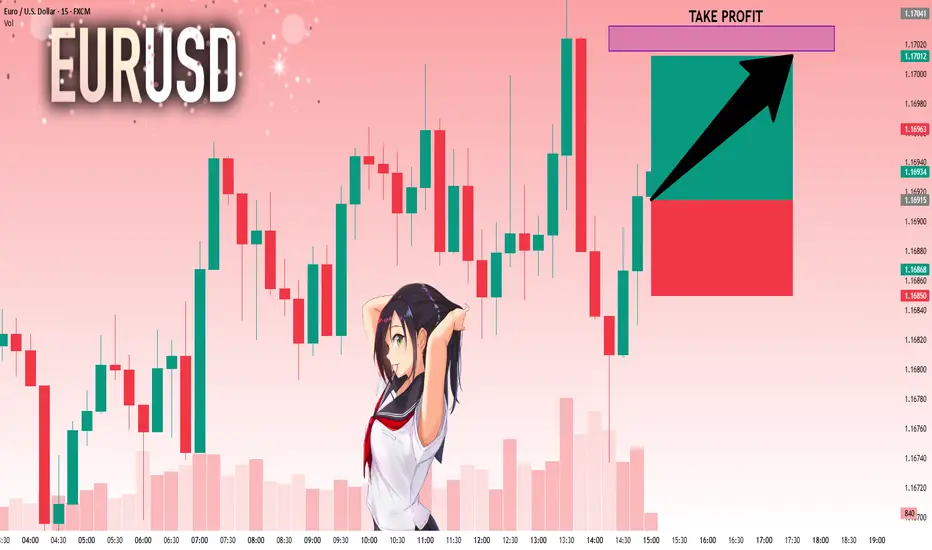
EURUSD: Bulls Are Winning! Long!
My dear friends,
Today we will analyse EURUSD together☺️
The price is near a wide key level
and the pair is approaching a significant decision level of 1.16915 Therefore, a strong bullish reaction here could determine the next move up.We will watch for a confirmation candle, and then target the next key level of 1.17015.Recommend Stop-loss is beyond the current level.
❤️Sending you lots of Love and Hugs❤️
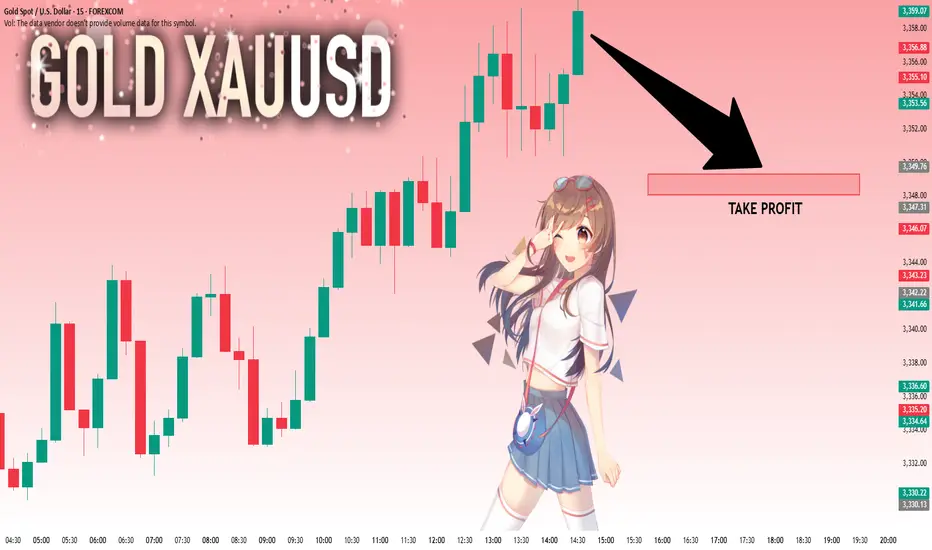
GOLD: Next Move Is Down! Short!
My dear friends,
Today we will analyse GOLD together☺️
The recent price action suggests a shift in mid-term momentum. A break below the current local range around 3,358.00 will confirm the new direction downwards with the target being the next key level of 3,349.30.and a reconvened placement of a stop-loss beyond the range.
❤️Sending you lots of Love and Hugs❤️
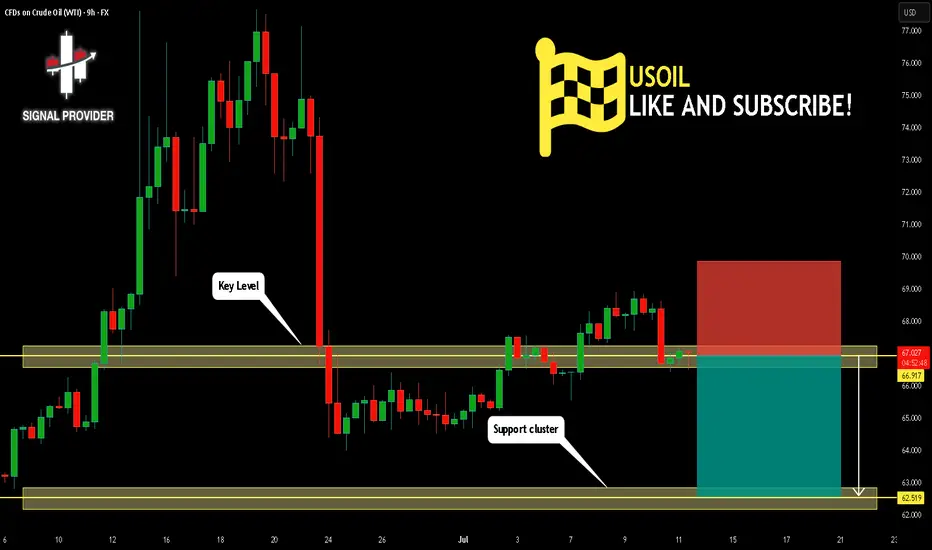
USOIL Will Go Lower! Short!
Please, check our technical outlook for USOIL.
Time Frame: 9h
Current Trend: Bearish
Sentiment: Overbought (based on 7-period RSI)
Forecast: Bearish
The price is testing a key resistance 66.917.
Taking into consideration the current market trend & overbought RSI, chances will be high to see a bearish movement to the downside at least to 62.519 level.
P.S
Please, note that an oversold/overbought condition can last for a long time, and therefore being oversold/overbought doesn't mean a price rally will come soon, or at all.
Disclosure: I am part of Trade Nation's Influencer program and receive a monthly fee for using their TradingView charts in my analysis.
Like and subscribe and comment my ideas if you enjoy them!
EURUSD Will Go Up! Buy!
Here is our detailed technical review for EURUSD.
Time Frame: 6h
Current Trend: Bullish
Sentiment: Oversold (based on 7-period RSI)
Forecast: Bullish
The market is trading around a solid horizontal structure 1.169.
The above observations make me that the market will inevitably achieve 1.177 level.
P.S
The term oversold refers to a condition where an asset has traded lower in price and has the potential for a price bounce.
Overbought refers to market scenarios where the instrument is traded considerably higher than its fair value. Overvaluation is caused by market sentiments when there is positive news.
Disclosure: I am part of Trade Nation's Influencer program and receive a monthly fee for using their TradingView charts in my analysis.
Like and subscribe and comment my ideas if you enjoy them!

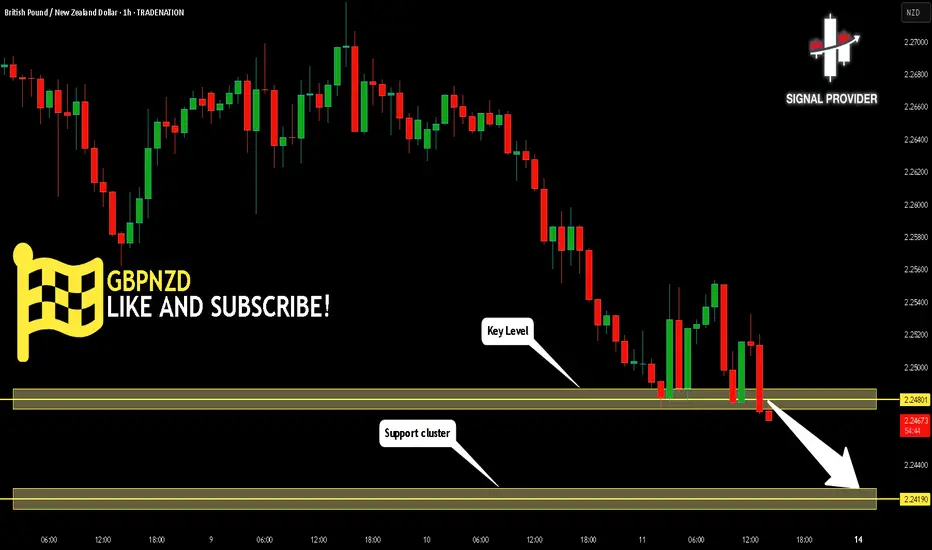
GBPNZD Is Bearish! Sell!
Please, check our technical outlook for GBPNZD.
Time Frame: 1h
Current Trend: Bearish
Sentiment: Overbought (based on 7-period RSI)
Forecast: Bearish
The market is approaching a key horizontal level 2.248.
Considering the today's price action, probabilities will be high to see a movement to 2.241.
P.S
Overbought describes a period of time where there has been a significant and consistent upward move in price over a period of time without much pullback.
Disclosure: I am part of Trade Nation's Influencer program and receive a monthly fee for using their TradingView charts in my analysis.
Like and subscribe and comment my ideas if you enjoy them!
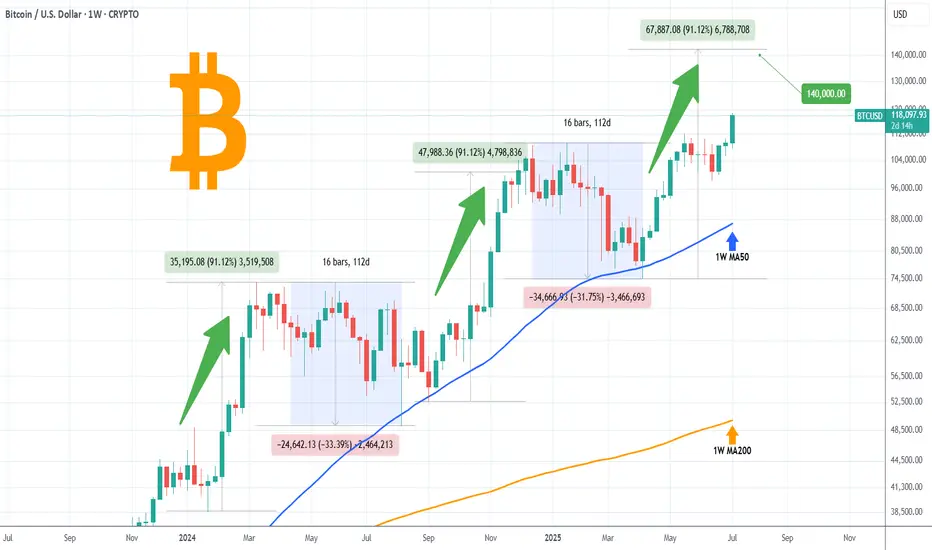
BITCOIN hit new ATH above $118k and isn't stopping there!Bitcoin (BTCUSD) broke above its previous All Time High (ATH) Zone and the buying pressure accelerated so much that it even crossed above the $118k level early in the E.U. session.
Technically the bullish trend doesn't seem to stop there as following the Bull Flag (we've analyzed this extensively the previous days) break-out of mid-May to June, the long-term Bullish Leg that started on the April 07 2025 bottom, is looking now for its 2nd Phase (extension).
Based on the previous two Bullish Legs since 2024, we should be expecting at least a +91.12% rise from the April bottom, as so far the symmetry among all three fractals is remarkable. Equally strong Bearish Legs (around -32%) of roughly 112 days each, gave way to the Bullish Legs, which supported by the 1W MA50 (blue trend-line) pushed the market higher.
If this pattern continues to be replicated, we should expect this Leg to peak a little over $140000 before the next correction.
Do you think we'll get there? Feel free to let us know in the comments section below!
-------------------------------------------------------------------------------
** Please LIKE 👍, FOLLOW ✅, SHARE 🙌 and COMMENT ✍ if you enjoy this idea! Also share your ideas and charts in the comments section below! This is best way to keep it relevant, support us, keep the content here free and allow the idea to reach as many people as possible. **
-------------------------------------------------------------------------------
💸💸💸💸💸💸
👇 👇 👇 👇 👇 👇
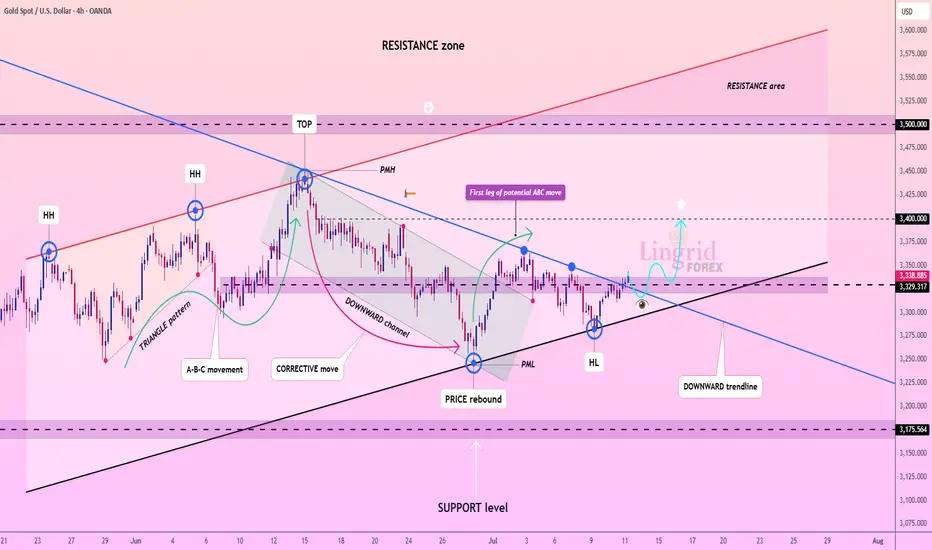
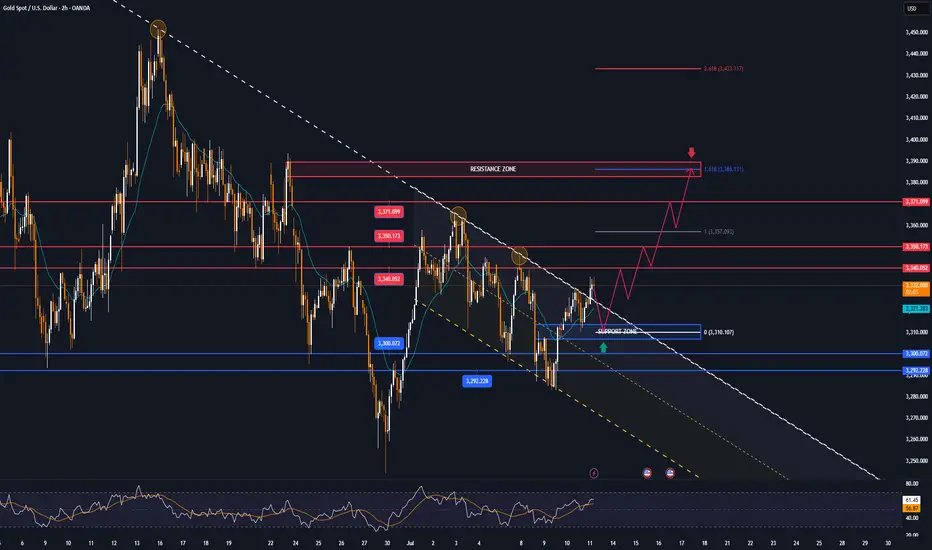
Lingrid | GOLD Potential A-B-C Movement in ProgressOANDA:XAUUSD bounced strongly from the ascending trendline and reclaimed key structure near 3,275, signaling strength after rejecting the prior downward channel. Price has broken above the descending trendline and is now testing the 3,329 resistance zone with bullish momentum. If buyers maintain control above this breakout area, a push toward the 3,400 level becomes increasingly likely. The structure supports a continuation of the bullish leg unless price drops back under 3,275.
📉 Key Levels
Buy trigger: breakout and retest hold above 3,329.3
Buy zone: 3,300–3,329 (breakout + structure support)
Target: 3,400 first, extended toward 3,500
Invalidation: sharp drop below 3,275 negates bullish setup
💡 Risks
False breakout above 3,329 could invite short-term pullback
Rejection at 3,400 may lead to consolidation below resistance
Macro shocks (Fed, CPI) could reverse sentiment abruptly
If this idea resonates with you or you have your own opinion, traders, hit the comments. I’m excited to read your thoughts!
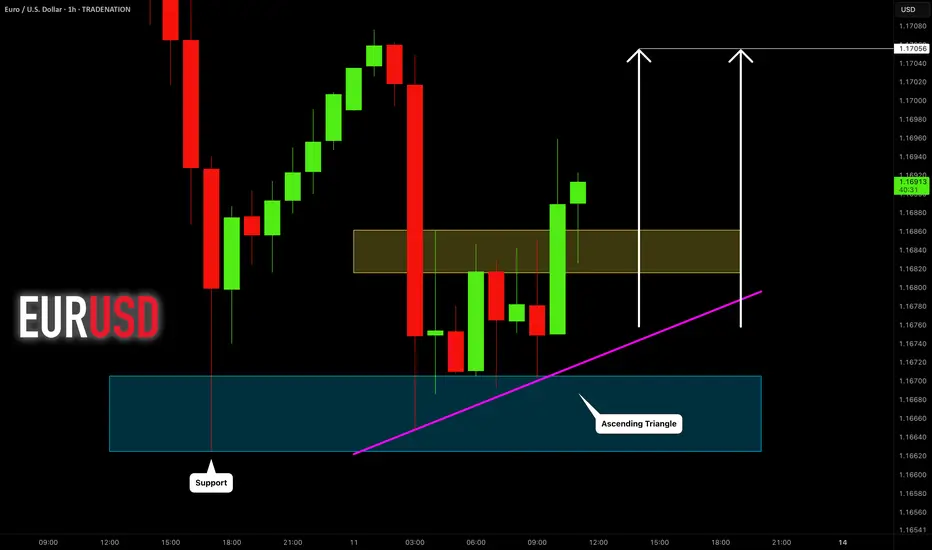
EURUSD: Strong Bullish Confirmation?! 🇪🇺🇺🇸
There is a high chance that EURUSD will move up from the
underlined intraday support.
An ascending triangle formation and a violation of its neckline
indicate a strength of the buyers.
Goal - 1.1705
❤️Please, support my work with like, thank you!❤️
I am part of Trade Nation's Influencer program and receive a monthly fee for using their TradingView charts in my analysis.
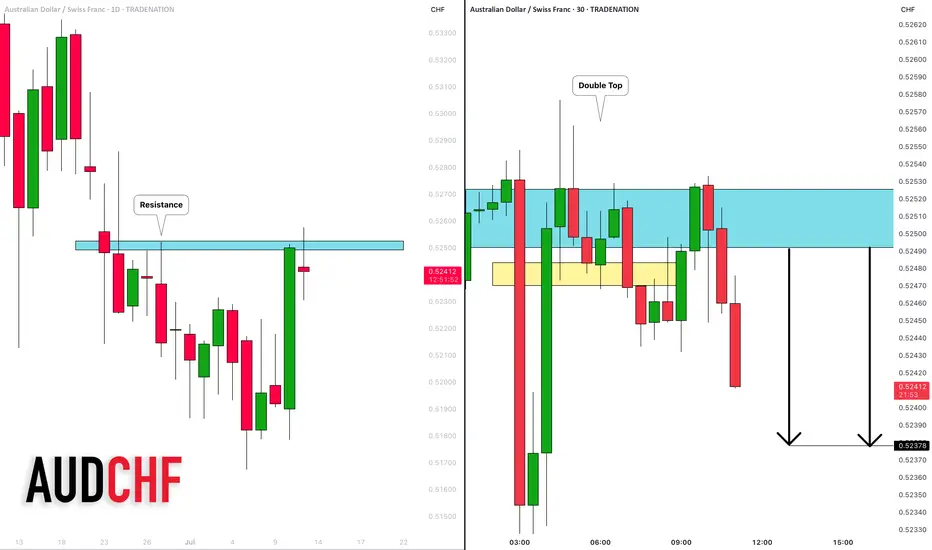
AUDCHF: Pullback From Resistance 🇦🇺🇨🇭
AUDCHF is going to retrace from a key daily resistance.
As a confirmation, I spotted a double top pattern on 30 minutes time frame
and a very bearish reaction after CHF fundamental news releases an hour ago.
Goal - 0.5238
❤️Please, support my work with like, thank you!❤️
I am part of Trade Nation's Influencer program and receive a monthly fee for using their TradingView charts in my analysis.
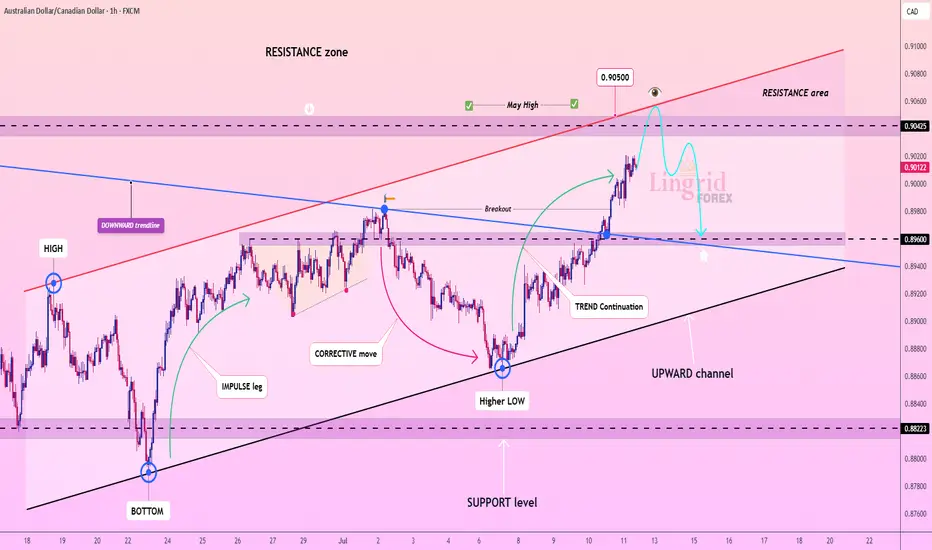
Lingrid | AUDCAD Shoring Opportunity at Monthly HighThe price perfectly fulfilled my last idea . FX:AUDCAD surged through the previous resistance and is now testing the 0.9045–0.9050 zone, where both a horizontal supply and red descending trendline converge. This area is a critical junction, and current price action shows early hesitation with a potential rounding top formation. A deeper pullback is possible if buyers fail to break above this resistance convincingly, with downside targets near prior breakout levels. The broader uptrend remains intact, but short-term correction risks are rising from this confluence zone.
📉 Key Levels
Sell trigger: confirmed rejection below 0.9050 with bearish engulfing or wick exhaustion
Sell zone: 0.9025–0.9050 (key resistance + trendline)
Target: 0.8960 initially, with deeper extension to 0.8822
Invalidation: clean hourly close above 0.9060 signals continuation of uptrend
💡 Risks
Minor support near 0.9000 could stall decline
Stronger-than-expected AUD data could lift price through resistance
False breakout wicks above 0.9050 might trap early sellers
If this idea resonates with you or you have your own opinion, traders, hit the comments. I’m excited to read your thoughts!
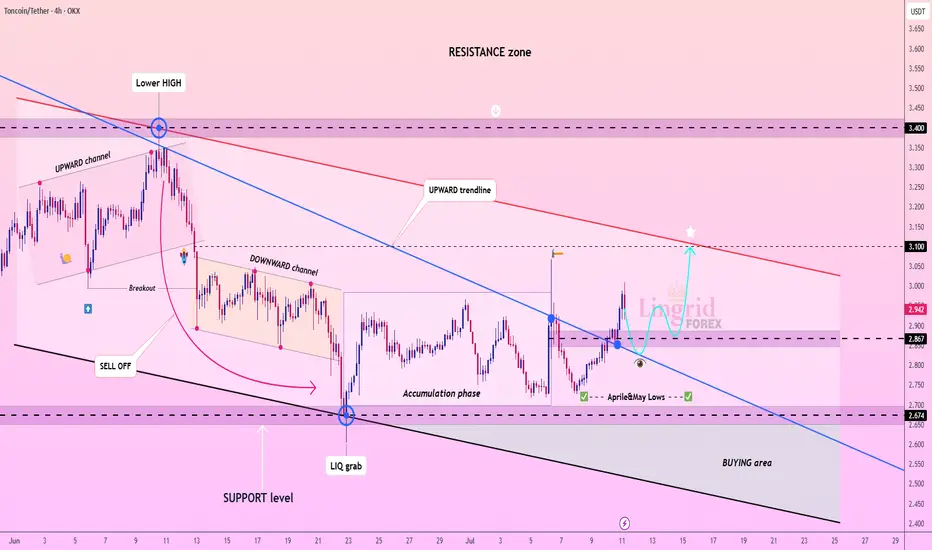
Lingrid | TONUSDT Accumulation-to-Distribution Phase ShiftThe price perfectly fulfilled my last idea . OKX:TONUSDT is forming a bullish continuation after an extended accumulation phase above the support level at 2.67. The recent breakout above the downward channel and the retest of the blue trendline suggest strength building for a move toward the 3.10 resistance. If buyers hold above the 2.87 pivot zone, the price may rally into the upper red trendline before facing significant pressure. Confirmation above local structure is key to unlocking the full upside toward the resistance zone.
📈 Key Levels
Buy zone: 2.70–2.87 (blue trendline + April & May lows)
Buy trigger: strong hourly hold above 2.87 with follow-through
Target: 3.10 first, with extension to 3.40
Invalidation: breakdown below 2.67 kills bullish momentum
💡 Risks
Failure to hold above 2.87 may trap late buyers
Resistance at 3.10 may cause sharp rejection
Wider market weakness could negate this breakout attempt
If this idea resonates with you or you have your own opinion, traders, hit the comments. I’m excited to read your thoughts!
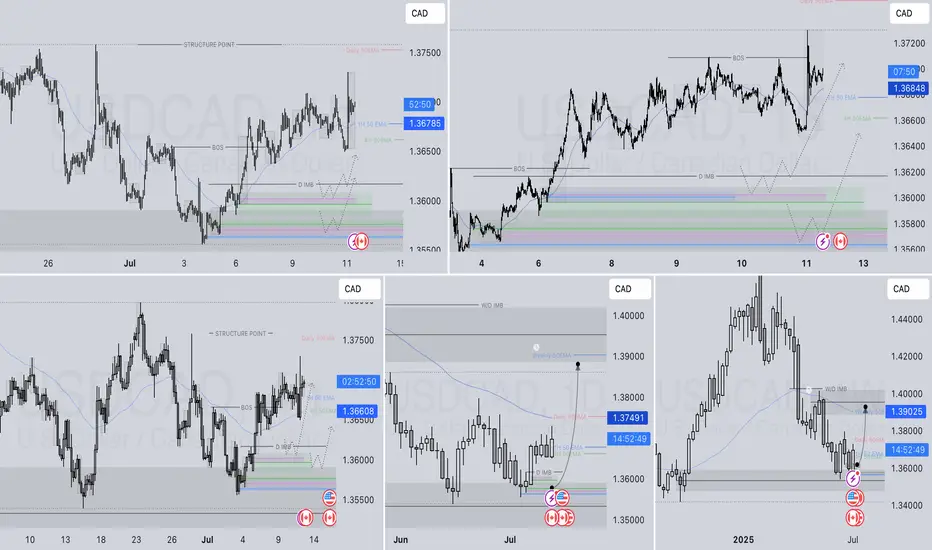
USDCAD LONG DAILY FORECAST Q3 D11 W28 Y25USDCAD LONG DAILY FORECAST Q3 D11 W28 Y25
It’s Fun Coupon Friday! 💸🔥
Professional Risk Managers👋
Welcome back to another FRGNT chart update📈
Diving into some Forex setups using predominantly higher time frame order blocks alongside confirmation breaks of structure.
Let’s see what price action is telling us today! 👀
💡Here are some trade confluences📝
✅Daily Order block identified
✅4H Order Block identified
✅1H Order Block identified
🔑 Remember, to participate in trading comes always with a degree of risk, therefore as professional risk managers it remains vital that we stick to our risk management plan as well as our trading strategies.
📈The rest, we leave to the balance of probabilities.
💡Fail to plan. Plan to fail.
🏆It has always been that simple.
❤️Good luck with your trading journey, I shall see you at the very top.
🎯Trade consistent, FRGNT X
GOLD continues to recover, tariff war changes unpredictablyInternational OANDA:XAUUSD continued to rise, boosted by a slight decline in the US Dollar and US Treasury yields. At the same time, investors are closely monitoring the developments in trade negotiations as US President Trump expands the tariff war.
As of the time of writing, spot OANDA:XAUUSD increased by 0.3% to 3,333 USD/oz. The general weakness of the US Dollar, the decline in US Treasury yields and renewed concerns about the escalation of the trade war have helped stabilize gold prices.
On Thursday evening (July 10) local time, US President Donald Trump once again increased pressure on trading partners. He announced that he would impose a 35% tariff on imported goods from Canada, and the USD/CAD exchange rate rose sharply in the short term.
Trump posted on his social media platform Truth Social that a 35% tariff would be imposed on imported goods from Canada, effective from August 1, 2025.
It is still unclear whether the current exemptions for goods traded under the United States-Mexico-Canada Agreement (USMCA) will be extended or terminated.
Due to the impact of escalating trade tensions, spot gold prices also rose by more than 10 dollars in the short term at the beginning of the Asian trading session on Friday, and the current high price of gold has reached around 3,336 USD/ounce.
In an interview with NBC News on Thursday, Trump said he was also considering imposing a flat tariff of 15% to 20% on most of his trading partners, adding that the exact tariff rate was being worked out. The current flat tariff rate is 10%.
Trump sent letters to trading partners this week, announcing that the new tariffs would take effect on August 1 if they could not negotiate more favorable terms. He is expected to send letters to European Union member states soon.
Trump sent the first batch of tariff letters to 14 countries, including Japan and South Korea, on July 7, with tariffs ranging from 25% to 40%. He also said he would send more similar letters this week.
Minutes from the Fed's June 17-18 meeting showed that only a "few" Fed officials thought a rate cut was possible as early as this month, while most preferred to hold off until later in the year due to inflation concerns caused by Trump's tariffs.
The Federal Open Market Committee (FOMC) voted unanimously to leave interest rates unchanged at its June meeting. The next policy meeting is scheduled for July 29-30.
Markets will focus on progress in Trump's tariff negotiations, key US economic data and speeches by Federal Reserve officials later in the day for fresh trading direction for gold prices.
Technical Outlook Analysis OANDA:XAUUSD
Gold has had 2 sessions of recovery from the area around the 0.382% Fibonacci retracement, but the temporary upside momentum is still limited and does not qualify for a new bullish cycle.
In the short term, the EMA21 with the 0.236% Fibonacci retracement will act as the nearest resistance, if gold takes the price action to break above the 0.236% Fibonacci retracement level it will qualify for a new bullish cycle with the target then being around $3,400 in the short term, more so than $3,430.
On the other hand, with the current neutral trend, once gold is sold below the 0.382% Fibonacci retracement level again, it will have conditions to decline, and the target then is around 3,246 USD in the short term, more than the 0.50% Fibonacci retracement level.
The RSI index is hovering around 50, also showing that the market sentiment is still hesitant to have a specific direction.
During the day, the sideways trend of gold prices will be noticed by the following positions.
Support: 3,300 - 3,292 USD
Resistance: 3,340 - 3,350 - 3,371 USD
SELL XAUUSD PRICE 3388 - 3386⚡️
↠↠ Stop Loss 3392
→Take Profit 1 3380
↨
→Take Profit 2 3372
BUY XAUUSD PRICE 3296 - 3298⚡️
↠↠ Stop Loss 3292
→Take Profit 1 3304
↨
→Take Profit 2 3310
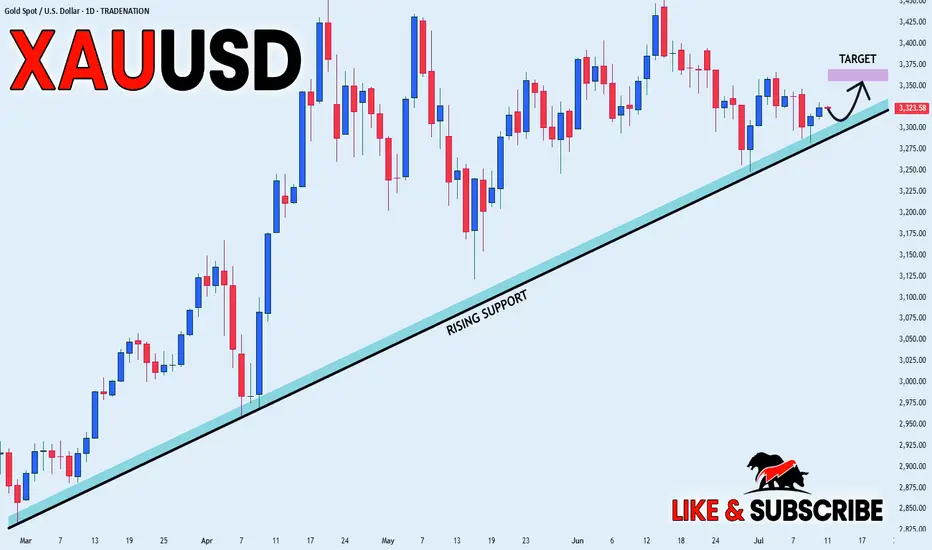
GOLD SWING LONG|
✅GOLD is trading in a strong
Long-term uptrend along the
Rising support line so we are
Bullish biased and after the price
Breakout of the local opening wedge
We we will be expecting a
Further bullish move up
LONG🚀
✅Like and subscribe to never miss a new idea!✅
Disclosure: I am part of Trade Nation's Influencer program and receive a monthly fee for using their TradingView charts in my analysis.
NZD-CHF Broken Wedge Pattern! Buy!
Hello,Traders!
NZD-CHF was trading in a
Narrowing bullish wedge pattern
And now we are finally seeing
A bullish breakout so we are
Bullish biased now and we
Will be expecting a further
Bullish move up after a
Local correction
Buy!
Comment and subscribe to help us grow!
Check out other forecasts below too!
Disclosure: I am part of Trade Nation's Influencer program and receive a monthly fee for using their TradingView charts in my analysis.

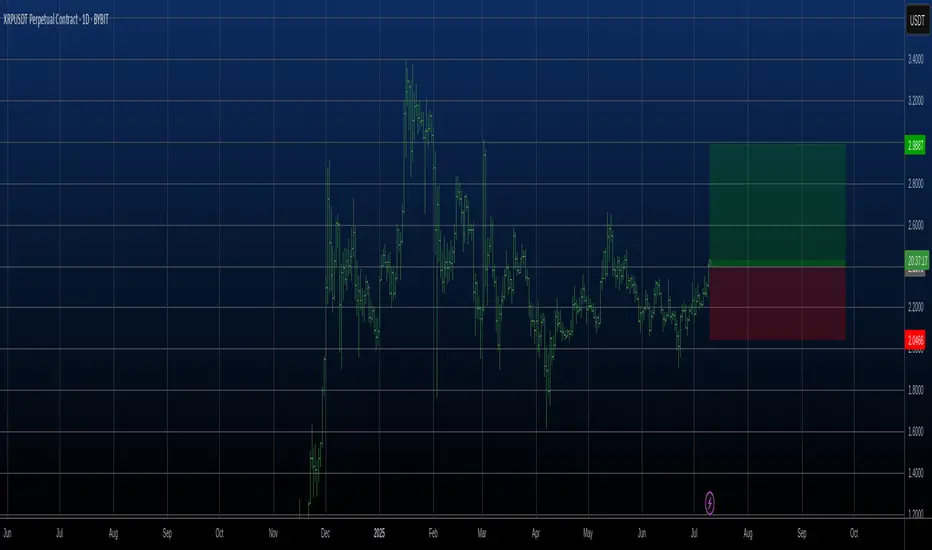
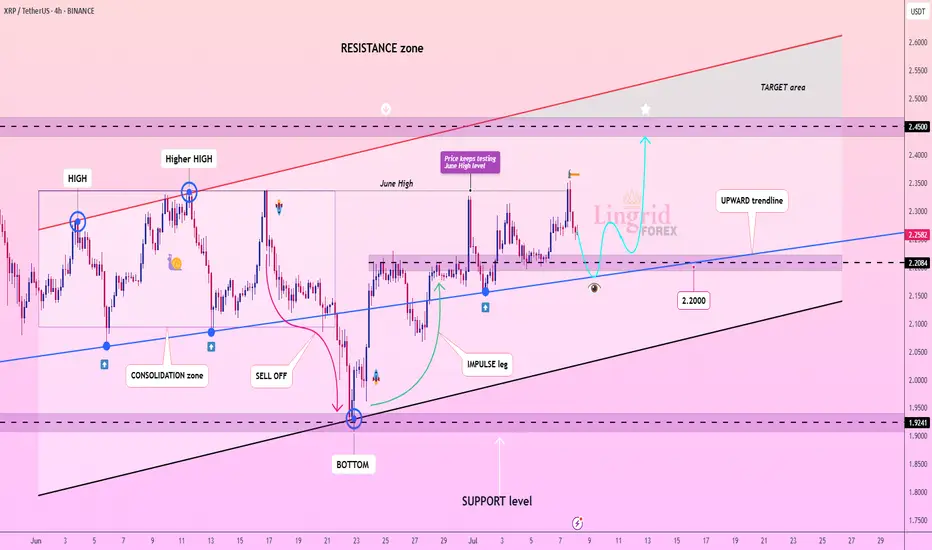
Lingrid | XRPUSDT Potential Upside BreakoutBINANCE:XRPUSDT is currently retesting its upward trendline and support near 2.20 after failing to hold above the June high. The asset remains in a higher-low structure with repeated attempts to break resistance around 2.35, indicating bullish accumulation. If the price holds this trendline, an upside breakout toward the 2.45 target zone becomes more likely.
📈 Key Levels
Buy zone: 2.20–2.17 (trendline + horizontal support)
Sell trigger: break and close below 2.15
Target: 2.45 resistance, followed by potential toward 2.60
Buy trigger: bullish reversal above 2.20 confirming trendline defense
💡 Risks
Breakdown below 2.20 opens downside risk to 1.92 support
Flat momentum may lead to range-bound movement
Resistance at 2.45 could stall rallies without volume support
If this idea resonates with you or you have your own opinion, traders, hit the comments. I’m excited to read your thoughts!
AUD_CAD WILL KEEP GROWING|LONG|
✅AUD_CAD is going up
Now and the pair made a bullish
Breakout of the key horizontal
Level of 0.8980 and the breakout
Is confirmed so we are bullish
Biased and we will be expecting
A further bullish move up
LONG🚀
✅Like and subscribe to never miss a new idea!✅
Disclosure: I am part of Trade Nation's Influencer program and receive a monthly fee for using their TradingView charts in my analysis.

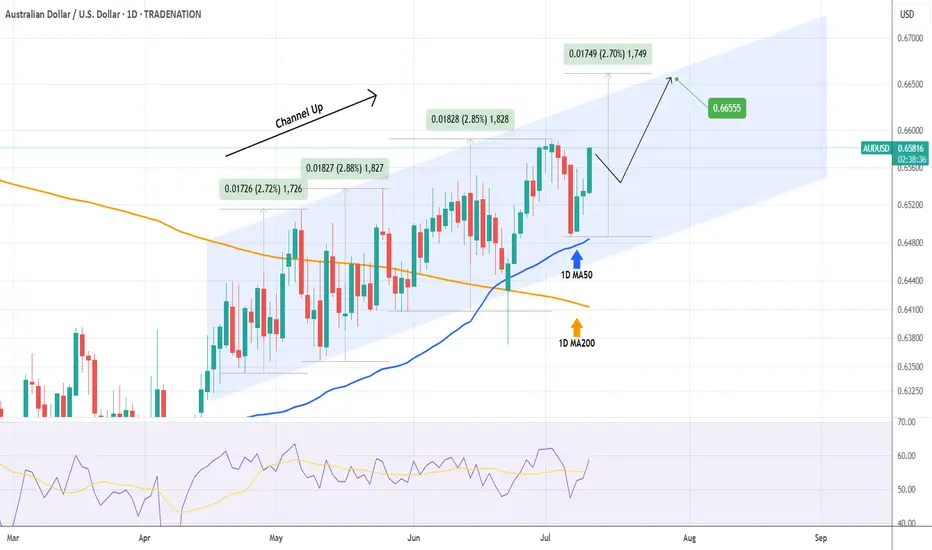
AUDUSD Strong bullish momentum inside this Channel Up.The AUDUSD pair has been trading within a 3-month Channel Up pattern and on Monday almost hit its 1D MA50 (blue trend-line) and rebounded. This is the start of its new Bullish Leg.
Based on the previous ones, it should complete a +2.70% rise at least. As long as the 1D MA50 (blue trend-line) holds, we are bullish, targeting 0.66555.
-------------------------------------------------------------------------------
** Please LIKE 👍, FOLLOW ✅, SHARE 🙌 and COMMENT ✍ if you enjoy this idea! Also share your ideas and charts in the comments section below! This is best way to keep it relevant, support us, keep the content here free and allow the idea to reach as many people as possible. **
-------------------------------------------------------------------------------
Disclosure: I am part of Trade Nation's Influencer program and receive a monthly fee for using their TradingView charts in my analysis.
💸💸💸💸💸💸
👇 👇 👇 👇 👇 👇
EUR-USD Bullish Bias! Buy!
Hello,Traders!
EUR-USD is trading in an
Uptrend and the pair is
Making a local bearish correction
But we are bullish biased and
After the retest of the horizontal
Support of 1.1640
We will be expecting a further
Bullish move up
Buy!
Comment and subscribe to help us grow!
Check out other forecasts below too!
Disclosure: I am part of Trade Nation's Influencer program and receive a monthly fee for using their TradingView charts in my analysis.

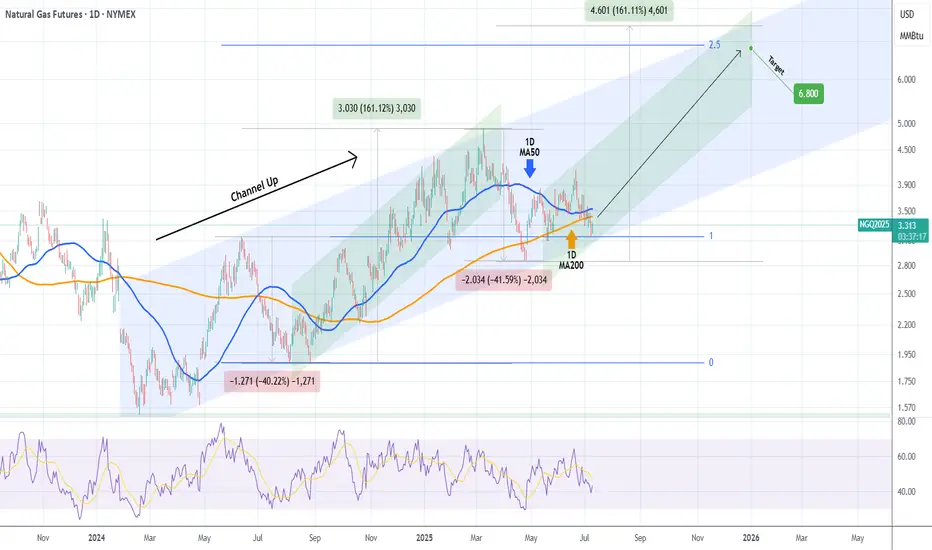
NATURAL GAS Best buy opportunity of the Channel Up.Natural Gas (NG1!) touched yesterday the bottom (Higher Lows trend-line) of the 1.5-year Channel Up, marginally below the 1D MA200 (orange trend-line) and is reacting so far today with a bullish tone.
If this evolves in a full-scale rebound, then technically it will be the pattern's new Bullish Leg. The previous one rose by +161.12% and a repeat of that will take this Leg back to the top of the Channel Up.
Our Target is marginally below that mark, on the 2.5 Fibonacci extension level at 6.800.
-------------------------------------------------------------------------------
** Please LIKE 👍, FOLLOW ✅, SHARE 🙌 and COMMENT ✍ if you enjoy this idea! Also share your ideas and charts in the comments section below! This is best way to keep it relevant, support us, keep the content here free and allow the idea to reach as many people as possible. **
-------------------------------------------------------------------------------
💸💸💸💸💸💸
👇 👇 👇 👇 👇 👇