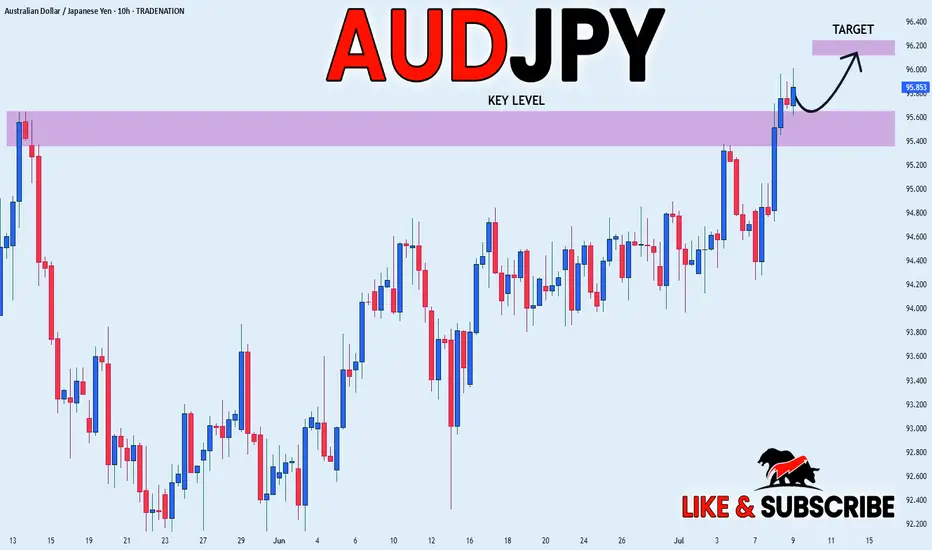
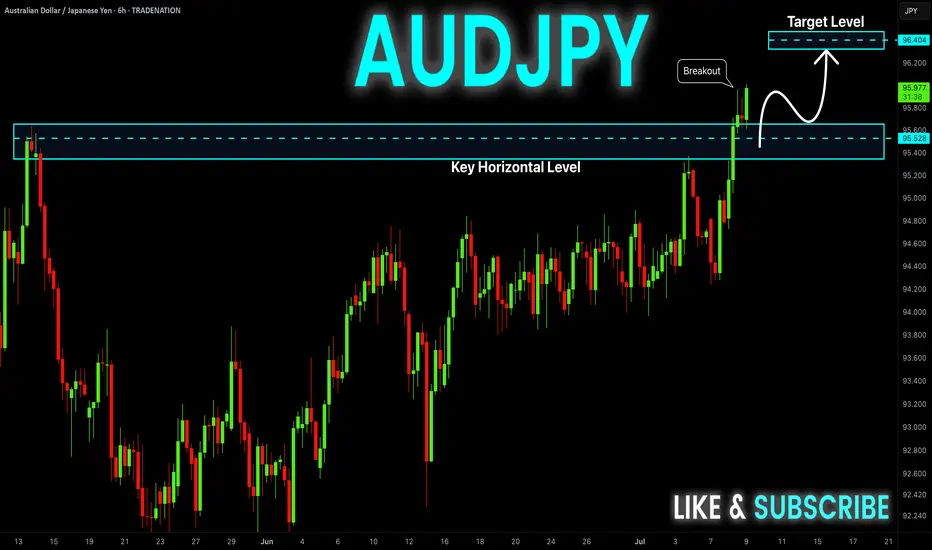
AUD_JPY WILL KEEP GROWING|LONG|
✅AUD_JPY is going up
Now and the pair made a bullish
Breakout of the key horizontal
Level of 95.600 and the breakout
Is confirmed so we are bullish
Biased and further growth
Is to be expected
LONG🚀
✅Like and subscribe to never miss a new idea!✅
Disclosure: I am part of Trade Nation's Influencer program and receive a monthly fee for using their TradingView charts in my analysis.
Signals
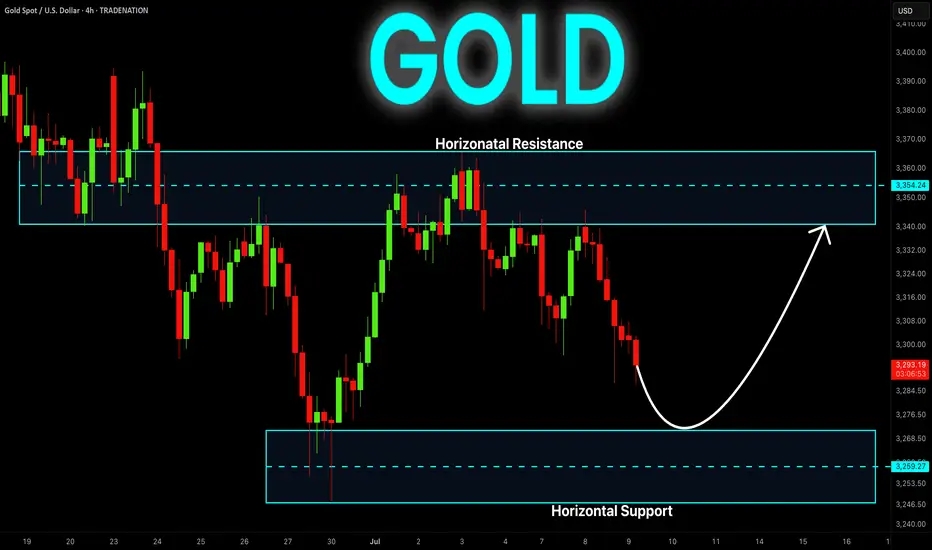
GOLD Long Inside The Range! Buy!
Hello,Traders!
GOLD is stuck in a local
Range while still trading
In a strong long-term uptrend
So we think that this is an
Accumulation before the
Next leg up and as we are
Bullish biased we will be
Expecting a retest and a
Rebound from the horizontal
Support below around 3259$
With the target of retesting
The horizontal resistance
Above around 3354$
Buy!
Comment and subscribe to help us grow!
Check out other forecasts below too!
Disclosure: I am part of Trade Nation's Influencer program and receive a monthly fee for using their TradingView charts in my analysis.
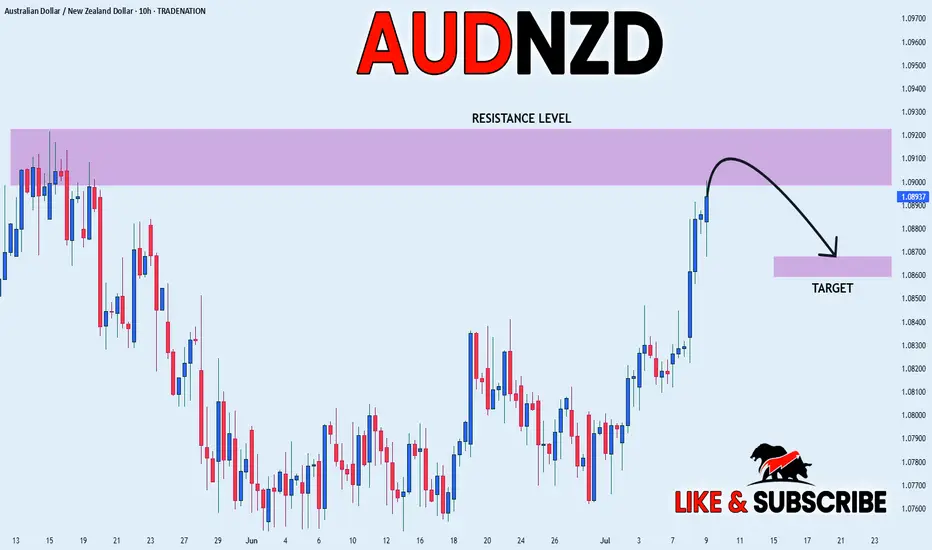
AUD_NZD SWING SHORT|
✅AUD_NZD has been growing recently
And the pair seems locally overbought
So as the pair is approaching a horizontal resistance of 1.0920
Price decline is to be expected
SHORT🔥
✅Like and subscribe to never miss a new idea!✅
Disclosure: I am part of Trade Nation's Influencer program and receive a monthly fee for using their TradingView charts in my analysis.
AUD-JPY Bullish Breakout! Buy!
Hello,Traders!
AUD-JPY is trading in a
Strong uptrend and the pair
Made a bullish breakout of
The key horizontal level
Of 95.650 which is now a
Support and the breakout
Is confirmed so we are bullish
Biased and we will be expecting
A further bullish move up
Buy!
Comment and subscribe to help us grow!
Check out other forecasts below too!
Disclosure: I am part of Trade Nation's Influencer program and receive a monthly fee for using their TradingView charts in my analysis.
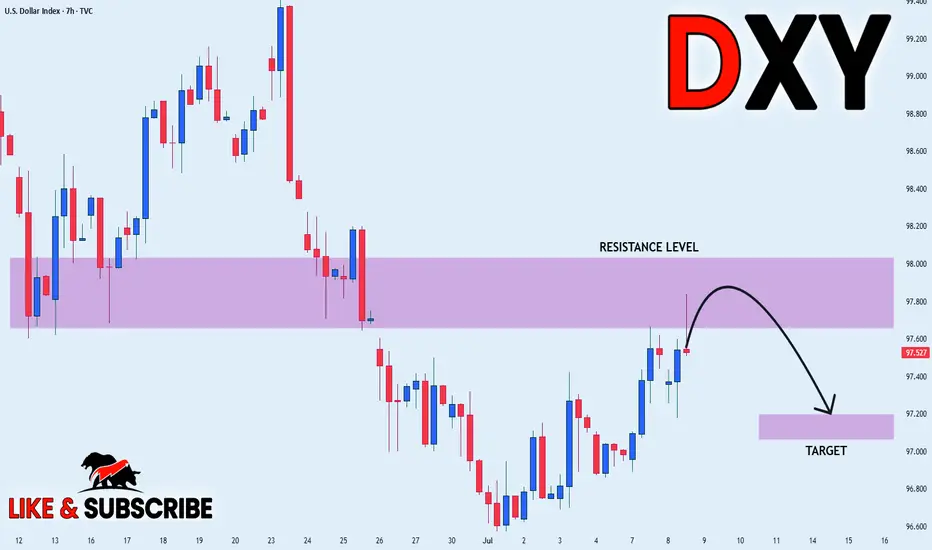
DXY LOCAL SHORT|
✅DXY is about to retest a key structure level of 98.000
Which implies a high likelihood of a move down
As some market participants will be taking profit from long positions
While others will find this price level to be good for selling
So as usual we will have a chance to ride the wave of a bearish correction
SHORT🔥
✅Like and subscribe to never miss a new idea!✅
Disclosure: I am part of Trade Nation's Influencer program and receive a monthly fee for using their TradingView charts in my analysis.
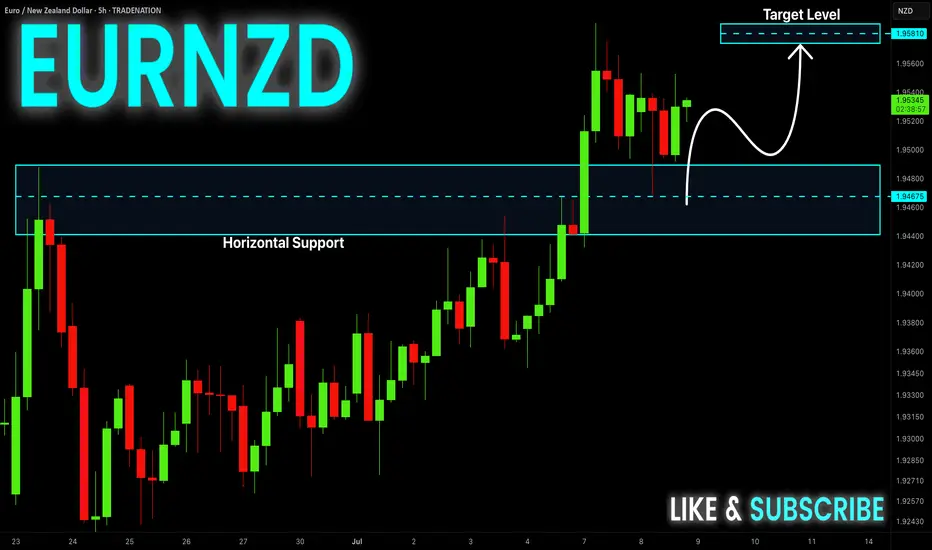
EUR-NZD Will Keep Growing! Buy!
Hello,Traders!
EUR-NZD keeps growing in a
Strong uptrend and the pair
Made a retest and a rebound
From the horizontal support
Of 1.9480 so we are bullish
Biased and we will be expecting
A further bullish move up
Buy!
Comment and subscribe to help us grow!
Check out other forecasts below too!
Disclosure: I am part of Trade Nation's Influencer program and receive a monthly fee for using their TradingView charts in my analysis.
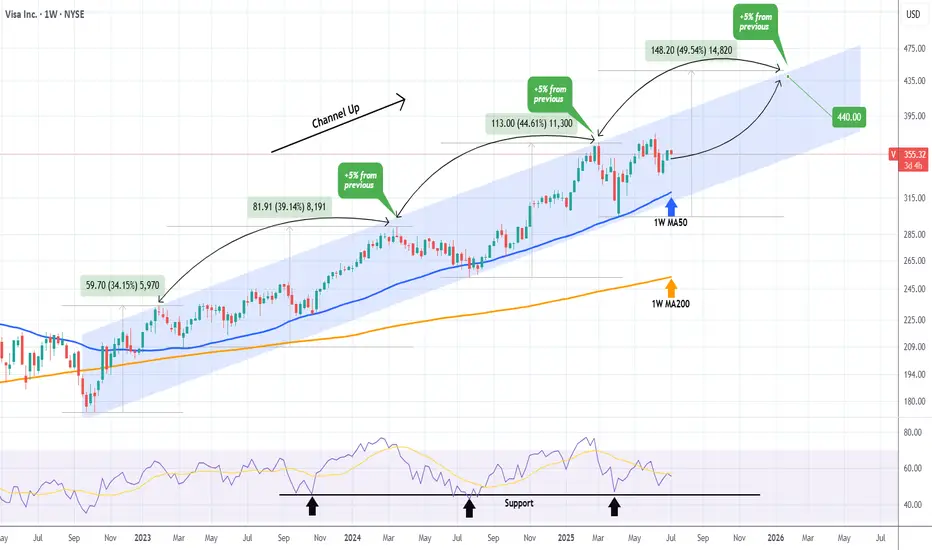
VISA on a strong Bullish Leg targeting $440.Visa Inc. (V) has been trading within a Channel Up pattern since the October 10 2022 market bottom. After December 2022, every test of the 1W MA50 (blue trend-line) has been the most optimal long-term buy opportunity, being also a Higher Low (bottom) of the pattern.
Every Bullish Leg has been +5% stronger than the previous, which leads us to believe that the current Bullish Leg will peak at around +49.50% (+5% from +44.60%). This translates to $440 Target towards the end of the year.
-------------------------------------------------------------------------------
** Please LIKE 👍, FOLLOW ✅, SHARE 🙌 and COMMENT ✍ if you enjoy this idea! Also share your ideas and charts in the comments section below! This is best way to keep it relevant, support us, keep the content here free and allow the idea to reach as many people as possible. **
-------------------------------------------------------------------------------
💸💸💸💸💸💸
👇 👇 👇 👇 👇 👇
DAX: Target Is Up! Long!
My dear friends,
Today we will analyse DAX together☺️
The in-trend continuation seems likely as the current long-term trend appears to be strong, and price is holding above a key level of 24,193.11 So a bullish continuation seems plausible, targeting the next high. We should enter on confirmation, and place a stop-loss beyond the recent swing level.
❤️Sending you lots of Love and Hugs❤️

GOLD: Move Up Expected! Long!
My dear friends,
Today we will analyse GOLD together☺️
The market is at an inflection zone and price has now reached an area around 3,298.60 where previous reversals or breakouts have occurred.And a price reaction that we are seeing on multiple timeframes here could signal the next move up so we can enter on confirmation, and target the next key level of 3,312.65.Stop-loss is recommended beyond the inflection zone.
❤️Sending you lots of Love and Hugs❤️
SILVER: Local Bearish Bias! Short!
My dear friends,
Today we will analyse SILVER together☺️
The price is near a wide key level
and the pair is approaching a significant decision level of 36.435 Therefore, a strong bearish reaction here could determine the next move down.We will watch for a confirmation candle, and then target the next key level of 36.336..Recommend Stop-loss is beyond the current level.
❤️Sending you lots of Love and Hugs❤️
EURUSD: Absolute Price Collapse Ahead! Short!
My dear friends,
Today we will analyse EURUSD together☺️
The recent price action suggests a shift in mid-term momentum. A break below the current local range around 1.17083 will confirm the new direction downwards with the target being the next key level of 1.16863.and a reconvened placement of a stop-loss beyond the range.
❤️Sending you lots of Love and Hugs❤️
US tariff deadline, GOLD expected to fluctuate very stronglyInvestors will be keeping an eye on tariff news from Washington this week as the temporary suspension of punitive import duties is set to expire. If trade tensions do not escalate further after Wednesday’s deadline, that could be good for the market, while downside risks are also a negative for OANDA:XAUUSD in particular.
News Around US Tariffs
To avoid higher tariffs, negotiators from more than a dozen major US trading partners are racing against time to negotiate with the Trump administration, trying to reach a deal before July 9. Trump and his team have continued to apply pressure in recent days.
Trump announced a deal with Vietnam to lower the 20% tariffs he had promised on many Vietnamese exports, while talks with Japan, the United States’ most important ally in Asia and sixth-largest trading partner, appeared to be stalled, even as Washington hinted it was close to a deal with India.
In data
Nonfarm payrolls data released Thursday showed the U.S. added 147,000 jobs in June, beating market expectations, and the unemployment rate fell to 4.1%.
Despite the slowdown in private-sector hiring, the overall strong report prompted markets to lower expectations for a Federal Reserve rate cut in July.
According to the CME FedWatch Tool, the probability of a rate cut has dropped sharply from 24% to 4.7%. Fed Chairman Powell reiterated that the central bank will not ease its stance until there are more signs of cooling in employment and inflation.
Personal Comments
The market is following a number of factors:
On the one hand, there is a countdown to Trump's "final blow" on tariffs, and on the other hand, the non-farm data has poured cold water once again. As the Fed's stance fluctuates, the US Dollar faces a tug-of-war between long and short positions, while gold continues to stabilize technically or has had significant price increases. July 9 of this month could be a key moment to really test the sustainability of gold in this recovery.
Technical Outlook Analysis OANDA:XAUUSD
Gold has recovered significantly over the past week, since finding support from the $3,250 area, but the temporary recovery is still limited by the EMA21 followed by the 0.236% Fibonacci retracement level.
However, sustained price action above the $3,300 raw price point should be viewed as a positive signal as it helps gold stabilize within the price channel.
If gold rises and breaks above the 0.236% Fibonacci retracement level, it will be eligible to continue rising with a short-term target of around $3,400 rather than a horizontal resistance of $3,430.
The indecision sentiment is shown by the RSI activity, which is mostly moving around the 50 level. RSI above 50 is considered a positive signal, while RSI below 50 is considered a negative signal, but gold is currently in the middle of this point.
Overall, gold has not yet had a short-term trend, but in the long-term, gold prices are still in an upward trend, which is noted by the price channel.
Finally, the notable positions will be listed as follows.
Support: 3,300 – 3,292 – 3,250USD
Resistance: 3,350 – 3,371 – 3,400USD
SELL XAUUSD PRICE 3334 - 3332⚡️
↠↠ Stop Loss 3338
→Take Profit 1 3326
↨
→Take Profit 2 3320
BUY XAUUSD PRICE 3275 - 3277⚡️
↠↠ Stop Loss 3271
→Take Profit 1 3283
↨
→Take Profit 2 3289
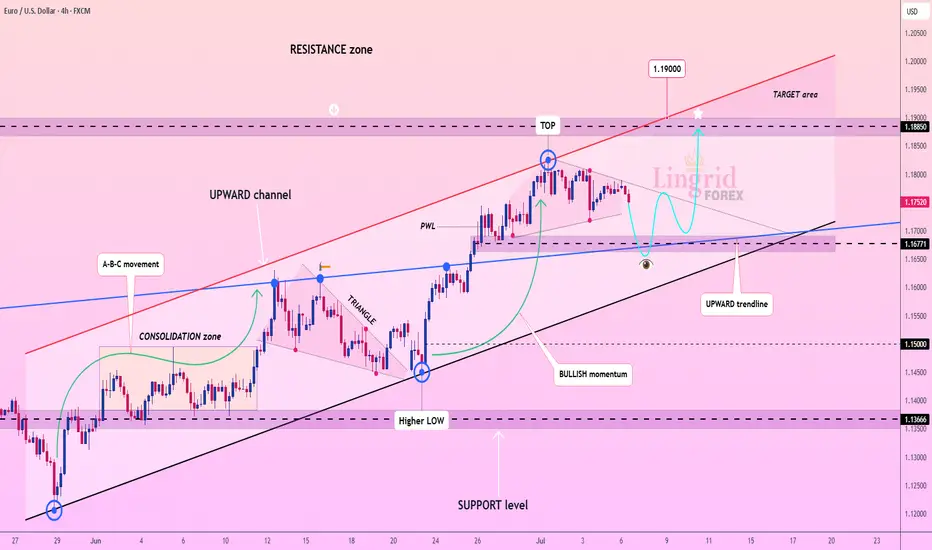
Lingrid | EURUSD Bullish Trend ContinuesFX:EURUSD is holding a bullish structure inside an upward channel after bouncing from the 1.1670 demand zone. The current retracement appears corrective, and buyers may step in again near the confluence of the trendline and horizontal support. If confirmed, the price is expected to push toward the 1.1885 resistance and the upper channel target at 1.1900.
📈 Key Levels
Buy zone: 1.1650–1.1680 (trendline + key support)
Sell trigger: break below 1.1600
Target: 1.1885 – 1.1900 zone
Buy trigger: bullish reversal candle near 1.1700
💡 Risks
Failure to hold trendline support could lead to deeper retracement
1.1885 may cap upside if momentum fades
Bearish divergence could emerge if price surges too fast
If this idea resonates with you or you have your own opinion, traders, hit the comments. I’m excited to read your thoughts!
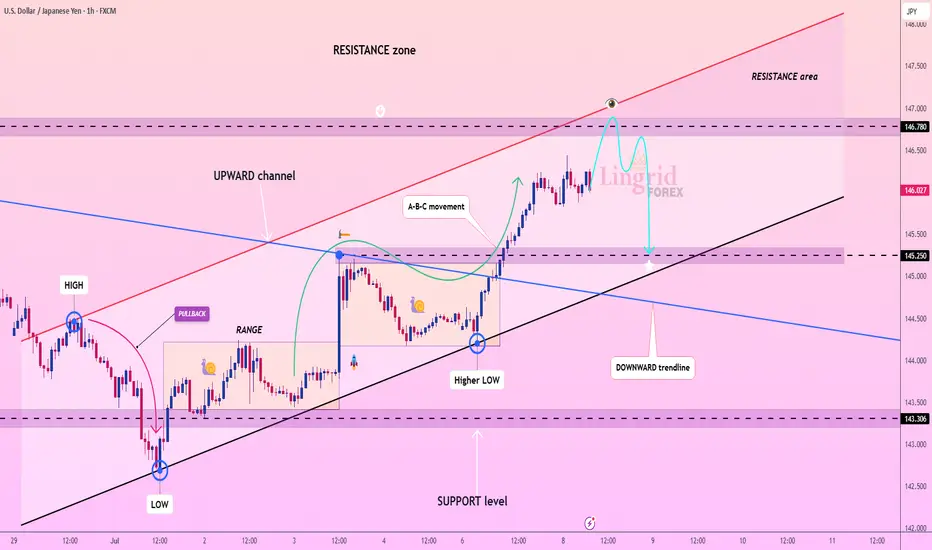
Lingrid | USDJPY Pullback From the Key Resistance ZoneThe price perfectly fulfilled my previous idea . FX:USDJPY is moving inside an upward channel after reclaiming support near 145.25 and breaking out from its previous range. The pair printed a higher low and is now approaching resistance around 146.78, testing the upper boundary of the ascending channel. If it fails to break through the red resistance trendline, a retracement toward the 145.25–145.00 support is likely.
📈 Key Levels
Buy zone: 146.78 - 147.00
Sell trigger: rejection from 146.78 and lower high below resistance
Target: 145.25
Buy trigger: bullish breakout above 147.00 with momentum confirmation
💡 Risks
Price rejection near 146.78 may cause a sharp pullback
A surge above 147.00 breaks trendline structure
Market reaction to macro data could distort short-term pattern
If this idea resonates with you or you have your own opinion, traders, hit the comments. I’m excited to read your thoughts!
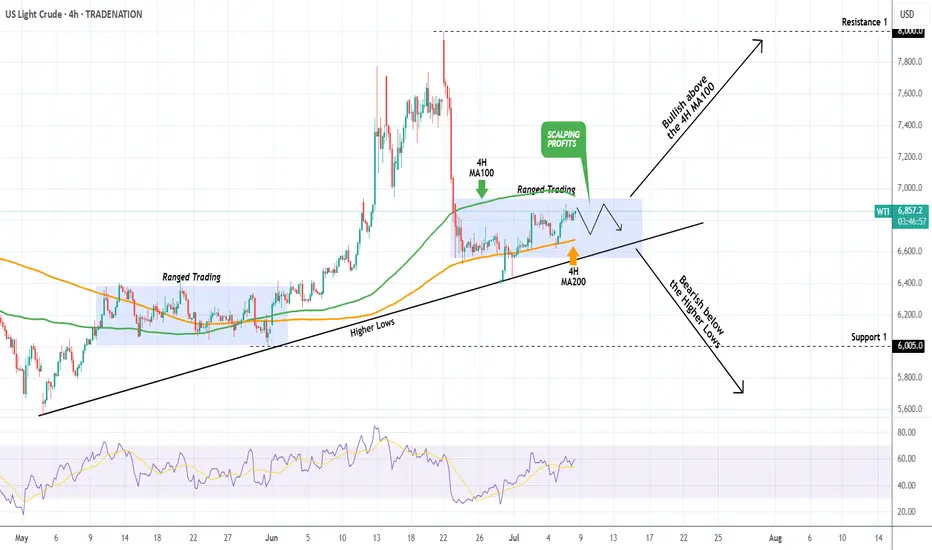
WTI OIL Best scalping opportunity at the moment!WTI Oil (USOIL) has been consolidating inside a ranged trading set-up, with the 4H MA100 (green trend-line) as its Resistance and the 4H MA200 (orange trend-line) as its Support.
We saw this previously from May 13 to June 01 and it presents the best scaling opportunity in the market at the moment. That previous Ranged Trading pattern eventually broke upwards as the Higher Lows trend-line held.
As a result, after you get your scalping profits within this range, look for a clear break-out above the 4H MA100 (candle closing) in order to go long (Resistance 1) or a break-out below the Higher Lows (candle closing) in order to go short (Support 1).
-------------------------------------------------------------------------------
** Please LIKE 👍, FOLLOW ✅, SHARE 🙌 and COMMENT ✍ if you enjoy this idea! Also share your ideas and charts in the comments section below! This is best way to keep it relevant, support us, keep the content here free and allow the idea to reach as many people as possible. **
-------------------------------------------------------------------------------
Disclosure: I am part of Trade Nation's Influencer program and receive a monthly fee for using their TradingView charts in my analysis.
💸💸💸💸💸💸
👇 👇 👇 👇 👇 👇
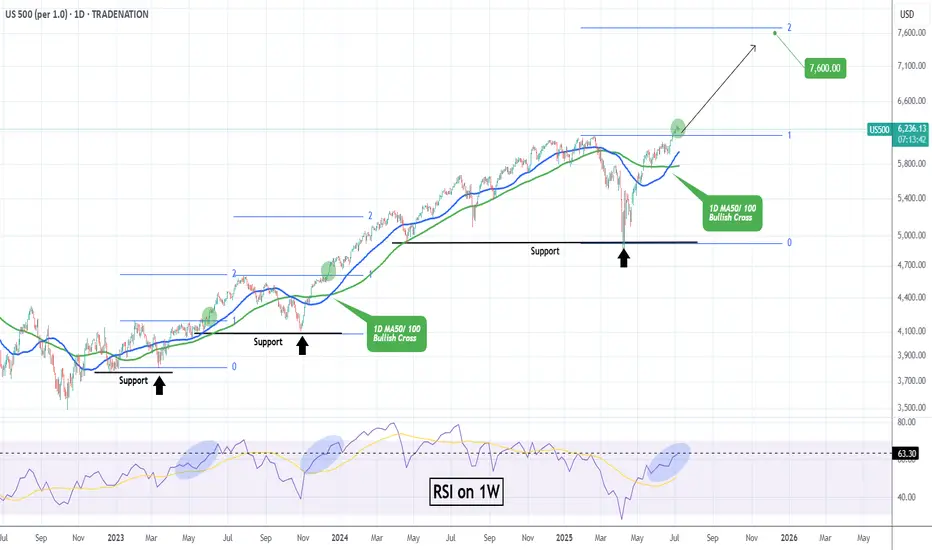
S&P500 Strong Buy Signal flashed for the 3rd time in 2 years!The S&500 index (SPX) is comfortably trading above its previous All Time High (ATH) and shows no signs of stopping here. Coming off a 1D MA50/ 100 Bullish Cross, we expect the 1D MA50 (blue trend-line) to turn now into the first long-term Support going towards the end of the year.
The last 1D MA50/ 100 Bullish Cross (December 15 2023) was nothing but a bullish continuation signal, which extended the uptrend all the way to the 2.0 Fibonacci extension, before a pull-back test of the 1D MA100 (green trend-line) again.
The 1W RSI is now on the same level (63.30) it was then. In fact it is also on the same level it was on June 05 2023, which was another such bullish continuation signal that peaked on the 2.0 Fib ext.
This suggests that we have a rare long-term Buy Signal in our hands, only the 3rd time in 2 years that has emerged. Based on that, we should be expecting to see 7600 as the next Target before it hits the 2.0 Fib ext and pulls back to the 1D MA100 again and there is certainly enough time to do this by the end of the year, assuming the macroeconomic environment favors (trade deals, potential Fed Rate cuts etc).
-------------------------------------------------------------------------------
** Please LIKE 👍, FOLLOW ✅, SHARE 🙌 and COMMENT ✍ if you enjoy this idea! Also share your ideas and charts in the comments section below! This is best way to keep it relevant, support us, keep the content here free and allow the idea to reach as many people as possible. **
-------------------------------------------------------------------------------
Disclosure: I am part of Trade Nation's Influencer program and receive a monthly fee for using their TradingView charts in my analysis.
💸💸💸💸💸💸
👇 👇 👇 👇 👇 👇
Trading balanceTrading balance The price of the asset has rebounded from the balance zone. With the prospect of growth into the resistance zone.
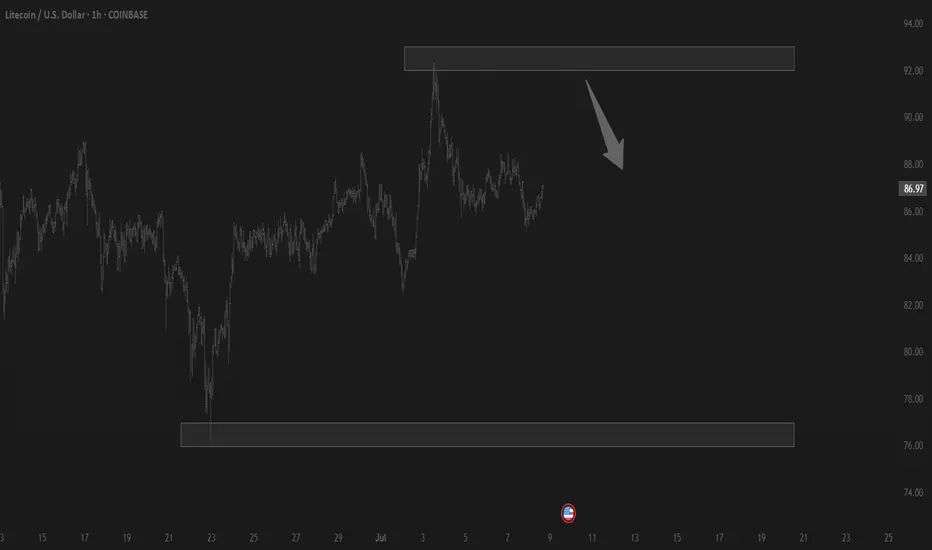
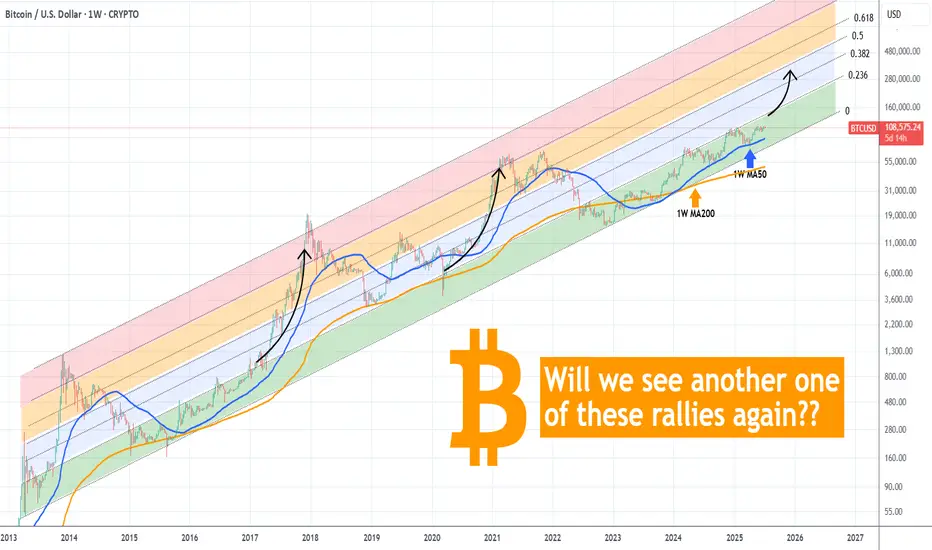
BITCOIN Is there enough time for another parabolic rally?Bitcoin (BTCUSD) is practically consolidating on the short-term, having just recently been rejected off its new All Time High (ATH). Despite the short-term volatility, the long-term outlook is still a very strong, structured uptrend, a Channel Up pattern that is now technically aiming for its next Higher High.
Incredibly enough, this Channel Up since the November 2022 market bottom, has been almost entirely within the Buy Zone (green) of the Fibonacci Channel Up going back all the way to April 2013!
As you can see during the previous two Cycles, every time BTC got above that Buy Zone, it started a parabolic rally. So far, we haven't got such rally on the current Cycle and with time running out (assuming the 4-year Cycle model continues to hold), do you think we will get one this time around?
Feel free to let us know in the comments section below!
-------------------------------------------------------------------------------
** Please LIKE 👍, FOLLOW ✅, SHARE 🙌 and COMMENT ✍ if you enjoy this idea! Also share your ideas and charts in the comments section below! This is best way to keep it relevant, support us, keep the content here free and allow the idea to reach as many people as possible. **
-------------------------------------------------------------------------------
💸💸💸💸💸💸
👇 👇 👇 👇 👇 👇
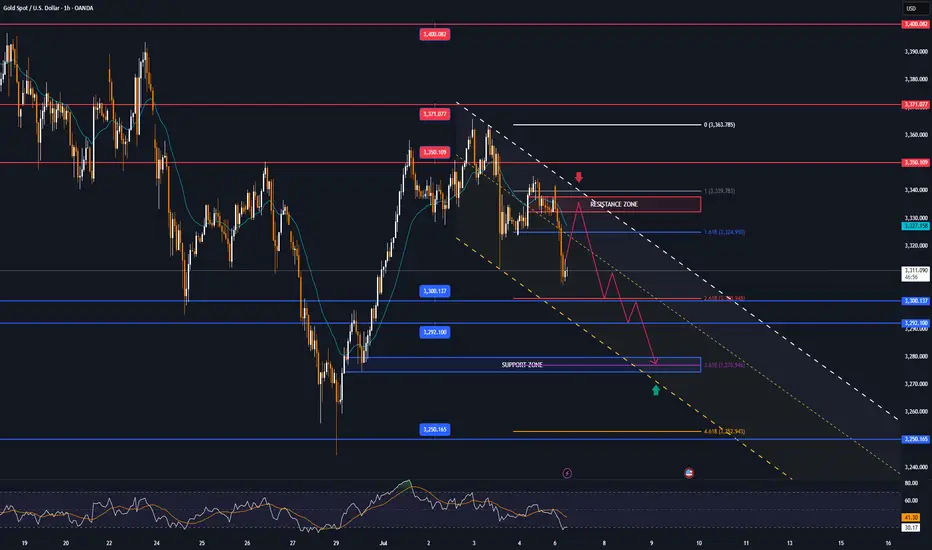
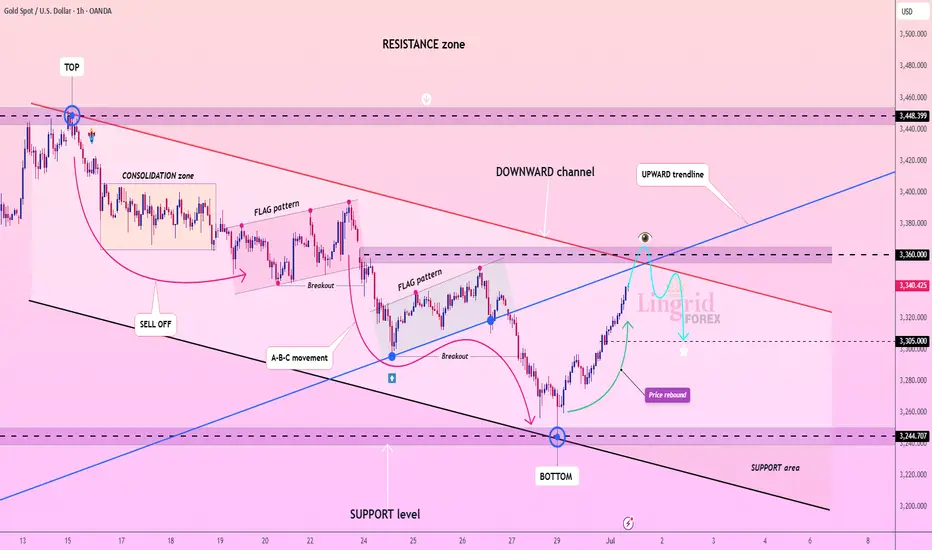
Lingrid | GOLD Shorting Opportunity at Confluence ResistanceOANDA:XAUUSD is approaching the key resistance near 3360 after rebounding from the 3245 support level and breaking out of the downward channel. Price is now testing the upward trendline from below, intersecting with the red descending trendline and horizontal resistance. If this confluence zone rejects the rally, a return toward 3305 or lower is likely, forming a potential bearish retest.
📉 Key Levels
Sell zone: 3350–3360
Buy trigger: breakout above 3360 with close above 3375
Target: 3305
Sell trigger: rejection from 3360 and break of 3340
⚠️ Risks
Break and retest of 3360 may invalidate short setup
Volatility around red trendline could trigger fakeouts
Demand near 3305 may cause sharp bounces if sellers stall
If this idea resonates with you or you have your own opinion, traders, hit the comments. I’m excited to read your thoughts!
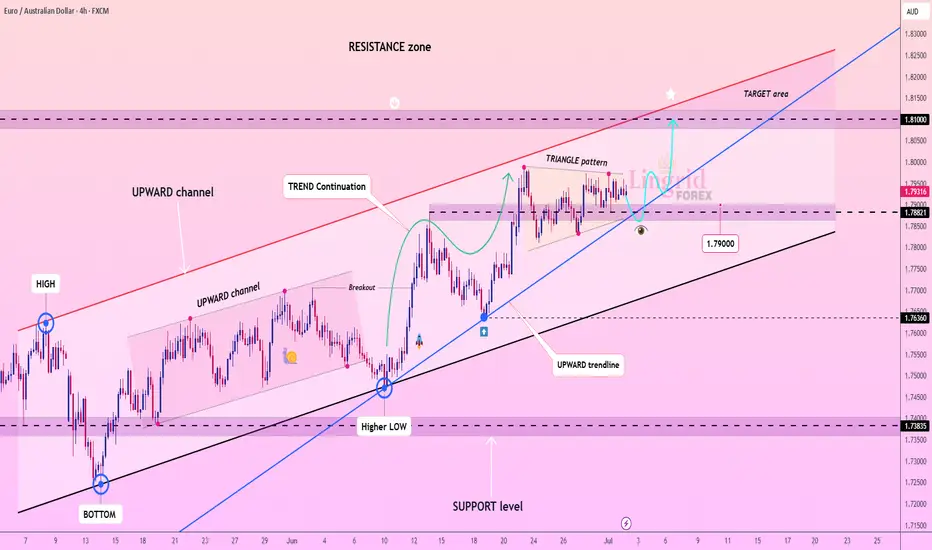
Lingrid | EURAUD Trend Continuation Pattern FX:EURAUD is maintaining bullish momentum within a broad upward channel after bouncing from the 1.7900 support zone and forming a triangle continuation pattern. Price is coiling just below the 1.8000 handle and the red resistance boundary of the channel. A confirmed breakout above 1.8000 could open the path toward the 1.8100 target area, extending the broader bullish structure.
📈 Key Levels
Buy zone: 1.7880–1.7900
Sell trigger: breakdown below 1.7880
Target: 1.8100
Buy trigger: breakout and retest of 1.8000–1.8020 zone
💡 Risks
Rejection from 1.8000 resistance could trigger a pullback
Break below the blue trendline may invalidate bullish setup
Low momentum breakout may stall below 1.8050
If this idea resonates with you or you have your own opinion, traders, hit the comments. I’m excited to read your thoughts!
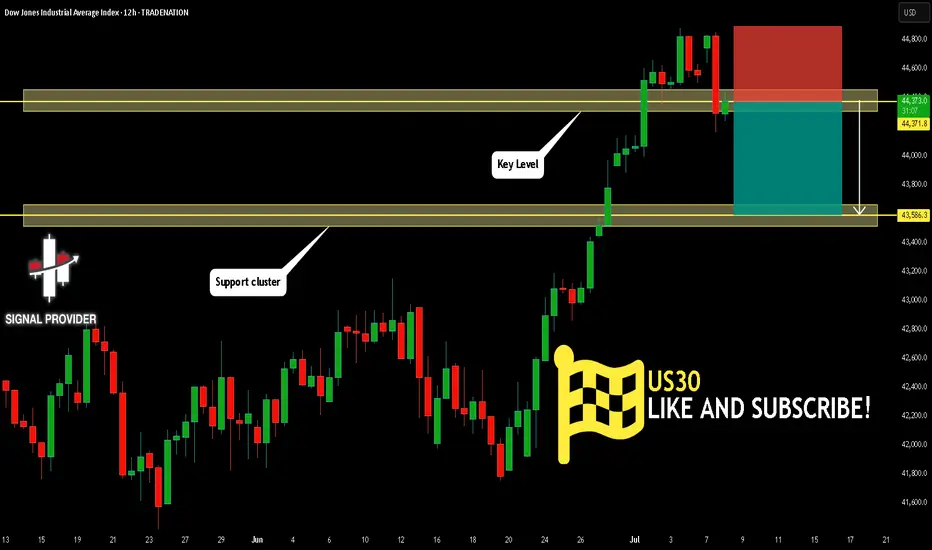
US30 Is Bearish! Sell!
Please, check our technical outlook for US30.
Time Frame: 12h
Current Trend: Bearish
Sentiment: Overbought (based on 7-period RSI)
Forecast: Bearish
The price is testing a key resistance 44,371.8.
Taking into consideration the current market trend & overbought RSI, chances will be high to see a bearish movement to the downside at least to 43,586.3 level.
P.S
Please, note that an oversold/overbought condition can last for a long time, and therefore being oversold/overbought doesn't mean a price rally will come soon, or at all.
Disclosure: I am part of Trade Nation's Influencer program and receive a monthly fee for using their TradingView charts in my analysis.
Like and subscribe and comment my ideas if you enjoy them!
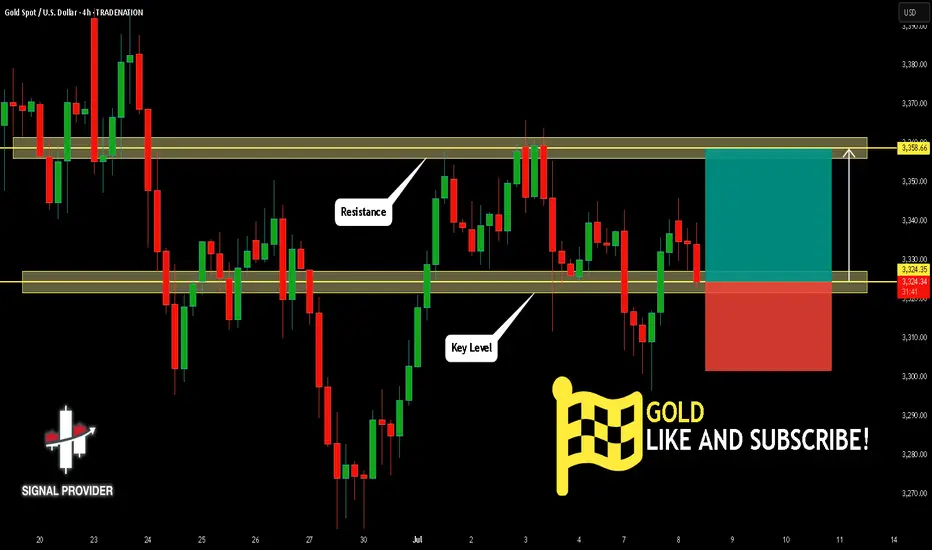
GOLD Is Very Bullish! Long!
Here is our detailed technical review for GOLD.
Time Frame: 4h
Current Trend: Bullish
Sentiment: Oversold (based on 7-period RSI)
Forecast: Bullish
The market is trading around a solid horizontal structure 3,324.35.
The above observations make me that the market will inevitably achieve 3,358.66 level.
P.S
The term oversold refers to a condition where an asset has traded lower in price and has the potential for a price bounce.
Overbought refers to market scenarios where the instrument is traded considerably higher than its fair value. Overvaluation is caused by market sentiments when there is positive news.
Disclosure: I am part of Trade Nation's Influencer program and receive a monthly fee for using their TradingView charts in my analysis.
Like and subscribe and comment my ideas if you enjoy them!
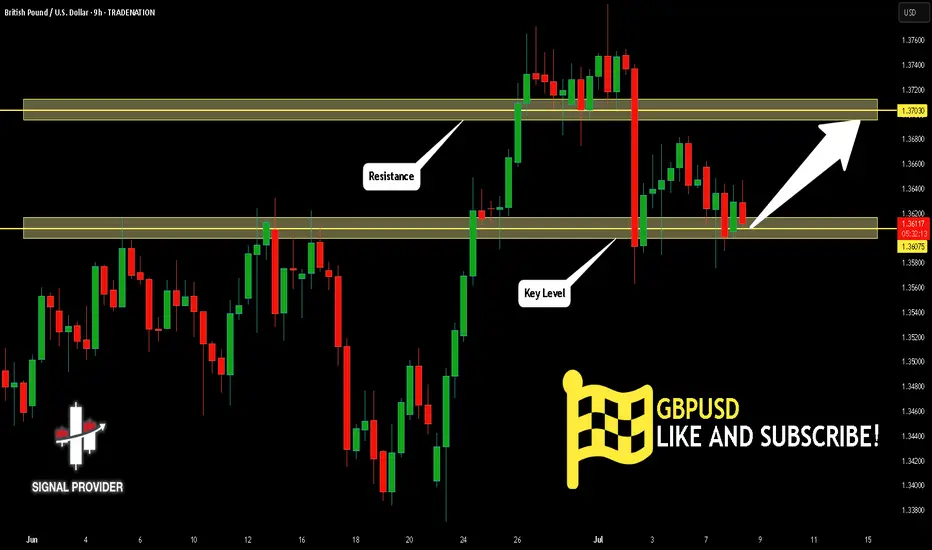
GBPUSD Is Going Up! Buy!
Take a look at our analysis for GBPUSD.
Time Frame: 9h
Current Trend: Bullish
Sentiment: Oversold (based on 7-period RSI)
Forecast: Bullish
The market is testing a major horizontal structure 1.360.
Taking into consideration the structure & trend analysis, I believe that the market will reach 1.370 level soon.
P.S
We determine oversold/overbought condition with RSI indicator.
When it drops below 30 - the market is considered to be oversold.
When it bounces above 70 - the market is considered to be overbought.
Disclosure: I am part of Trade Nation's Influencer program and receive a monthly fee for using their TradingView charts in my analysis.
Like and subscribe and comment my ideas if you enjoy them!