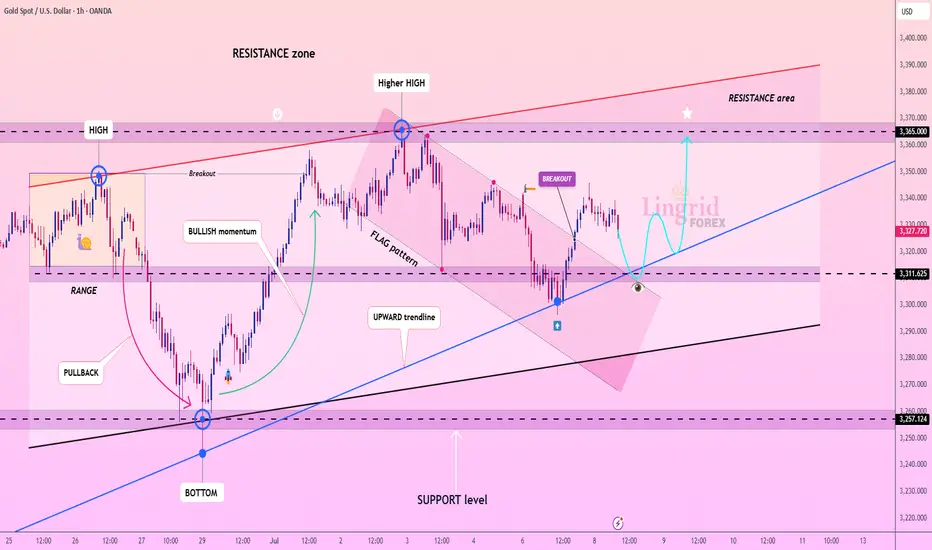
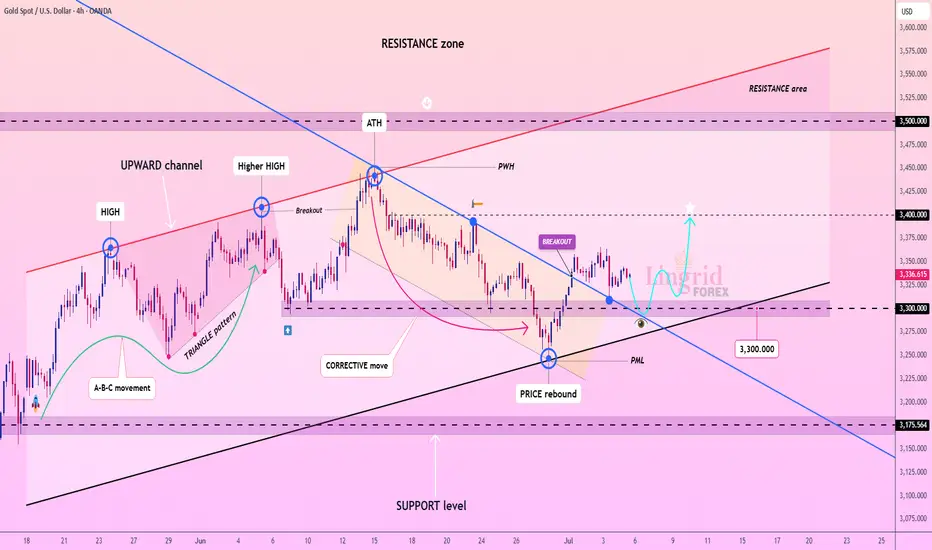
Lingrid | GOLD Breakout of Trend Continuation PatternThe price perfectly fulfilled my last idea . FX:XAUUSD is forming a bullish base just above the upward trendline and key support near 3,310, showing signs of price compression within a flag continuation pattern. After the recent pullback, the market is holding structure and coiling for a potential breakout toward the 3,365 resistance. If price rebounds from the confluence zone, it would signal bullish continuation with upside momentum building.
📈 Key Levels
Buy zone: 3,305–3,310 support confluence
Buy trigger: break and close above 3,340 minor structure
Target: 3,365–3,370 resistance zone
Sell invalidation: break below 3,290
💡 Risks
Breakdown below the flag may turn structure bearish
Weak volume on breakout could result in fakeout
Resistance at 3,365 may reject price on first test
If this idea resonates with you or you have your own opinion, traders, hit the comments. I’m excited to read your thoughts!
Signals
EURO/USD SELL SETUP "Euro/USD Potential Sell Zone: Price approaching key resistance at 1.17634,to 1.17735 with a potential reversal in sight. Selling opportunity on the horizon? Target 1ratio 3 . Let's short the Euro! 📉💡 #EuroUSD #SellZone #ForexTrading"

Gold Reverses with a Pin Bar – Is the Drop Over?📈 What happened yesterday on Gold (XAU/USD)?
Gold had a tricky session – during the early hours it dipped just below 3300, testing support. But by the New York session, bulls stepped in strongly, pushing price back up and closing near the daily highs. The result? A strong daily Pin Bar with a long tail, signaling possible bullish reversal.
________________________________________
❓ Is the drop over, or will the market fake out again?
That's the big question now. Yesterday’s close definitely leans bullish, but we need to see confirmation.
________________________________________
📌 Why a continuation to the upside is possible:
• Price rejected sub-3300 levels pretty strongly.
• A daily Pin Bar formed, signaling buyer strength.
• A break above yesterday’s high would confirm bullish intent.
• 3390–3400 is the next key resistance zone on the radar.
________________________________________
🧠 My trading plan:
I closed my short near break-even – no need to fight the price action. Now I'm patiently waiting for a clean break above yesterday’s high to enter long trades, aiming for the 3390–3400 resistance area.
Disclosure: I am part of TradeNation's Influencer program and receive a monthly fee for using their TradingView charts in my analyses and educational articles.
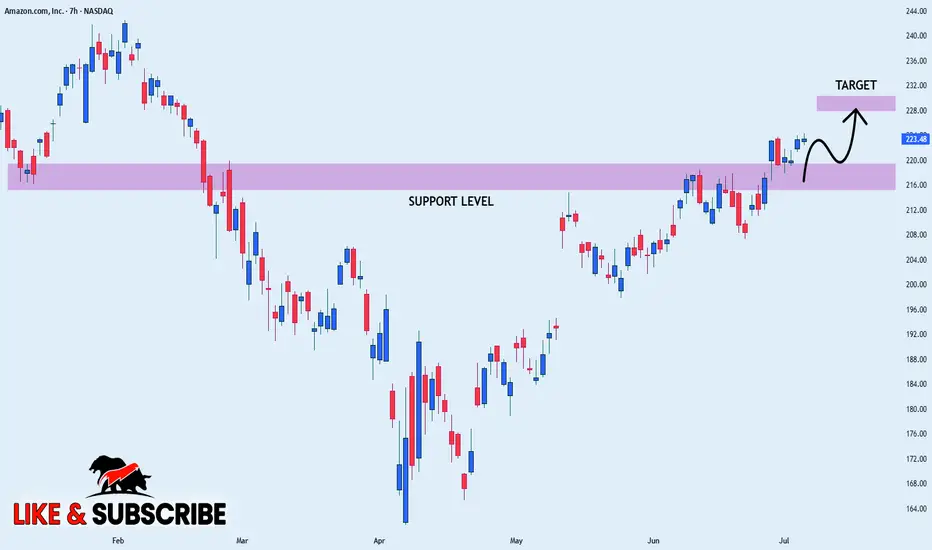
AMAZON STRONG UPTREND|LONG|
✅AMAZON is going up
Now and the stock made a bullish
Breakout of the key horizontal
Level of 220$ and the breakout
Is confirmed so we are bullish
Biased and we will be expecting
A further bullish move up
LONG🚀
✅Like and subscribe to never miss a new idea!✅
Disclosure: I am part of Trade Nation's Influencer program and receive a monthly fee for using their TradingView charts in my analysis.
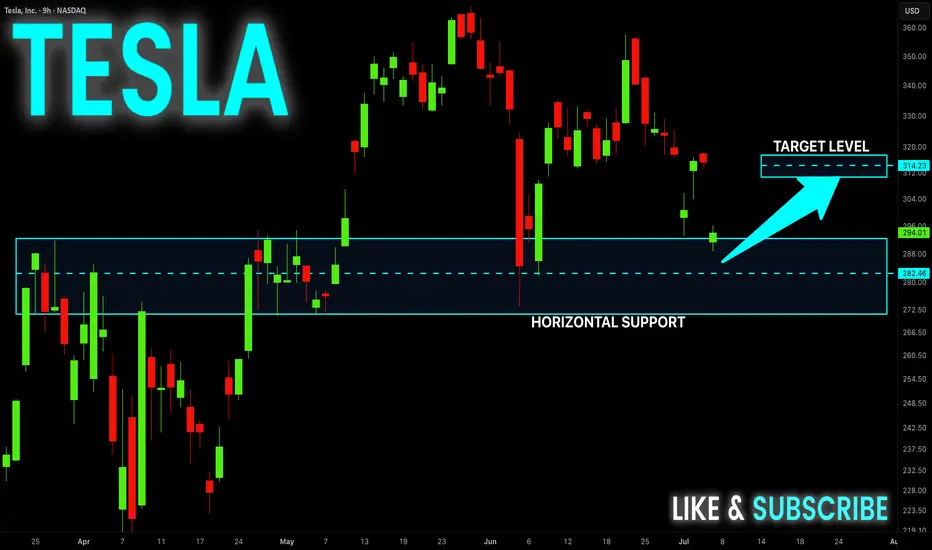
TESLA Reached The Support! Buy!
Hello,Traders!
TESLA gaped down on
Monday but the move was
Held up by a massive support
Area ending around 272$ and
As the support is strong we
Will be expecting a rebound and
A move up from the level
Buy!
Comment and subscribe to help us grow!
Check out other forecasts below too!
Disclosure: I am part of Trade Nation's Influencer program and receive a monthly fee for using their TradingView charts in my analysis.
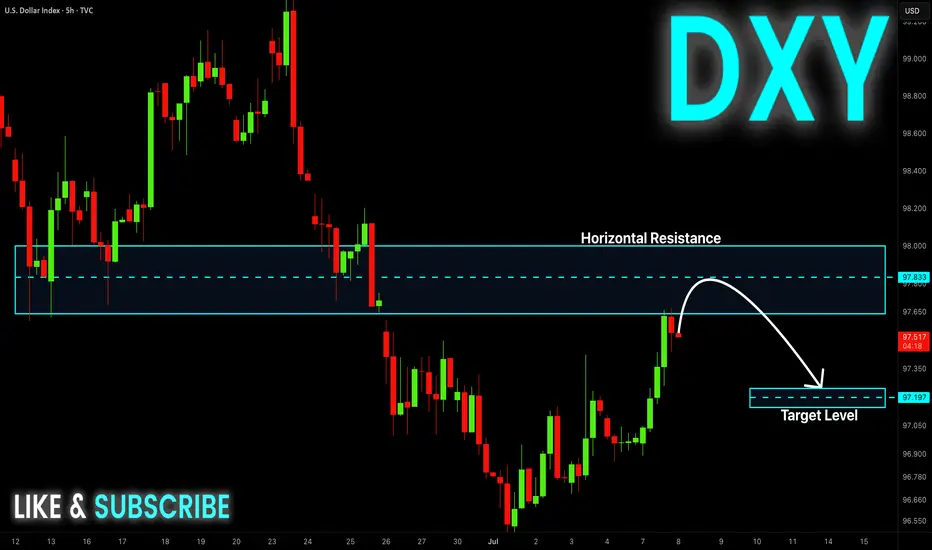
DXY Short From Resistance! Sell!
Hello,Traders!
DXY made a nice rebound
From the lows but will soon
Hit a horizontal resistance
Around 97.900 from where
We will be expecting a
Local bearish correction
Sell!
Comment and subscribe to help us grow!
Check out other forecasts below too!
Disclosure: I am part of Trade Nation's Influencer program and receive a monthly fee for using their TradingView charts in my analysis.
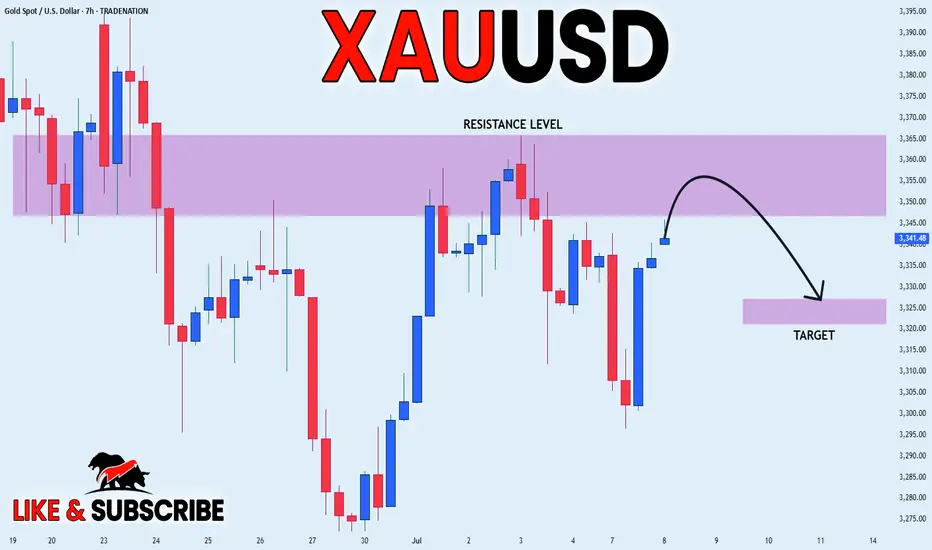
GOLD RESISTANCE AHEAD|SHORT|
✅GOLD is going up now
But a strong resistance level is ahead at 3360$
Thus I am expecting a pullback
And a move down towards the target of 3325$
SHORT🔥
✅Like and subscribe to never miss a new idea!✅
Disclosure: I am part of Trade Nation's Influencer program and receive a monthly fee for using their TradingView charts in my analysis.
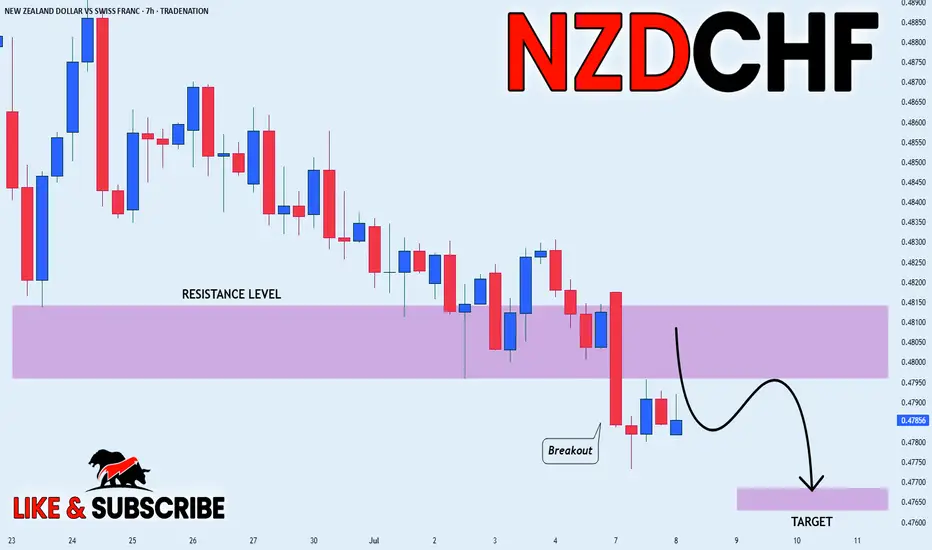
NZD_CHF BEARISH BREAKOUT|SHORT|
✅NZD_CHF keeps falling in
A strong downtrend and the pair
Made a bearish breakout and a
Retest of the key horizontal level
Of 0.4810 which is now a resistance
And the pair is already making a
Bearish pullback so we are
Bearish biased and we will be
Expecting a further bearish move down
SHORT🔥
✅Like and subscribe to never miss a new idea!✅
Disclosure: I am part of Trade Nation's Influencer program and receive a monthly fee for using their TradingView charts in my analysis.
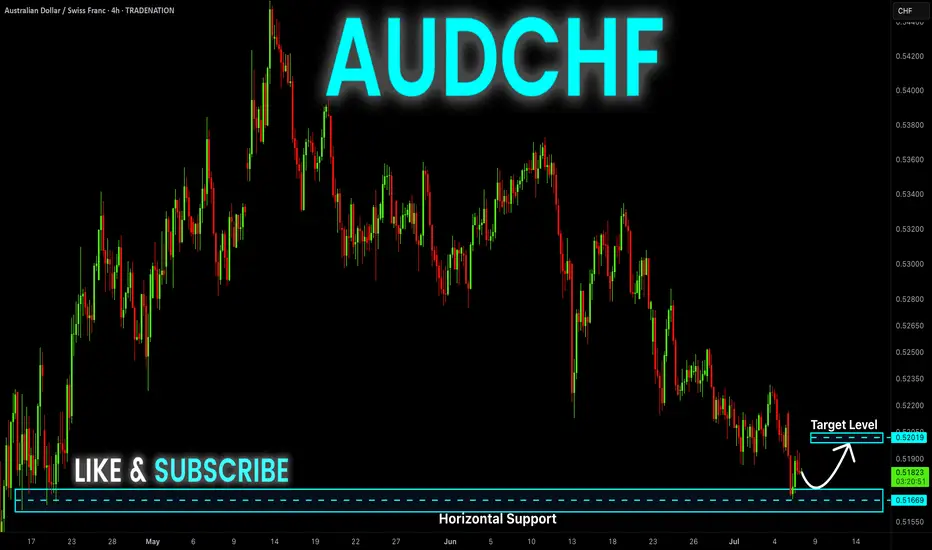
AUD-CHF Rebound Ahead! Buy!
Hello,Traders!
AUD-CHF keeps falling but
A horizontal support level
Is ahead around 0.5160
And as the pair is locally
Oversold we will be expecting
A local bullish rebound
Buy!
Comment and subscribe to help us grow!
Check out other forecasts below too!
Disclosure: I am part of Trade Nation's Influencer program and receive a monthly fee for using their TradingView charts in my analysis.
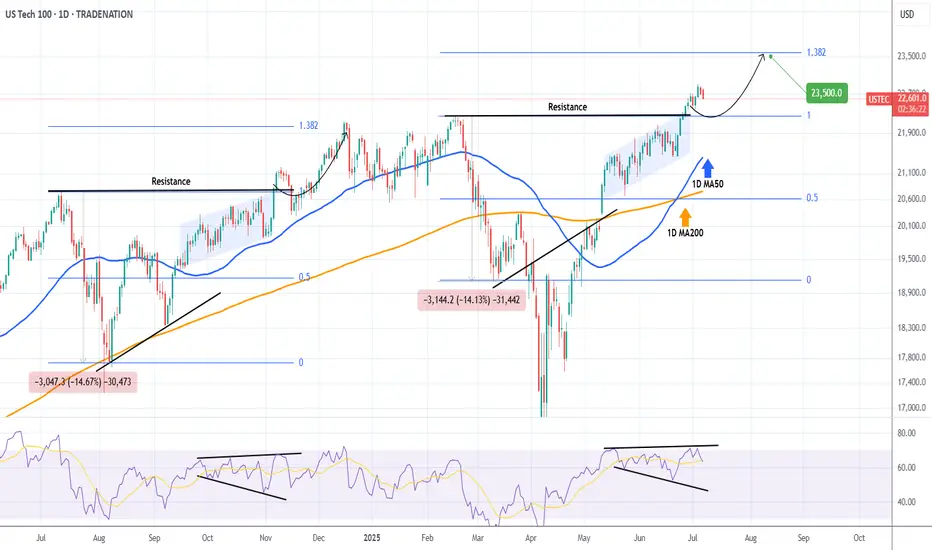
NASDAQ going to 23500 by August.Nasdaq (NDX) is trading above the previous All Time High (ATH) Resistance, staging a very structured uptrend that has recently gotten out of a 1D Golden Cross.
As long as the 1D MA50 (blue trend-line) continues to support, we might get a repeat of the November - December 2024 rally that peaked on the 1.382 Fibonacci extension level from he August 2024 Low.
That whole July - October 2024 pattern is quite similar to the February - June 2025 of today. A quick pull-back is possible at this stage but by the end of August, we expect the index to test at least the 23500 level.
-------------------------------------------------------------------------------
** Please LIKE 👍, FOLLOW ✅, SHARE 🙌 and COMMENT ✍ if you enjoy this idea! Also share your ideas and charts in the comments section below! This is best way to keep it relevant, support us, keep the content here free and allow the idea to reach as many people as possible. **
-------------------------------------------------------------------------------
Disclosure: I am part of Trade Nation's Influencer program and receive a monthly fee for using their TradingView charts in my analysis.
💸💸💸💸💸💸
👇 👇 👇 👇 👇 👇
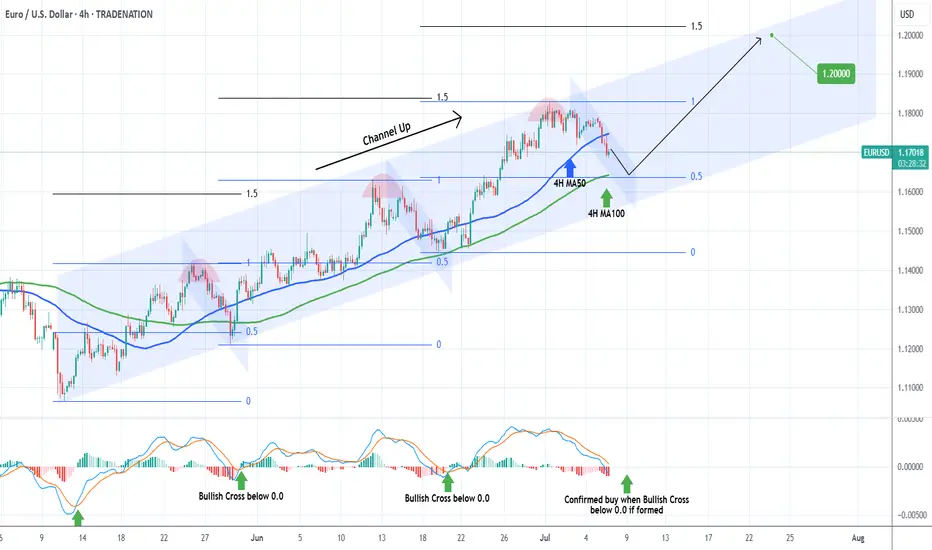
EURUSD Bounce on the 4H MA100 eyes 1.2000.The EURUSD pair has been trading within a Channel Up pattern since the May 12 Low. Right now it is expanding its 3rd Bearish Leg of this structure, with the previous two reaching at least either the 4H MA100 (green trend-line) or the 0.5 Fibonacci retracement level before rebounding.
As a result, we expect a rebound soon around the 1.16500 level to start the new Bullish Leg. The last two peaked on the 1.5 Fibonacci extension, which gives us a clear Target at 1.2000.
Notice also that every time the 4H MACD formed a Bullish Cross below the 0.0 mark, it was a confirmed buy signal. Use that to your advantage.
-------------------------------------------------------------------------------
** Please LIKE 👍, FOLLOW ✅, SHARE 🙌 and COMMENT ✍ if you enjoy this idea! Also share your ideas and charts in the comments section below! This is best way to keep it relevant, support us, keep the content here free and allow the idea to reach as many people as possible. **
-------------------------------------------------------------------------------
Disclosure: I am part of Trade Nation's Influencer program and receive a monthly fee for using their TradingView charts in my analysis.
💸💸💸💸💸💸
👇 👇 👇 👇 👇 👇
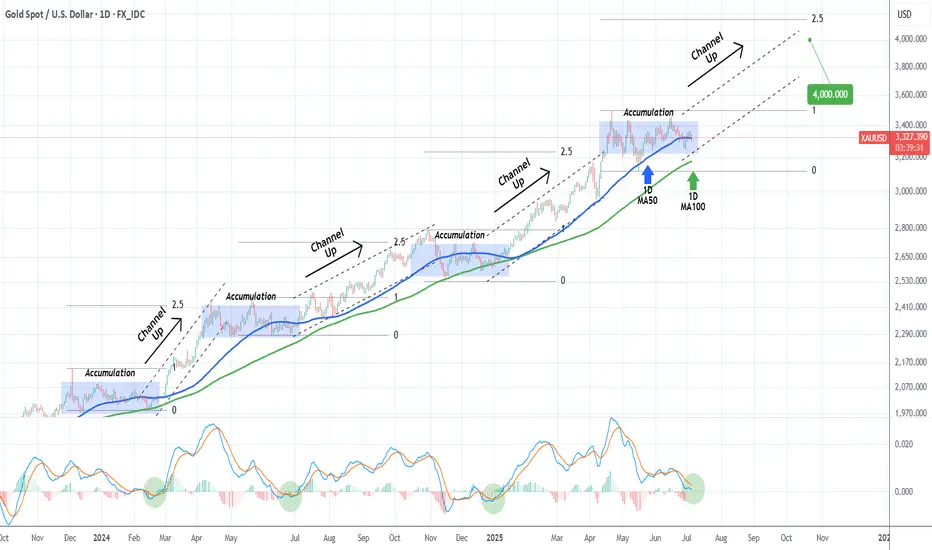
XAUUSD is getting ready to explode to $4000Gold (XAUUSD) is trading around its 1D MA50 (blue trend-line) having practically been accumulating since the April 22 High. Ever since the 1D MA100 (green trend-line) turned into a long-term Support (2023), Gold has experienced similar Accumulation Phases another 3 times.
On all of those occasions, the price broke out to the upside in the form of a Channel Up, reaching at least the 2.5 Fibonacci extension.
With the 1D MACD close to forming a Bullish Cross around the 0.0 mark, which is the level that always started the Channel Up during those 3 previous Accumulation Phases, we expect the market to start breaking upwards and towards the end of the year hit at least $4000.
-------------------------------------------------------------------------------
** Please LIKE 👍, FOLLOW ✅, SHARE 🙌 and COMMENT ✍ if you enjoy this idea! Also share your ideas and charts in the comments section below! This is best way to keep it relevant, support us, keep the content here free and allow the idea to reach as many people as possible. **
-------------------------------------------------------------------------------
💸💸💸💸💸💸
👇 👇 👇 👇 👇 👇
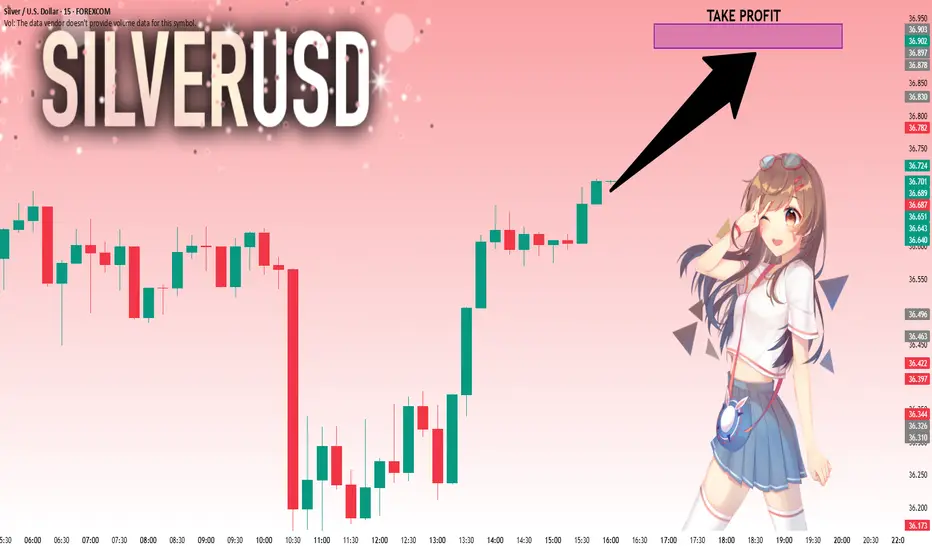
SILVER: Will Go Up! Long!
My dear friends,
Today we will analyse SILVER together☺️
The in-trend continuation seems likely as the current long-term trend appears to be strong, and price is holding above a key level of 36.696 So a bullish continuation seems plausible, targeting the next high. We should enter on confirmation, and place a stop-loss beyond the recent swing level.
❤️Sending you lots of Love and Hugs❤️
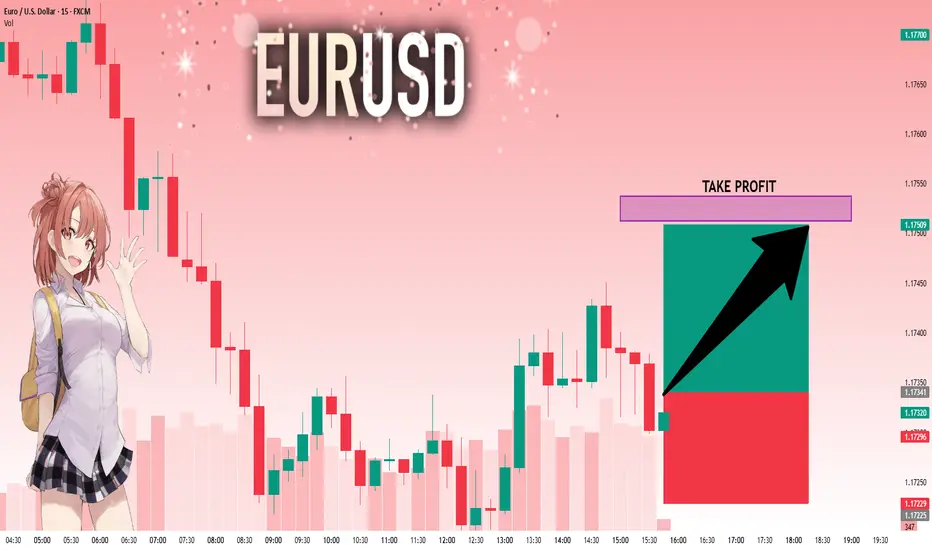
EURUSD: The Market Is Looking Up! Long!
My dear friends,
Today we will analyse EURUSD together☺️
The market is at an inflection zone and price has now reached an area around 1.17341 where previous reversals or breakouts have occurred.And a price reaction that we are seeing on multiple timeframes here could signal the next move up so we can enter on confirmation, and target the next key level of 1.17512.Stop-loss is recommended beyond the inflection zone.
❤️Sending you lots of Love and Hugs❤️
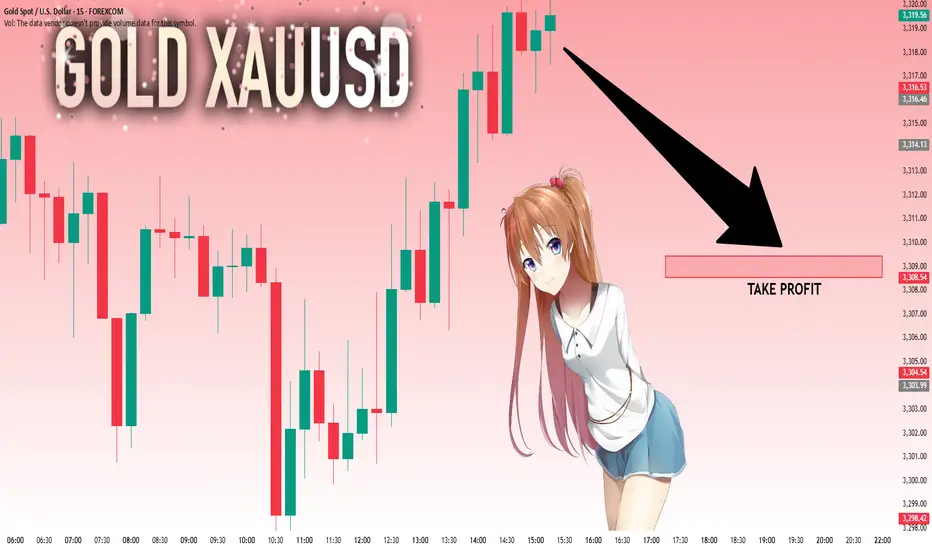
GOLD: Strong Bullish Sentiment! Long!
My dear friends,
Today we will analyse GOLD together☺️
The price is near a wide key level
and the pair is approaching a significant decision level of 3,317.31 Therefore, a strong bullish reaction here could determine the next move up.We will watch for a confirmation candle, and then target the next key level of 3,309.44.Recommend Stop-loss is beyond the current level.
❤️Sending you lots of Love and Hugs❤️
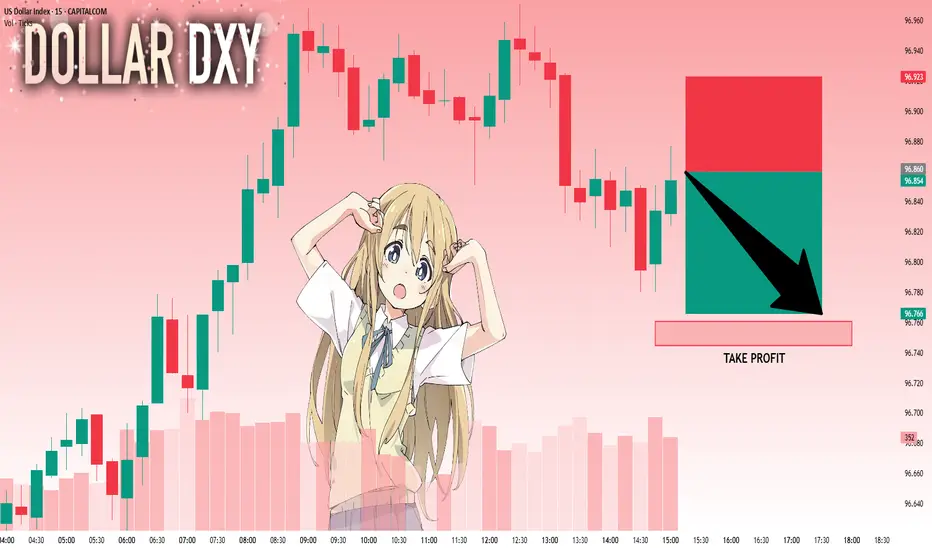
DXY: Bears Are Winning! Short!
My dear friends,
Today we will analyse DXY together☺️
The recent price action suggests a shift in mid-term momentum. A break below the current local range around 96.860 will confirm the new direction downwards with the target being the next key level of 96.760.and a reconvened placement of a stop-loss beyond the range.
❤️Sending you lots of Love and Hugs❤️
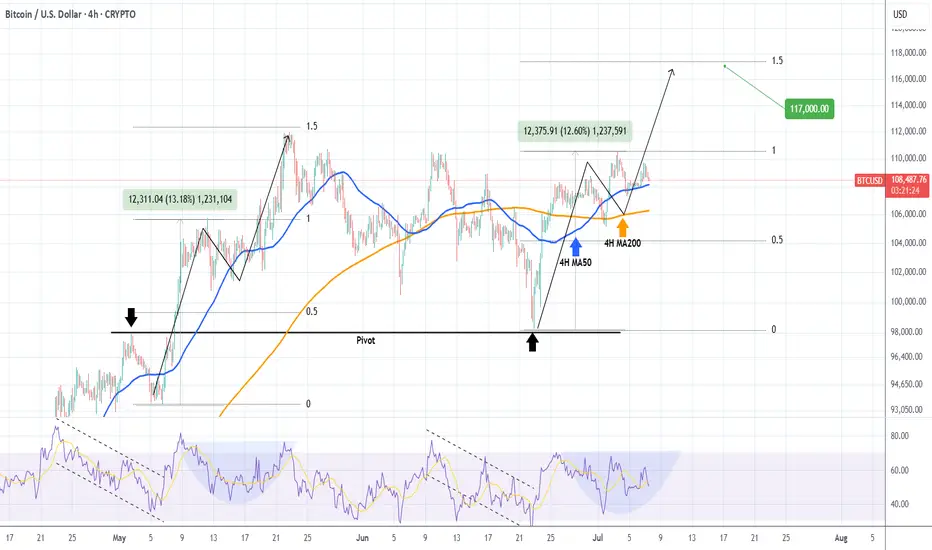
BITCOIN Short-term Target = $117kBitcoin (BTCUSD) is coming off a 4H Golden Cross, attempting to hold the 4H MA50 (blue trend-line) as its short-term Support. The early hours of the E.U. session today show that this might be a difficult task, however comparison with May's Bullish Leg, gives positive signs.
Almost the entire month of May sequence has been an uptrend, which looks very similar to today's. Almost identical rises from their bottoms (+13.60% against +12.60%) until the first top, with similar 4H RSI fractals also, we can expect the current uptrend to make a second top soon near the 1.5 Fibonacci extension at $117000.
Are you expecting such an outcome in the coming days? Feel free to let us know in the comments section below!
-------------------------------------------------------------------------------
** Please LIKE 👍, FOLLOW ✅, SHARE 🙌 and COMMENT ✍ if you enjoy this idea! Also share your ideas and charts in the comments section below! This is best way to keep it relevant, support us, keep the content here free and allow the idea to reach as many people as possible. **
-------------------------------------------------------------------------------
💸💸💸💸💸💸
👇 👇 👇 👇 👇 👇
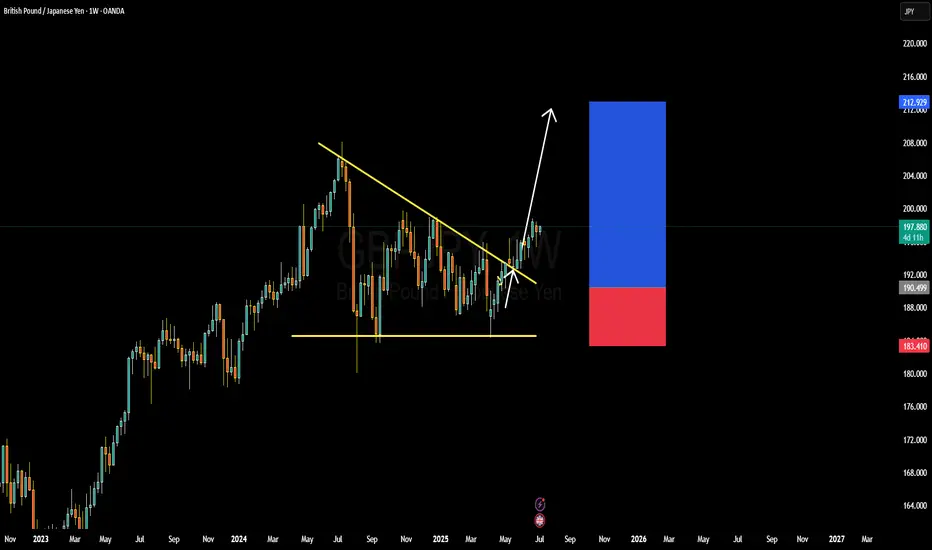
GBPJPY BULLISH OR BEARIS DETAILED ANALYSISGBPJPY has successfully broken out of a long-term falling wedge on the weekly chart, and the bullish momentum is unfolding as expected. Price has rallied from 190.00 to the current 197.00 level, delivering solid profits from the breakout zone. This continuation setup is extremely strong, with the market respecting the wedge breakout structure and forming higher highs. As long as we hold above the 190.00 support, the bullish bias remains fully intact, with 205.00 as the next key upside target.
Fundamentally, the British pound remains well-supported due to the Bank of England’s hawkish stance. Despite softer inflation data, the BoE has signaled a cautious approach to rate cuts compared to other central banks, maintaining underlying GBP strength. On the other side, the Japanese yen continues to weaken as the Bank of Japan sticks with its ultra-loose monetary policy. Yen weakness is further fueled by rising US and UK bond yields, widening the yield differential and attracting carry trades into GBPJPY.
Technically, the breakout is unfolding with textbook precision. Price has cleared descending resistance, retested it, and is now building a new leg higher. The volume profile is supporting this bullish breakout, and market structure is confirming further upside. The 200.00 psychological level may act as a minor resistance, but once cleared, 205.00 is well within range and aligns with major Fibonacci extensions.
GBPJPY is also benefiting from increased volatility in risk-on sentiment, as equity markets remain firm and bond yields rise globally. Traders are favoring high-yielding currencies like GBP while shorting low-yielders like JPY. With the fundamentals and technicals now strongly aligned, this trade is well-positioned to deliver continued profits toward 205.00 and beyond.
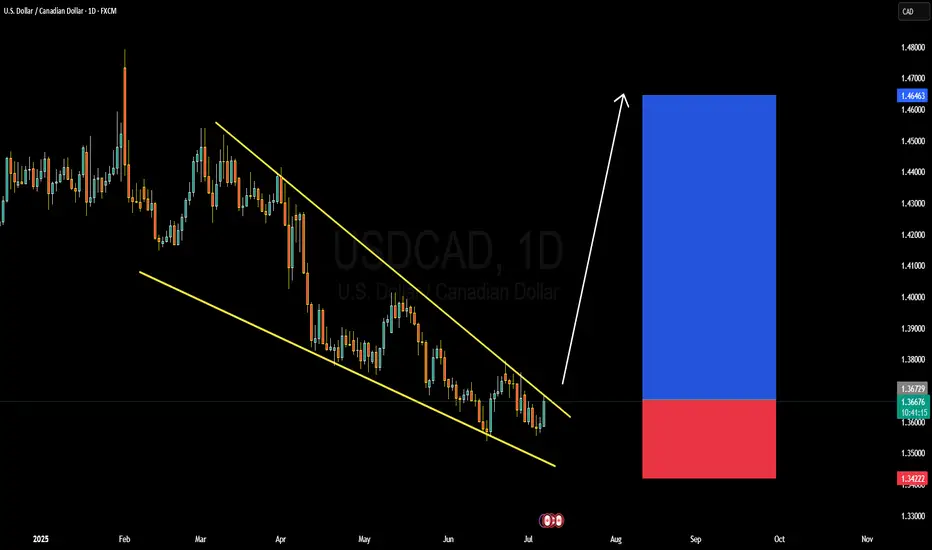
USDCAD BULLISH OR BEARISH DETAILED ANALYSISUSDCAD has just completed a clean falling wedge breakout—a classic bullish reversal pattern often signaling trend exhaustion. After months of consistent lower highs and lower lows within a well-defined wedge, price has now broken decisively above the descending resistance. The current price sits around 1.367, and we are confidently targeting the 1.407 level in the coming weeks. This breakout aligns perfectly with the seasonal USD strength historically seen in Q3, especially following soft Canadian economic data.
From a fundamental perspective, the Canadian dollar is facing downside pressure amid falling crude oil prices and softening domestic data. Canada’s most recent GDP growth came in below expectations, raising concerns around economic resilience. Meanwhile, the Bank of Canada is expected to remain dovish with growing speculation of another rate cut in the next quarter. In contrast, the US dollar has been gaining traction following stronger-than-expected ISM services data and a better-than-anticipated ADP employment report, supporting the Fed’s “higher for longer” stance on interest rates.
Technically, the breakout is further supported by increasing bullish momentum and a break of market structure on lower timeframes. We’re seeing volume confirmation with this push, adding conviction that buyers are stepping in with strength. The risk-to-reward ratio remains highly favorable here, and any pullback into the 1.36 zone would provide an excellent re-entry opportunity for continuation.
With sentiment shifting in favor of USD bulls and oil-related weakness dragging CAD, USDCAD looks primed for a rally. The 1.407 target aligns with both key resistance levels and Fibonacci projections from the breakout structure. Momentum is with the bulls, and this setup has the potential to deliver solid profits as we head deeper into Q3.
US
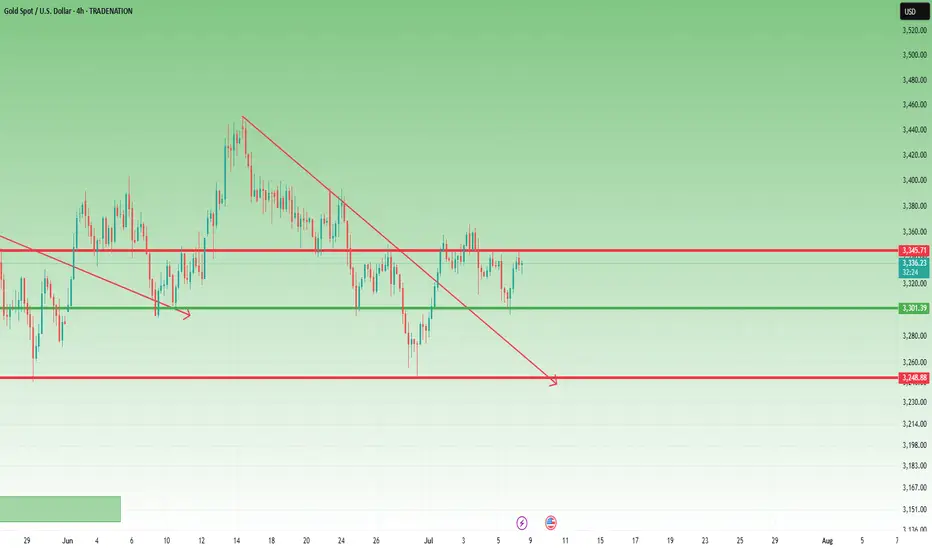
Lingrid | GOLD Weekly Analysis: Consolidation Within UptrendOANDA:XAUUSD market remain trapped in volatile sideways action within a broad consolidation range, following the recent strong rally. Despite the current noisy price behavior, the underlying longer-term bullish momentum remains intact.
Higher timeframe reveals critical technical levels, with gold testing the resistance zone around after breaking above the upward channel. The triangle pattern breakout suggests potential for higher targets, though the market is currently experiencing a corrective pullback near the $3,300 support level. The presence of multiple resistance tests indicates strong institutional interest at these elevated levels.
The 4H chart provides broader context, showing the A-B-C corrective structure from the June highs. The market appears to be forming a potential ascending triangle pattern, with the June high serving as key resistance. The current consolidation between the June high and low suggests accumulation before the next directional move.
Key levels to watch include the $3,300 support zone and the $3,400 resistance area. A decisive break above resistance could trigger another leg higher toward $3,500, while failure to hold support might see a retest of the $3,200 level. The overall structure suggests this consolidation is part of a larger bullish continuation pattern.
If this idea resonates with you or you have your own opinion, traders, hit the comments. I’m excited to read your thoughts!
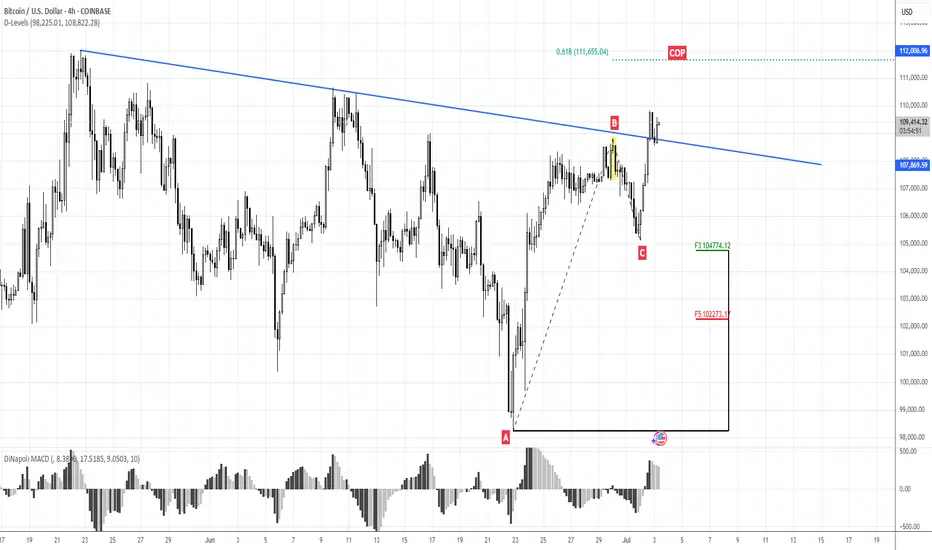
111.65 against 105KMorning folks,
So we've got great entry with our H&S but it is early to relax. To avoid long explanations - BTC has to stay above 105K lows to keep current tendency valid. So, if you still plan to buy BTC here - you do not need to watch for too deep standing Fib levels.
If BTC will still drop below 105K, we could get extended downside action to 100K and maybe even deeper.
Nearest upside target with our current plan is 111.65K.
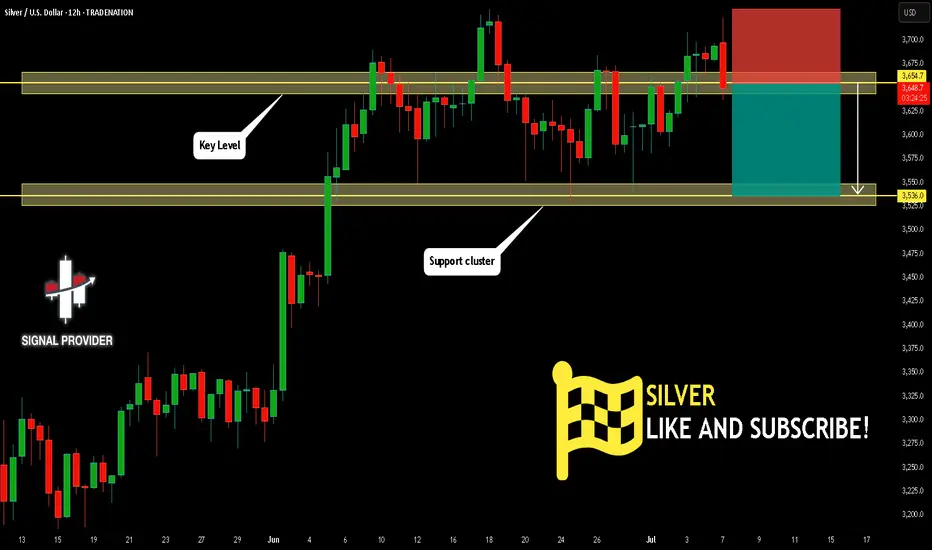
SILVER Will Go Lower From Resistance! Short!
Here is our detailed technical review for SILVER.
Time Frame: 12h
Current Trend: Bearish
Sentiment: Overbought (based on 7-period RSI)
Forecast: Bearish
The market is approaching a significant resistance area 3,654.7.
Due to the fact that we see a positive bearish reaction from the underlined area, I strongly believe that sellers will manage to push the price all the way down to 3,536.0 level.
P.S
Please, note that an oversold/overbought condition can last for a long time, and therefore being oversold/overbought doesn't mean a price rally will come soon, or at all.
Disclosure: I am part of Trade Nation's Influencer program and receive a monthly fee for using their TradingView charts in my analysis.
Like and subscribe and comment my ideas if you enjoy them!
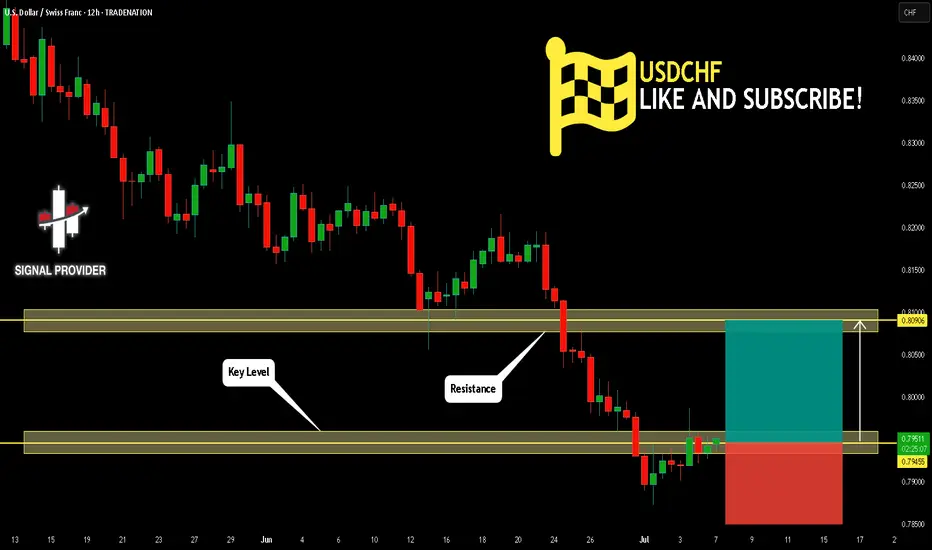
USDCHF Will Go Up From Support! Buy!
Take a look at our analysis for USDCHF.
Time Frame: 12h
Current Trend: Bullish
Sentiment: Oversold (based on 7-period RSI)
Forecast: Bullish
The market is on a crucial zone of demand 0.794.
The oversold market condition in a combination with key structure gives us a relatively strong bullish signal with goal 0.809 level.
P.S
The term oversold refers to a condition where an asset has traded lower in price and has the potential for a price bounce.
Overbought refers to market scenarios where the instrument is traded considerably higher than its fair value. Overvaluation is caused by market sentiments when there is positive news.
Disclosure: I am part of Trade Nation's Influencer program and receive a monthly fee for using their TradingView charts in my analysis.
Like and subscribe and comment my ideas if you enjoy them!