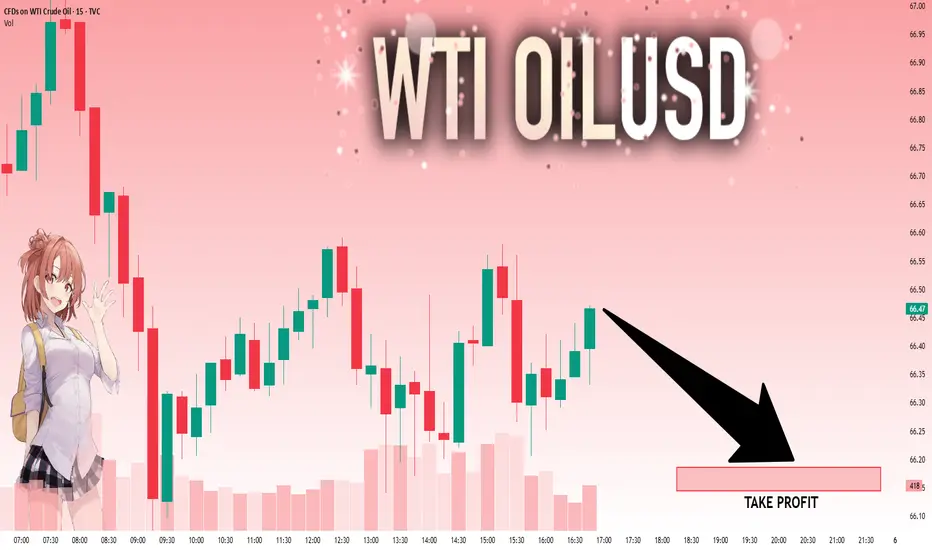
USOIL: Local Bearish Bias! Short!
My dear friends,
Today we will analyse USOIL together☺️
The recent price action suggests a shift in mid-term momentum. A break below the current local range around 66.47 will confirm the new direction downwards with the target being the next key level of 66.19.and a reconvened placement of a stop-loss beyond the range.
❤️Sending you lots of Love and Hugs❤️
Signals
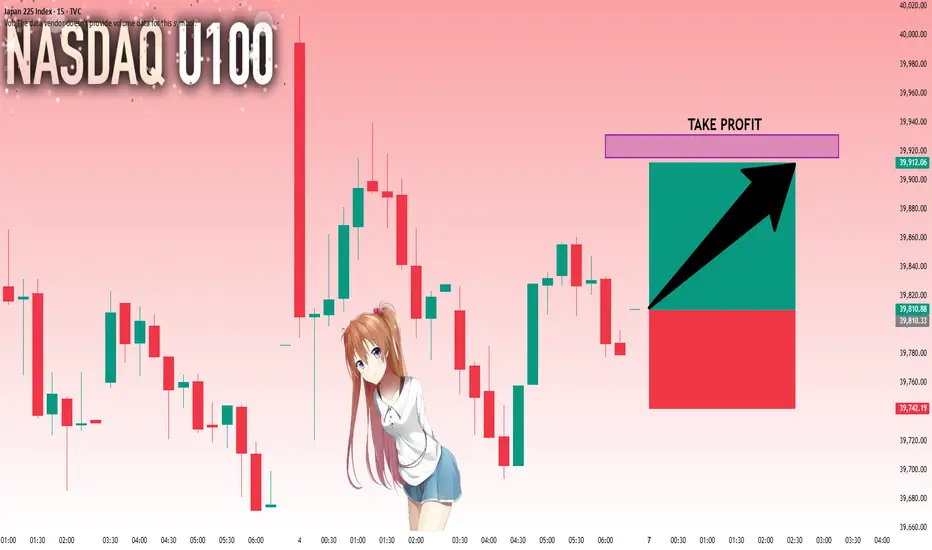
NI225: Strong Growth Ahead! Long!
My dear friends,
Today we will analyse NI225 together☺️
The in-trend continuation seems likely as the current long-term trend appears to be strong, and price is holding above a key level of 39,810.33 So a bullish continuation seems plausible, targeting the next high. We should enter on confirmation, and place a stop-loss beyond the recent swing level.
❤️Sending you lots of Love and Hugs❤️
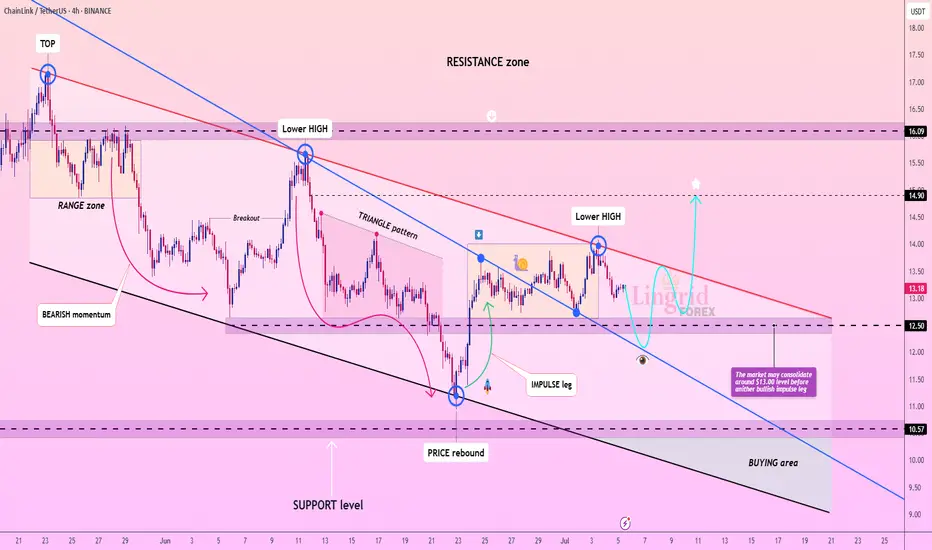
Lingrid | LINKUSDT potential Bullish BreakoutBINANCE:LINKUSDT has formed a sequence of lower highs beneath a descending red trendline, indicating that bearish pressure remains dominant. After a recent rejection near $13.80, price action is now pulling back toward the $12.50–$13.00 range where consolidation is likely. The structure suggests a potential rebound from the lower boundary before another bullish push into the resistance zone near $14.90.
📉 Key Levels
Buy zone: 12.50–13.00 (support + prior consolidation)
Sell trigger: loss of 12.50 support with strong volume
Target: 14.90 – major horizontal resistance
Buy trigger: bullish reversal from the 12.50 support zone
💡 Risks
Breakdown below $12.50 could send price toward $10.57
Lower highs pattern still intact unless $14.00 is cleared
Mid-range chop could delay trend continuation or trap longs
If this idea resonates with you or you have your own opinion, traders, hit the comments. I’m excited to read your thoughts!
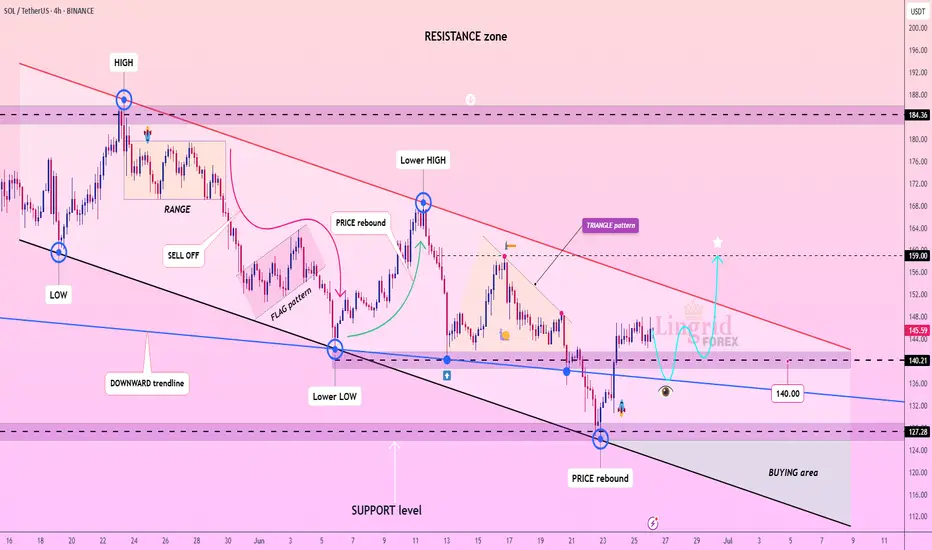
Lingrid | SOLUSDT possible Channel BreakoutBINANCE:SOLUSDT is showing early signs of recovery after rebounding from the 127 support zone and reclaiming structure near the 140 level. Price is now consolidating below the red descending trendline, which acts as dynamic resistance. A breakout above 145 could confirm bullish reversal and target the 159 resistance zone as indicated by the star projection. The key lies in whether buyers can sustain pressure above the 140 zone.
📈 Key Levels
Buy zone: 138–142
Sell trigger: break below 127
Target: 159
Buy trigger: breakout and close above 145 trendline
💡 Risks
Failure to hold above 140 may lead to fresh lows
Downtrend may resume if price gets rejected at 145
Low volume breakout may signal a bull trap
If this idea resonates with you or you have your own opinion, traders, hit the comments. I’m excited to read your thoughts!
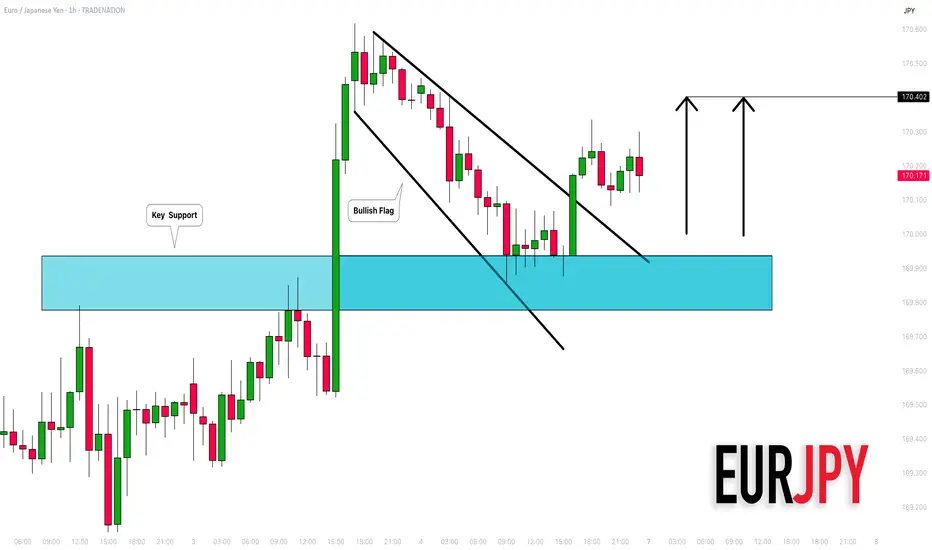
EURJPY: Bullish Outlook Explained 🇪🇺🇯🇵
There is a high chance that EURJPY will continue rising
from an underlined horizontal support.
I see 2 strong price action confirmations:
the price violated a resistance line of a bullish flag
and a neckline of a double bottom pattern.
Goal - 170.4
❤️Please, support my work with like, thank you!❤️
I am part of Trade Nation's Influencer program and receive a monthly fee for using their TradingView charts in my analysis.
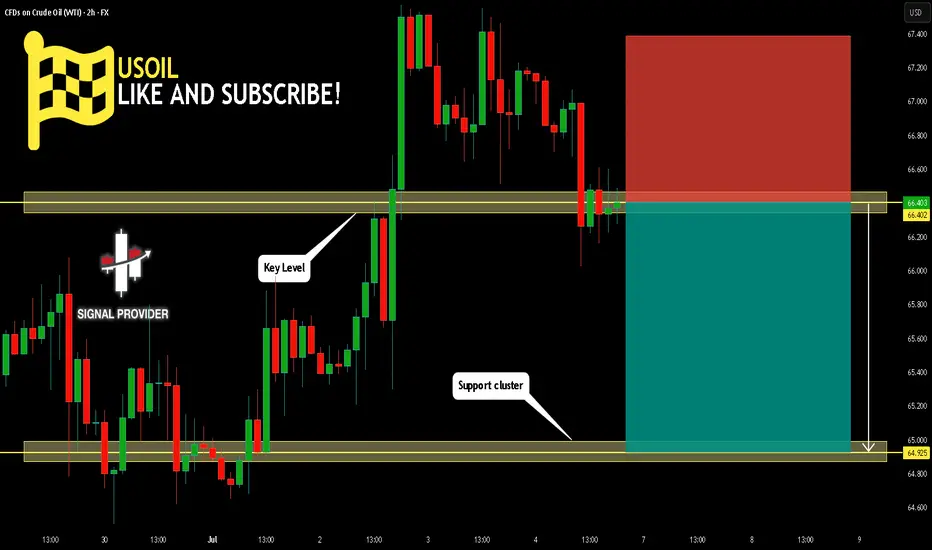
USOIL Is Bearish! Short!
Please, check our technical outlook for USOIL.
Time Frame: 2h
Current Trend: Bearish
Sentiment: Overbought (based on 7-period RSI)
Forecast: Bearish
The market is approaching a key horizontal level 66.402.
Considering the today's price action, probabilities will be high to see a movement to 64.925.
P.S
We determine oversold/overbought condition with RSI indicator.
When it drops below 30 - the market is considered to be oversold.
When it bounces above 70 - the market is considered to be overbought.
Disclosure: I am part of Trade Nation's Influencer program and receive a monthly fee for using their TradingView charts in my analysis.
Like and subscribe and comment my ideas if you enjoy them!
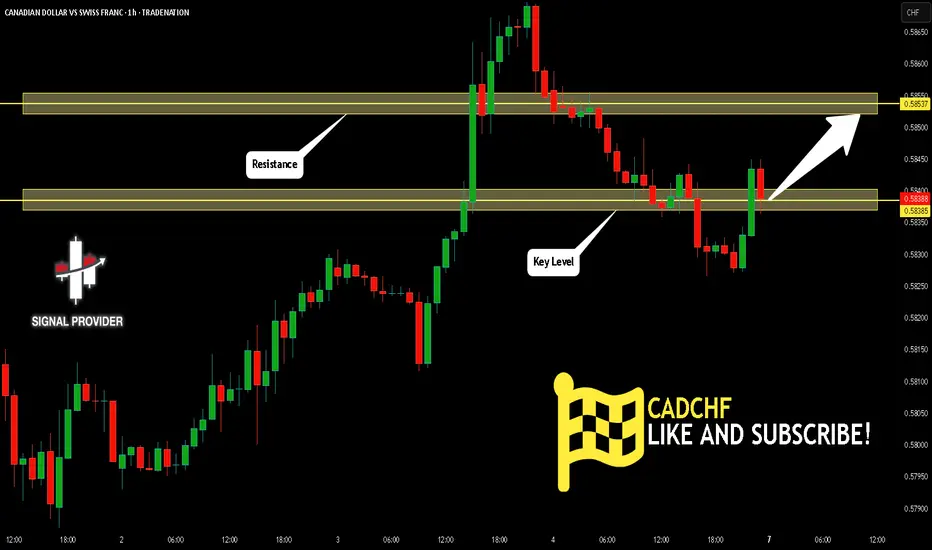
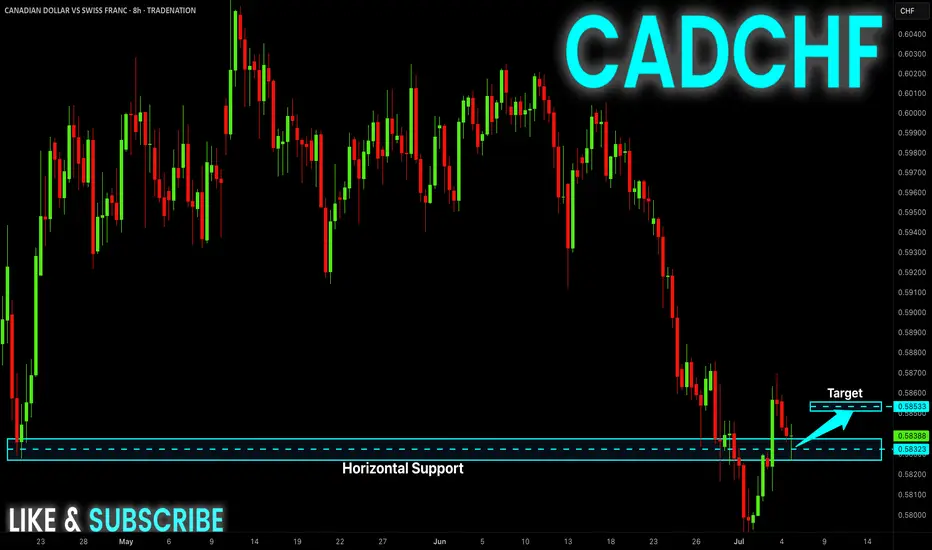
CADCHF Is Going Up! Long!
Take a look at our analysis for CADCHF.
Time Frame: 1h
Current Trend: Bullish
Sentiment: Oversold (based on 7-period RSI)
Forecast: Bullish
The market is on a crucial zone of demand 0.583.
The oversold market condition in a combination with key structure gives us a relatively strong bullish signal with goal 0.585 level.
P.S
Please, note that an oversold/overbought condition can last for a long time, and therefore being oversold/overbought doesn't mean a price rally will come soon, or at all.
Disclosure: I am part of Trade Nation's Influencer program and receive a monthly fee for using their TradingView charts in my analysis.
Like and subscribe and comment my ideas if you enjoy them!
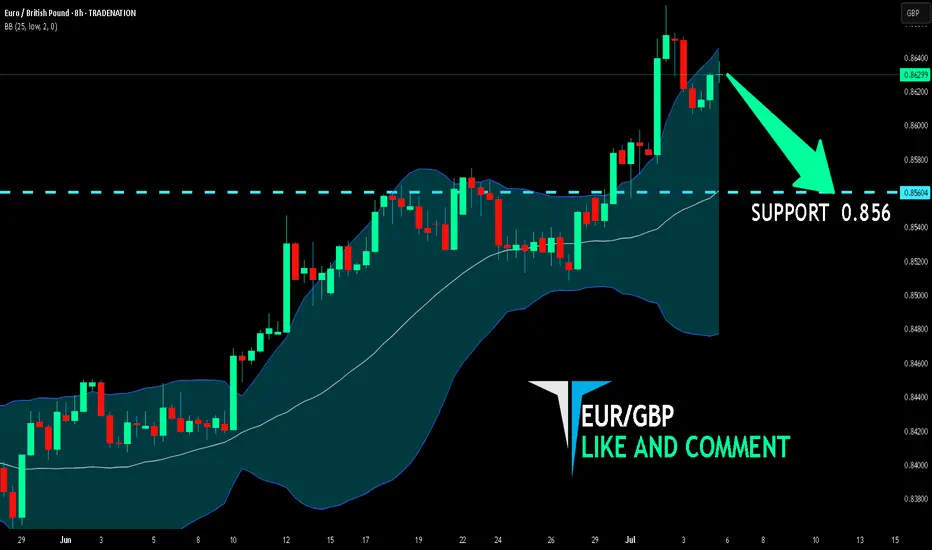
EUR/GBP BEST PLACE TO SELL FROM|SHORT
Hello, Friends!
The BB upper band is nearby so EUR-GBP is in the overbought territory. Thus, despite the uptrend on the 1W timeframe I think that we will see a bearish reaction from the resistance line above and a move down towards the target at around 0.856.
Disclosure: I am part of Trade Nation's Influencer program and receive a monthly fee for using their TradingView charts in my analysis.
✅LIKE AND COMMENT MY IDEAS✅
CAD-CHF Local Long! Buy!
Hello,Traders!
CAD-CHF made a retest
Of the horizontal support
Of 0.5832 so we are locally
Bullish biased and we will be
Expecting a local bullish move up
Buy!
Comment and subscribe to help us grow!
Check out other forecasts below too!
Disclosure: I am part of Trade Nation's Influencer program and receive a monthly fee for using their TradingView charts in my analysis.
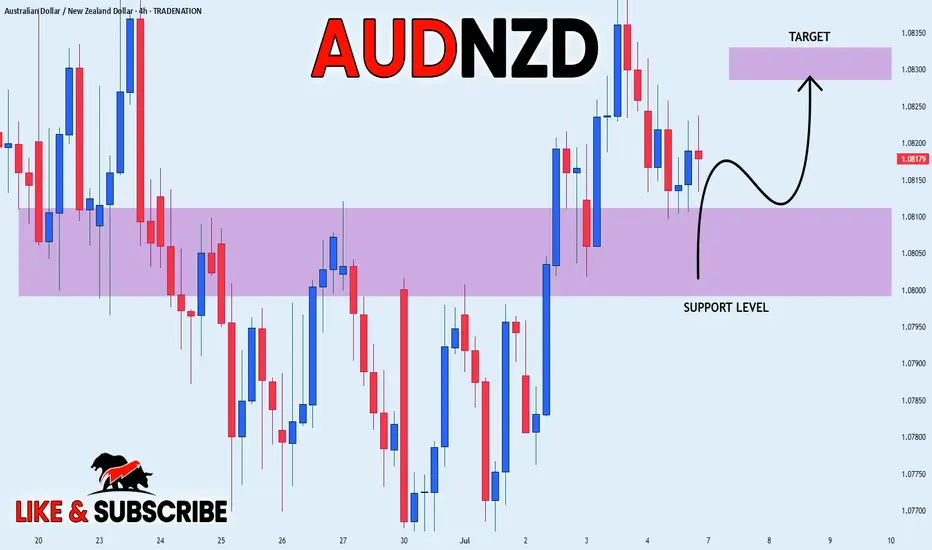
AUD_NZD WILL GROW|LONG|
✅AUD_NZD made a bullish
Rebound so we are bullish
Biased and we will be expecting
A further bullish move up
LONG🚀
✅Like and subscribe to never miss a new idea!✅
Disclosure: I am part of Trade Nation's Influencer program and receive a monthly fee for using their TradingView charts in my analysis.
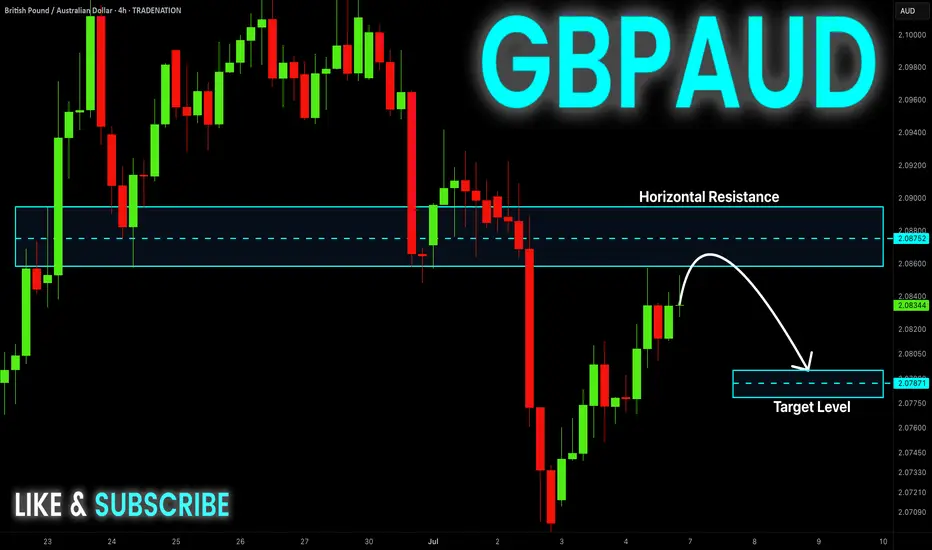
GBP-AUD Short From Resistance! Sell!
Hello,Traders!
GBP-AUD made a retest of
The horizontal resistance
Around 2.0800 from where
We will be expecting a
Local bearish move down
Sell!
Comment and subscribe to help us grow!
Check out other forecasts below too!
Disclosure: I am part of Trade Nation's Influencer program and receive a monthly fee for using their TradingView charts in my analysis.
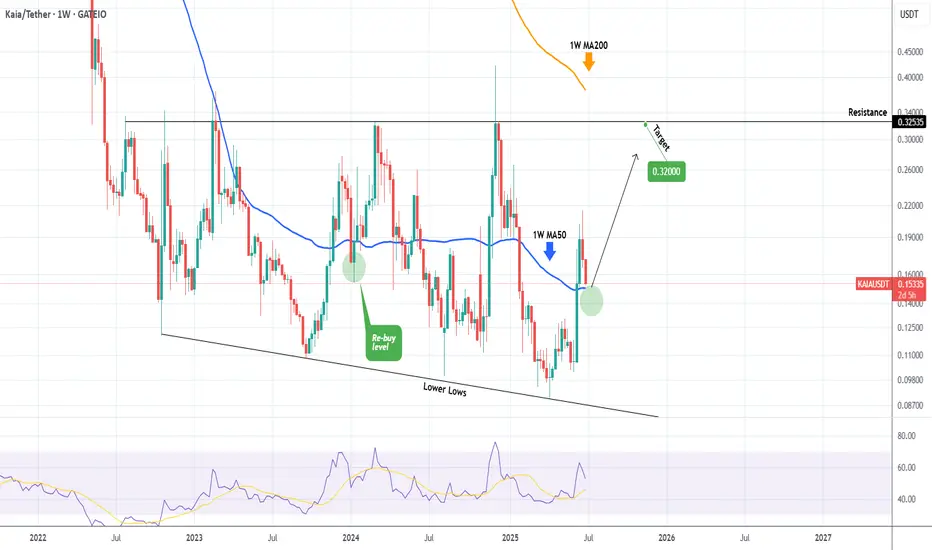
KAIAUSD Buy this level for a bullish continuation.Kaia (KAIAUSDT) is pulling back towards its 1W MA50 (blue trend-line) for a technical re-test of its natural long-term Support.
We think it will be a January 2024 type of test, with a breach and subsequent rebound to test the Resistance and potentially a 1W MA200 (orange trend-line) test. Target 0.32000.
-------------------------------------------------------------------------------
** Please LIKE 👍, FOLLOW ✅, SHARE 🙌 and COMMENT ✍ if you enjoy this idea! Also share your ideas and charts in the comments section below! This is best way to keep it relevant, support us, keep the content here free and allow the idea to reach as many people as possible. **
-------------------------------------------------------------------------------
💸💸💸💸💸💸
👇 👇 👇 👇 👇 👇
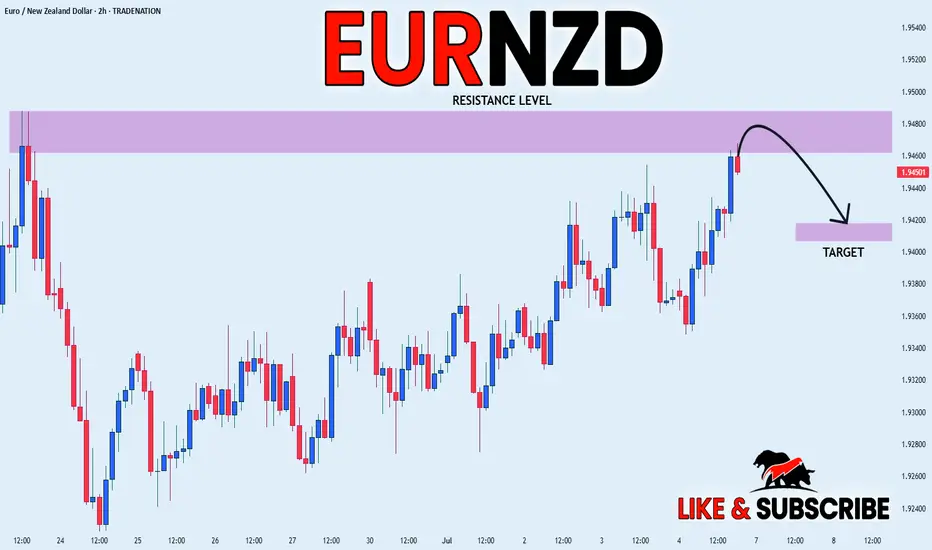
EUR_NZD LOCAL SHORT|
✅EUR_NZD is set to retest a
Strong resistance level above at 1.9488
After trading in a local uptrend for some time
Which makes a bearish pullback a likely scenario
With the target being a local support below at 1.9420
SHORT🔥
✅Like and subscribe to never miss a new idea!✅
Disclosure: I am part of Trade Nation's Influencer program and receive a monthly fee for using their TradingView charts in my analysis.
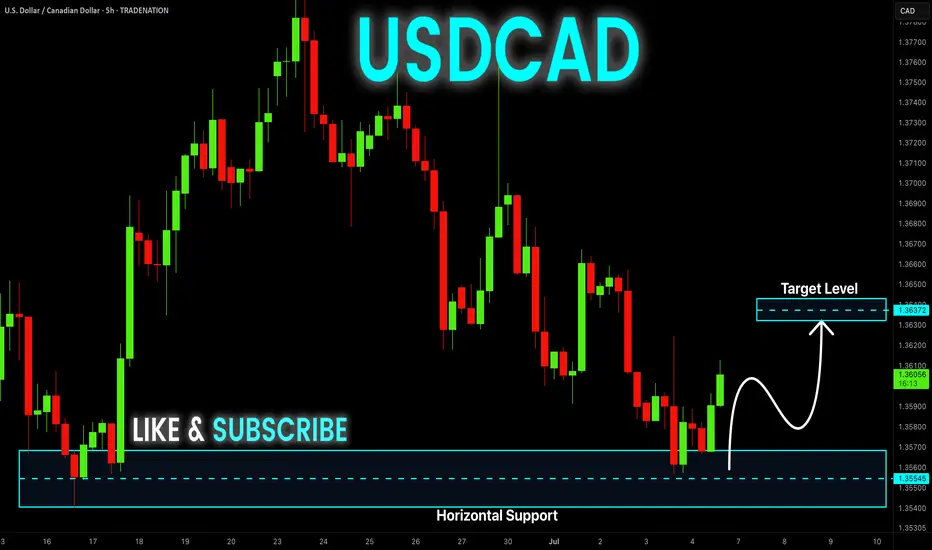
USD-CAD Local Rebound! Buy!
Hello,Traders!
USD-CAD is trading in a
Strong downtrend but
The pair made a retest
Of the horizontal support
Level of 1.3540 from where
We are already seeing a
Bullish rebound and we
Will be expecting a
Further move up
Buy!
Comment and subscribe to help us grow!
Check out other forecasts below too!
Disclosure: I am part of Trade Nation's Influencer program and receive a monthly fee for using their TradingView charts in my analysis.
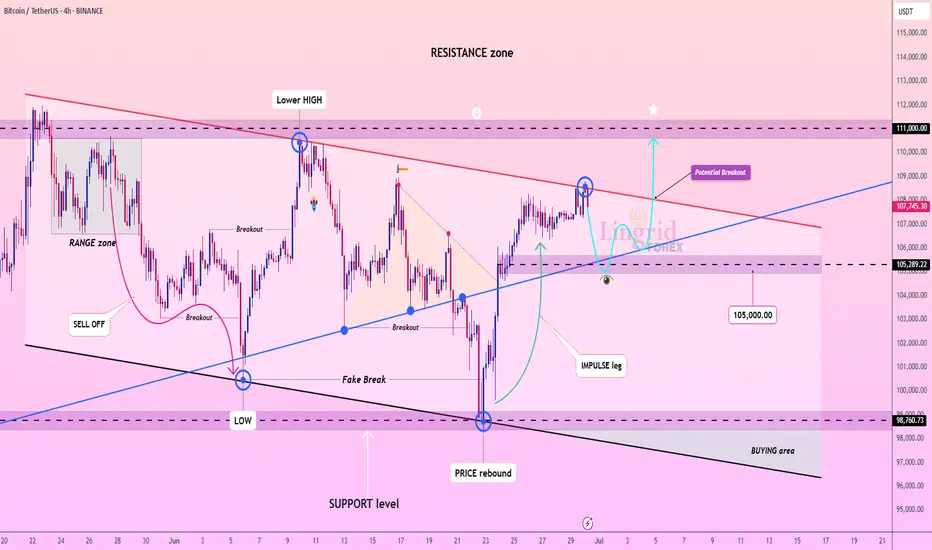
Lingrid | BTCUSDT possible Channel Break - Upside Surge The price perfectly fulfilled my last idea . BINANCE:BTCUSDT is pulling back slightly after rejecting the descending red trendline near the 108,000 level, while remaining above the breakout zone around 105,000. The structure suggests a potential bullish continuation if the price holds this level and forms a higher low. A successful breakout above 108,000 could ignite a move toward the 111,000 resistance band.
📈 Key Levels
Buy zone: 105,000–105,300
Sell trigger: breakdown below 105,000
Target: 111,000
Buy trigger: breakout and retest above 108,000 with strong momentum
💡 Risks
Failure to hold 105,000 reopens path to 98,700
Bearish rejection at 108,000 could maintain lower high structure
Weak volume breakout may lead to a bull trap under 111,000
If this idea resonates with you or you have your own opinion, traders, hit the comments. I’m excited to read your thoughts!
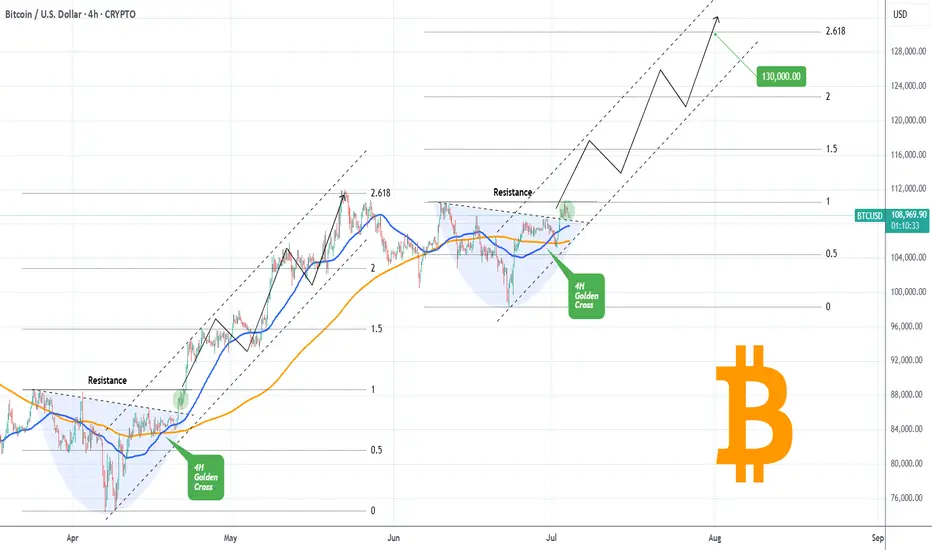
BITCOIN Golden Cross going to slingshot it to $130kBitcoin (BTCUSD) has completed a Golden Cross on the 4H time-frame and is attempting to keep the 4H MA50 (blue trend-line) as Support. If successful, it has high probabilities of staging a Channel Up similar to April - May, which peaked on the 2.618 Fibonacci extension.
So far, the bases of those to fractals are virtually identical, with a Lower Highs trend-line initially acting as a Resistance, which broke and on the current one it is testing the final Resistance (dotted trend-line).
This is the green circle, which on April 21 staged a quick consolidation before breaking aggressively upwards. If the pattern continues to repeat itself, we can get $130k (Fib 2.618 ext) at the end of the Channel Up.
Do you think it will? Feel free to let us know in the comments section below!
-------------------------------------------------------------------------------
** Please LIKE 👍, FOLLOW ✅, SHARE 🙌 and COMMENT ✍ if you enjoy this idea! Also share your ideas and charts in the comments section below! This is best way to keep it relevant, support us, keep the content here free and allow the idea to reach as many people as possible. **
-------------------------------------------------------------------------------
💸💸💸💸💸💸
👇 👇 👇 👇 👇 👇
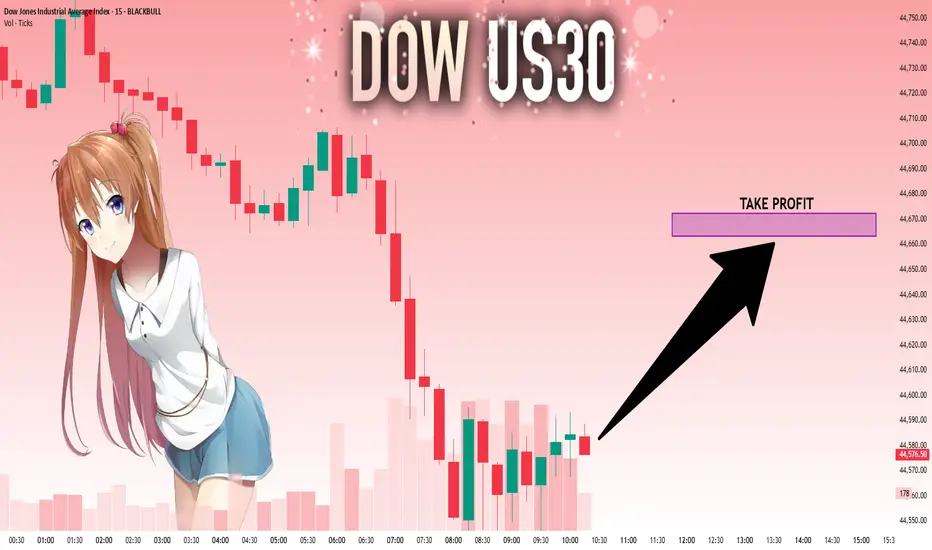
US30: Will Go Up! Long!
My dear friends,
Today we will analyse US30 together☺️
The market is at an inflection zone and price has now reached an area around 44,585.50 where previous reversals or breakouts have occurred.And a price reaction that we are seeing on multiple timeframes here could signal the next move up so we can enter on confirmation, and target the next key level of 44,663.28.Stop-loss is recommended beyond the inflection zone.
❤️Sending you lots of Love and Hugs❤️
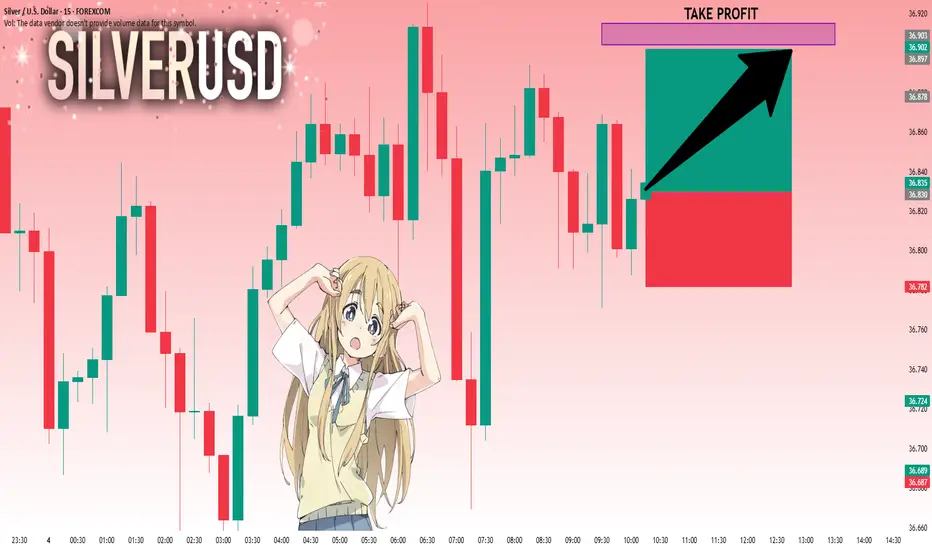
SILVER: The Market Is Looking Up! Long!
My dear friends,
Today we will analyse SILVER together☺️
The price is near a wide key level
and the pair is approaching a significant decision level of 36.830 Therefore, a strong bullish reaction here could determine the next move up.We will watch for a confirmation candle, and then target the next key level 36.903.Recommend Stop-loss is beyond the current level.
❤️Sending you lots of Love and Hugs❤️
EURUSD: Strong Bearish Sentiment! Short!
My dear friends,
Today we will analyse EURUSD together☺️
The recent price action suggests a shift in mid-term momentum. A break below the current local range around 1.17775 will confirm the new direction downwards with the target being the next key level of 1.17696.and a reconvened placement of a stop-loss beyond the range.
❤️Sending you lots of Love and Hugs❤️

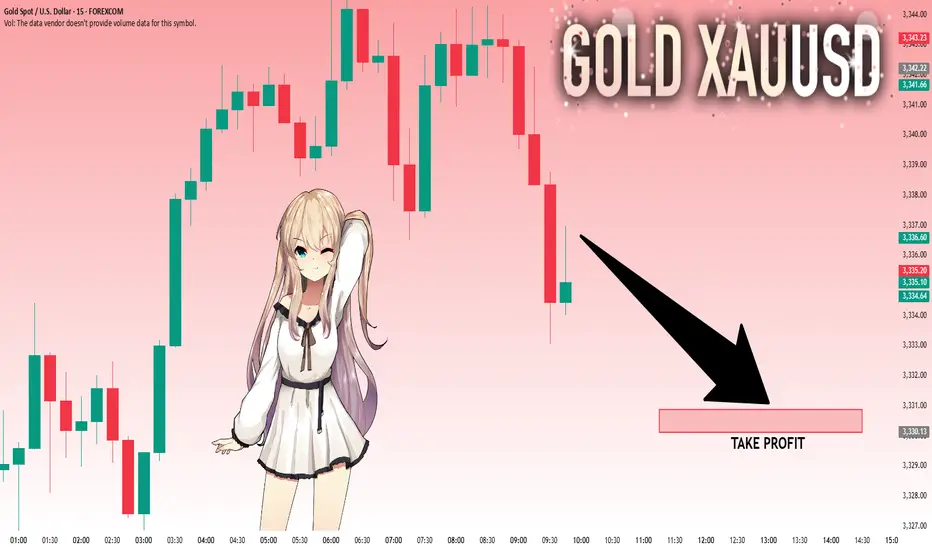
GOLD: Bears Are Winning! Short!
My dear friends,
Today we will analyse GOLD together☺️
The in-trend continuation seems likely as the current long-term trend appears to be strong, and price is holding below a key level of 3,336.61 So a bearish continuation seems plausible, targeting the next low. We should enter on confirmation, and place a stop-loss beyond the recent swing level.
❤️Sending you lots of Love and Hugs❤️
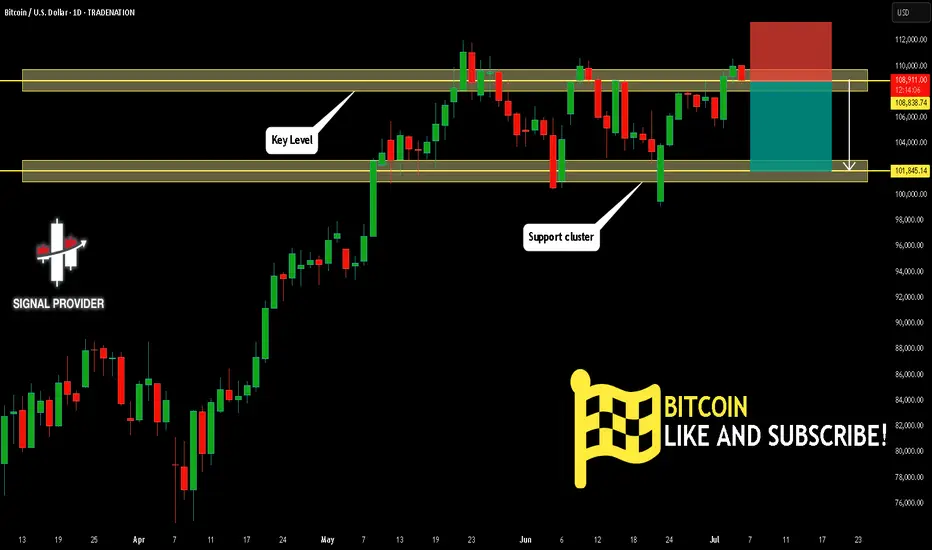
BITCOIN Will Fall! Sell!
Please, check our technical outlook for BITCOIN.
Time Frame: 1D
Current Trend: Bearish
Sentiment: Overbought (based on 7-period RSI)
Forecast: Bearish
The price is testing a key resistance 108,838.74.
Taking into consideration the current market trend & overbought RSI, chances will be high to see a bearish movement to the downside at least to 101,845.14 level.
P.S
The term oversold refers to a condition where an asset has traded lower in price and has the potential for a price bounce.
Overbought refers to market scenarios where the instrument is traded considerably higher than its fair value. Overvaluation is caused by market sentiments when there is positive news.
Disclosure: I am part of Trade Nation's Influencer program and receive a monthly fee for using their TradingView charts in my analysis.
Like and subscribe and comment my ideas if you enjoy them!
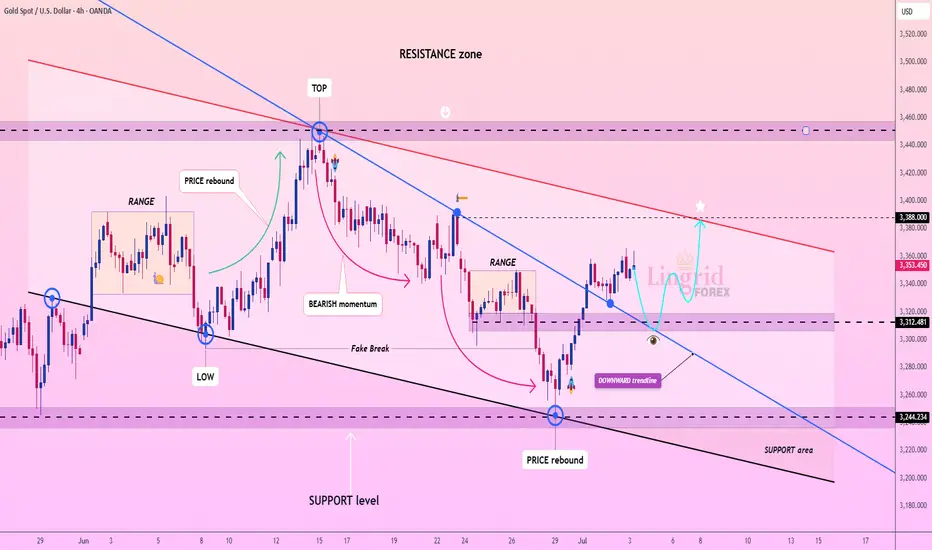
Lingrid | GOLD Pre-NFP Price Action AnalysisThe price perfectly fulfilled my last idea . OANDA:XAUUSD rebounded strongly from the 3244 support area, breaking above the downward trendline and pushing into the mid-resistance band. The price is currently testing 3353 and could pull back slightly before retesting the 3388 key resistance level. A sustained breakout above that red trendline would open the door for a run toward 3450.
📈 Key Levels
Buy zone: 3312–3330 (post-breakout retest area)
Sell trigger: break below 3312 and close under trendline
Target: 3388 with potential extension to 3450
Buy trigger: confirmed bullish bounce from 3312 and momentum above 3353
💡 Risks
Resistance at 3388 may cause rejection if volume fades
Downward trendline remains a structural cap unless fully broken
False breakout could return price back to 3244 zone quickly
If this idea resonates with you or you have your own opinion, traders, hit the comments. I’m excited to read your thoughts!
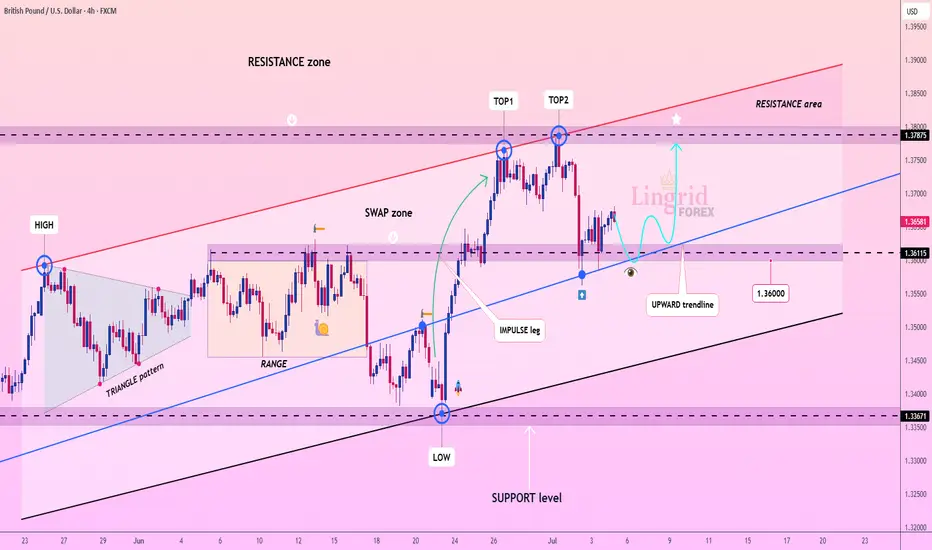
Lingrid | GBPUSD Potential Bounce at Key Psychological LevelThe price perfectly fulfilled my previous idea . FX:GBPUSD is consolidating above the upward trendline after forming a local double top near the 1.3787 resistance zone. The price is currently retesting the 1.3611–1.3660 support cluster, aligned with the trendline and previous impulse breakout area. A successful bounce from this zone could initiate another rally toward the upper boundary of the resistance range.
📈 Key Levels
Buy zone: 1.3600–1.3660 (trendline + support overlap)
Sell trigger: breakdown below 1.3600
Target: 1.3787 – resistance ceiling with prior rejection
Buy trigger: bullish reaction from 1.3611 area with strong candle close
💡 Risks
Breakdown below 1.3600 may expose deeper retracement to 1.3367
Repeated rejection at 1.3787 could form a longer-term double top
Macro data surprises could shift short-term direction suddenly
If this idea resonates with you or you have your own opinion, traders, hit the comments. I’m excited to read your thoughts!