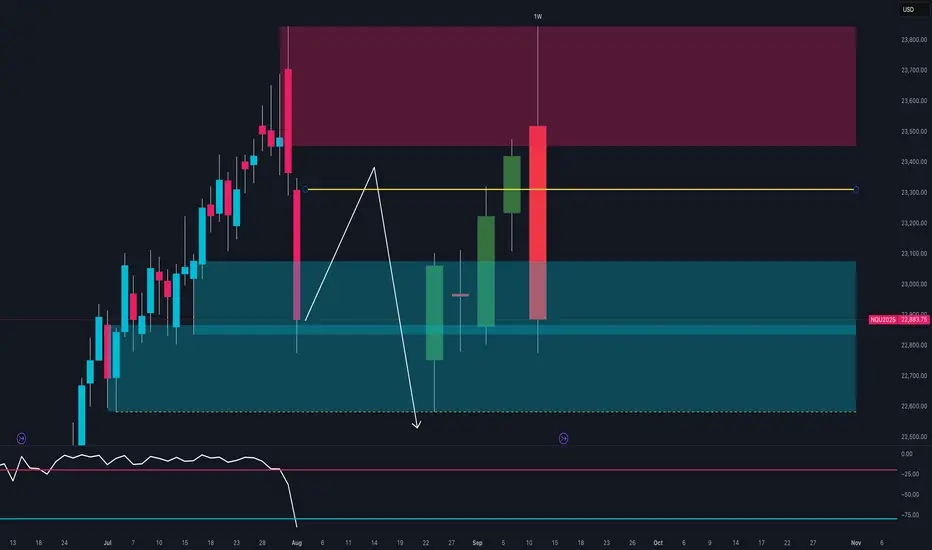
NASDAQ at Key Turning Point 🔍Technical Context
After testing the 23,600–23,800 supply zone, price printed a strong bearish rejection with a weekly engulfing candle.
The RSI broke decisively below the midline, signaling a clear loss of momentum.
Price is now trading back within the weekly demand zone between 22,800 and 22,950.
If a pullback toward 23,200 occurs, it could offer a fresh short opportunity, with downside targets around 22,600.
🪙 COT Report – July 29
Non-Commercials (speculators):
Long: +8,581
Short: +4,355
Commercials (hedging):
Long: +4,955
Short: +8,556
The market remains net long, but commercials are increasingly hedging with shorts.
The current imbalance — 88.6% long vs 11.3% short — suggests excessive bullish positioning, raising the risk of a correction.
🗓️ Seasonality – August
August is historically strong for the NASDAQ:
+222 pts (10Y)
+400 pts (5Y)
+912 pts (2Y)
While the trend is clearly bullish seasonally, caution is warranted:
Tops are often formed during the first half of August, followed by more pronounced corrections in September.
📉 Operational Summary
Primary scenario:
Wait for a retest of the 23,200–23,250 area
Look for rejection signals → enter short
Target 1: 22,800
Target 2: 22,600
Alternatively:
If 22,800 breaks on a strong weekly close, deeper downside scenarios may unfold.
Signals
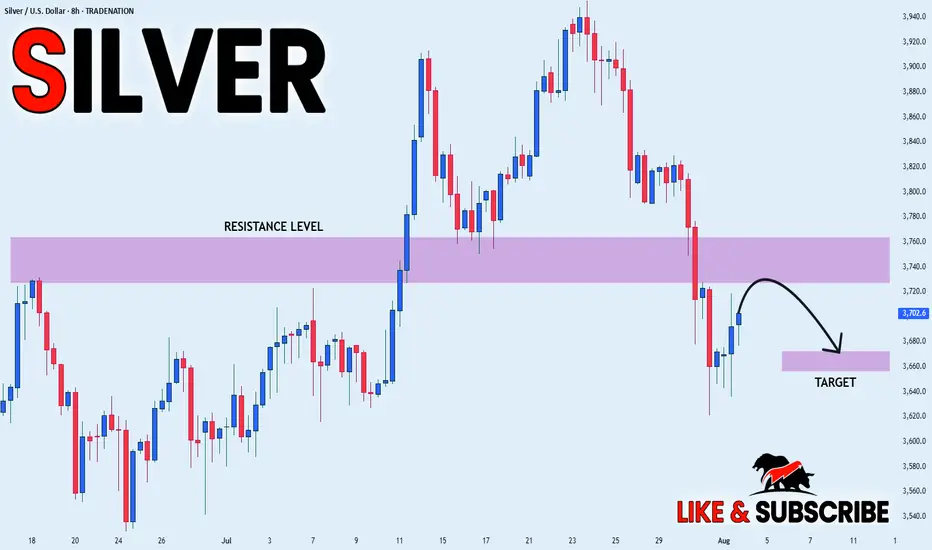
SILVER WILL FALL|SHORT|
✅SILVER is going up now
But a strong resistance level is ahead at 37,60$
Thus I am expecting a pullback
And a move down towards the target of 36,69$
SHORT🔥
✅Like and subscribe to never miss a new idea!✅
Disclosure: I am part of Trade Nation's Influencer program and receive a monthly fee for using their TradingView charts in my analysis.
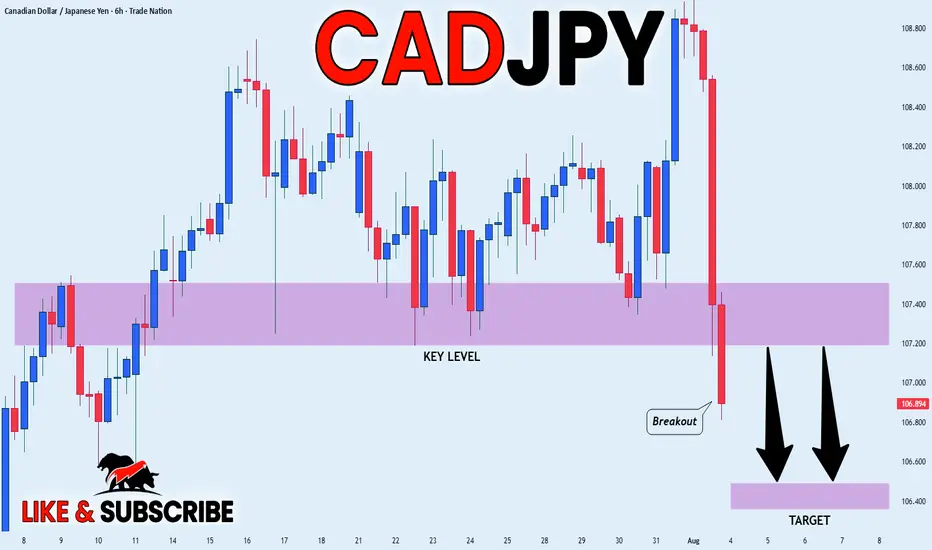
CAD_JPY BEARISH BREKAOUT|SHORT|
✅CAD_JPY broke the key structure level of 107.400
While trading in an local downtrend
Which makes me bearish
And I think that after the retest of the broken level is complete
A rebound and bearish continuation will follow
SHORT🔥
✅Like and subscribe to never miss a new idea!✅
Disclosure: I am part of Trade Nation's Influencer program and receive a monthly fee for using their TradingView charts in my analysis.
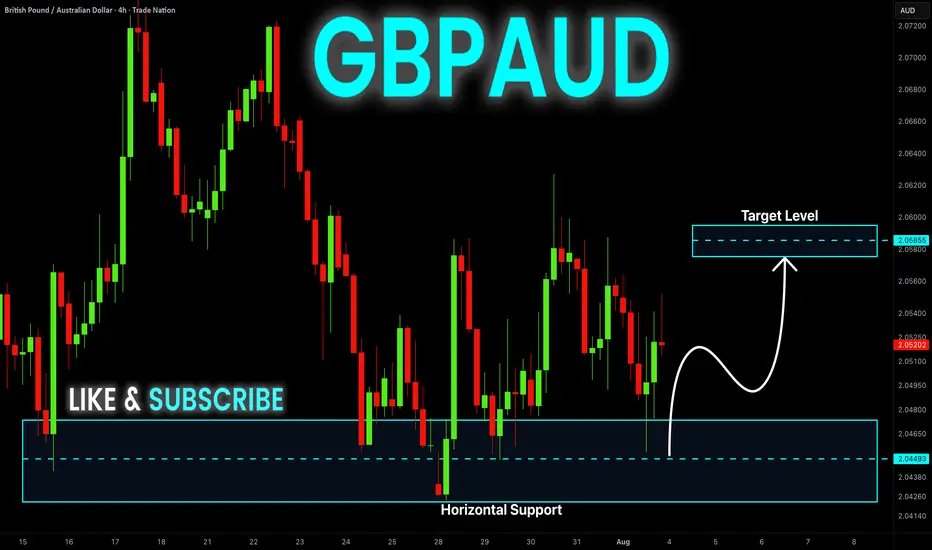
GBP-AUD Growth Ahead! Buy!
Hello,Traders!
GBP-AUD made a retest
Of the horizontal support
Of 2.0420 and we are
Already seeing a bullish
Rebound so we will be
Expecting a further
Bullish move up
Buy!
Comment and subscribe to help us grow!
Check out other forecasts below too!
Disclosure: I am part of Trade Nation's Influencer program and receive a monthly fee for using their TradingView charts in my analysis.
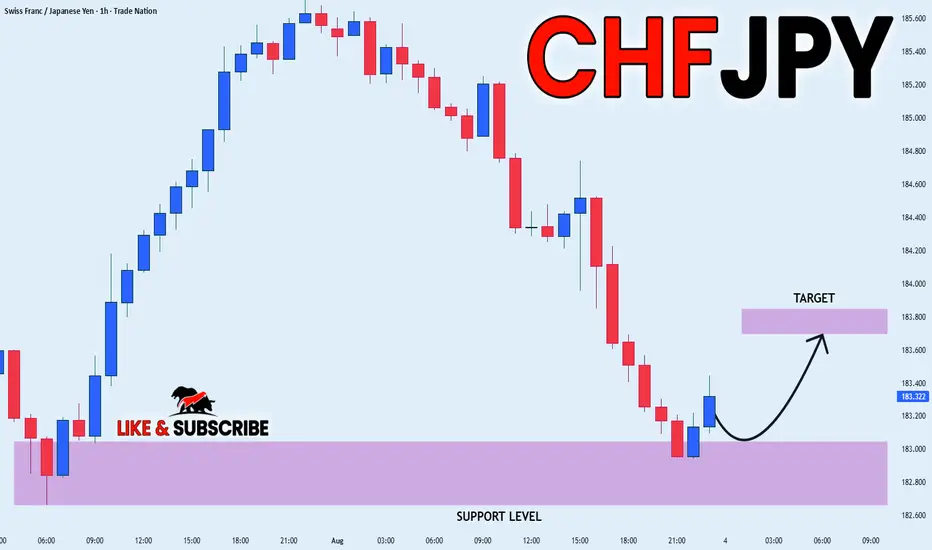
CHF_JPY RISKY LONG|
✅CHF_JPY has retested a key support level of 182.800
And as the pair is already making a bullish rebound
A move up to retest the supply level above at 183.700 is likely
LONG🚀
✅Like and subscribe to never miss a new idea!✅
Disclosure: I am part of Trade Nation's Influencer program and receive a monthly fee for using their TradingView charts in my analysis.
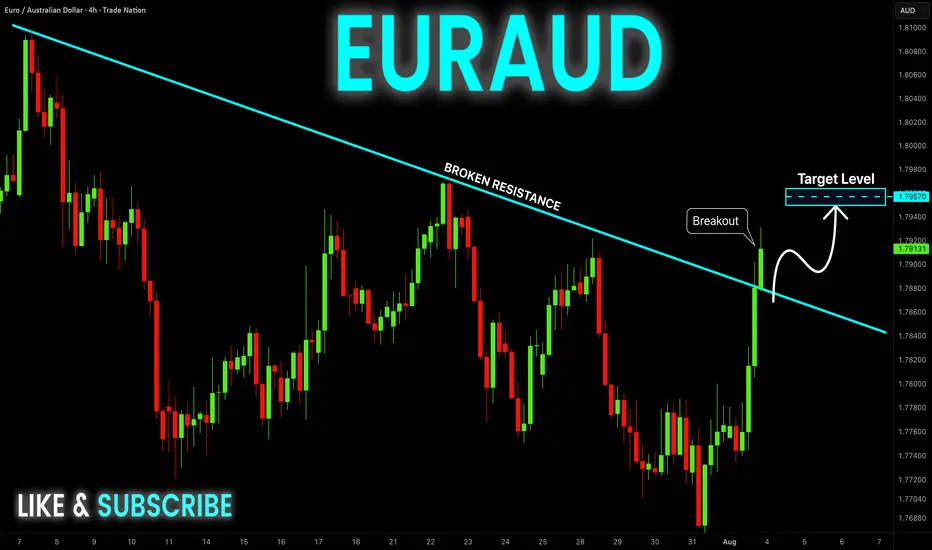
EUR-AUD Bullish Breakout! Buy!
Hello,Traders!
EUR-AUD made a bullish
Breakout of the falling resistance
And the breakout is confirmed
So we are bullish biased
And we will be expecting
A further bullish move up
On Monday!
Buy!
Comment and subscribe to help us grow!
Check out other forecasts below too!
Disclosure: I am part of Trade Nation's Influencer program and receive a monthly fee for using their TradingView charts in my analysis.
GOLD: Target Is Down! Short!
My dear friends,
Today we will analyse GOLD together☺️
The market is at an inflection zone and price has now reached an area around 3,353.10 where previous reversals or breakouts have occurred.And a price reaction that we are seeing on multiple timeframes here could signal the next move down so we can enter on confirmation, and target the next key level of 3,335.20..Stop-loss is recommended beyond the inflection zone.
❤️Sending you lots of Love and Hugs❤️

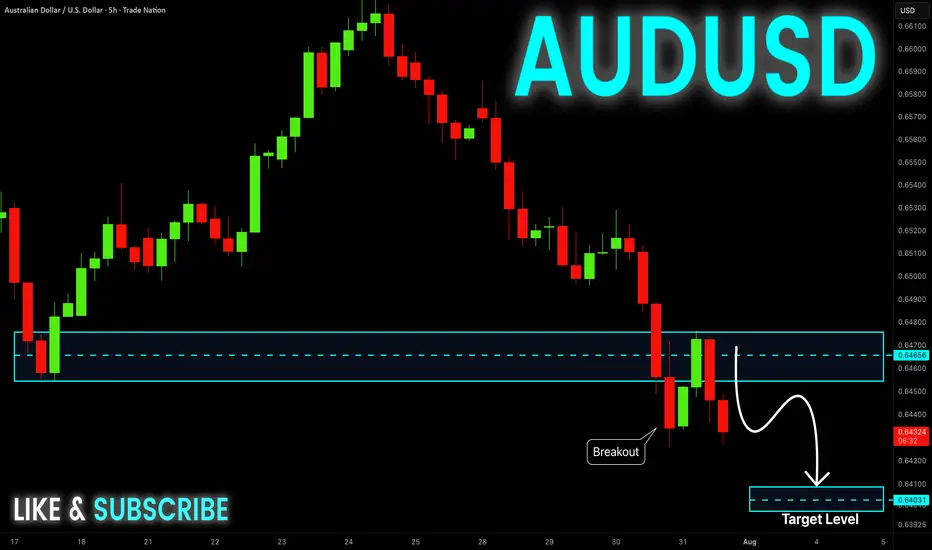
AUD-USD Will Go Down! Sell!
Hello,Traders!
AUD-USD is trading in a
Downtrend and the pair
Broke the key horizontal
Level of 0.6470 which is
Now a resistance then
Made a retest and a
Confident pullback which
Reinforces our bearish
Bias and makes us expect
A further bearish move down
Sell!
Comment and subscribe to help us grow!
Check out other forecasts below too!
Disclosure: I am part of Trade Nation's Influencer program and receive a monthly fee for using their TradingView charts in my analysis.
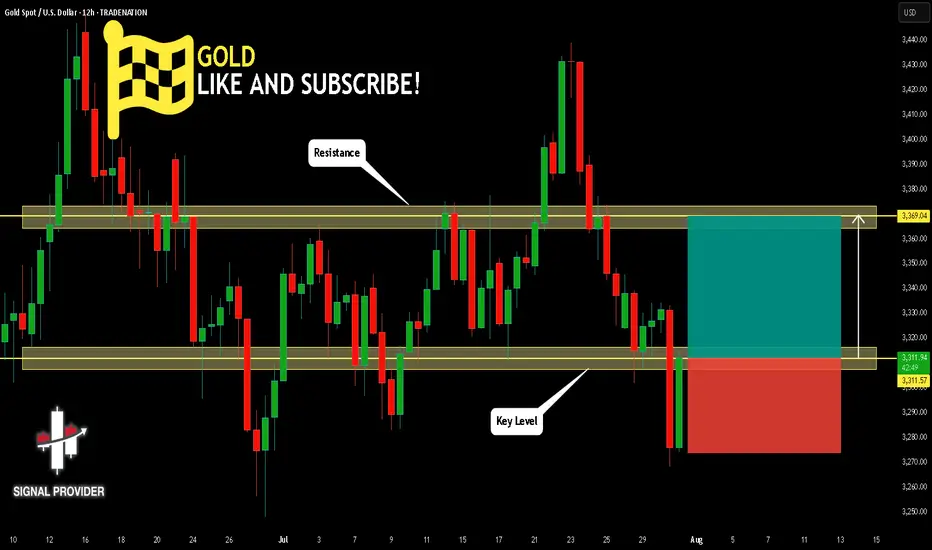
GOLD Will Go Higher From Support! Buy!
Here is our detailed technical review for GOLD.
Time Frame: 12h
Current Trend: Bullish
Sentiment: Oversold (based on 7-period RSI)
Forecast: Bullish
The market is testing a major horizontal structure 3,311.57.
Taking into consideration the structure & trend analysis, I believe that the market will reach 3,369.04 level soon.
P.S
The term oversold refers to a condition where an asset has traded lower in price and has the potential for a price bounce.
Overbought refers to market scenarios where the instrument is traded considerably higher than its fair value. Overvaluation is caused by market sentiments when there is positive news.
Disclosure: I am part of Trade Nation's Influencer program and receive a monthly fee for using their TradingView charts in my analysis.
Like and subscribe and comment my ideas if you enjoy them!
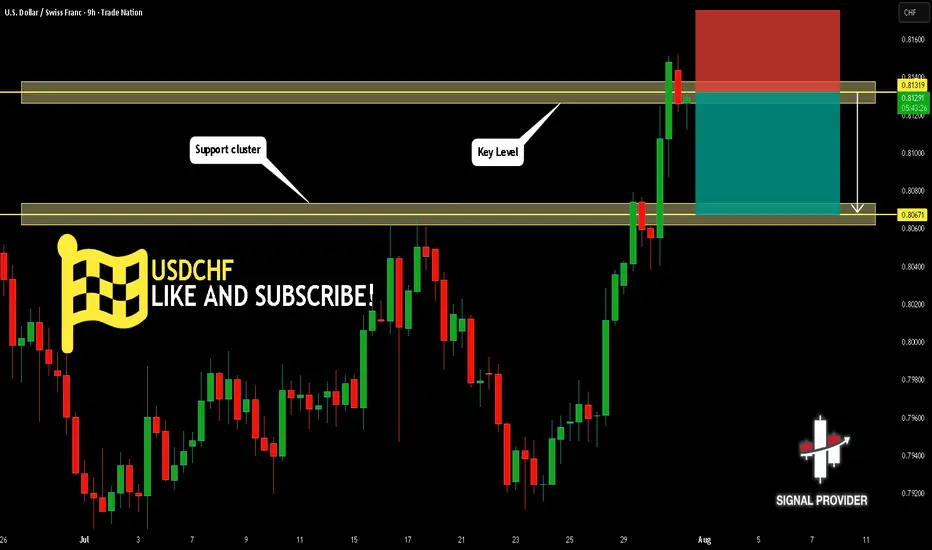
USDCHF Will Go Down From Resistance! Short!
Take a look at our analysis for USDCHF.
Time Frame: 9h
Current Trend: Bearish
Sentiment: Overbought (based on 7-period RSI)
Forecast: Bearish
The market is approaching a key horizontal level 0.813.
Considering the today's price action, probabilities will be high to see a movement to 0.806.
P.S
We determine oversold/overbought condition with RSI indicator.
When it drops below 30 - the market is considered to be oversold.
When it bounces above 70 - the market is considered to be overbought.
Disclosure: I am part of Trade Nation's Influencer program and receive a monthly fee for using their TradingView charts in my analysis.
Like and subscribe and comment my ideas if you enjoy them!
AUDUSD Will Go Lower! Sell!
Please, check our technical outlook for AUDUSD.
Time Frame: 9h
Current Trend: Bearish
Sentiment: Overbought (based on 7-period RSI)
Forecast: Bearish
The market is approaching a significant resistance area 0.645.
Due to the fact that we see a positive bearish reaction from the underlined area, I strongly believe that sellers will manage to push the price all the way down to 0.637 level.
P.S
Overbought describes a period of time where there has been a significant and consistent upward move in price over a period of time without much pullback.
Disclosure: I am part of Trade Nation's Influencer program and receive a monthly fee for using their TradingView charts in my analysis.
Like and subscribe and comment my ideas if you enjoy them!

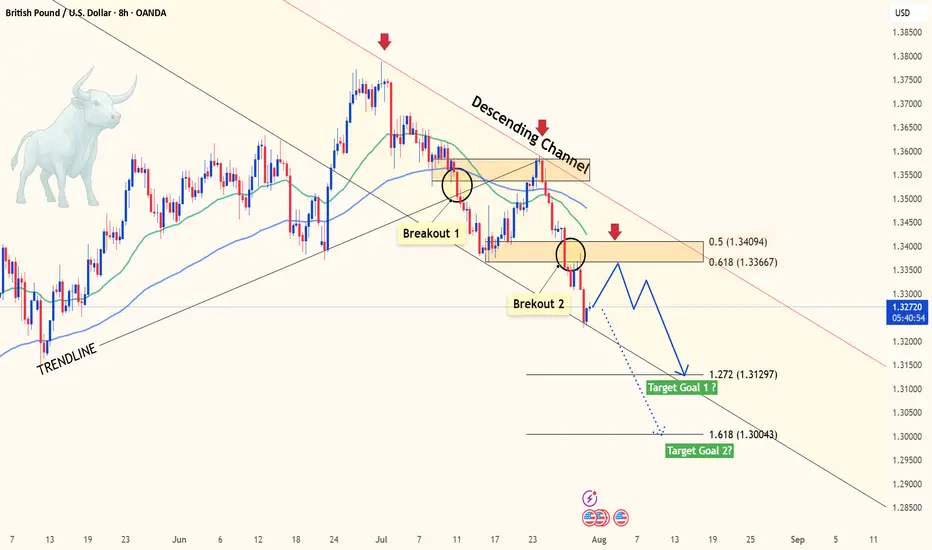
GBPUSD slipping fast – Is 1.30 the next magnet?Hey traders, what’s your take on GBPUSD today?
Overall, the pair is deepening its bearish trend after losing the key 1.3400 level. At the time of writing, GBPUSD is hovering around 1.3272 with no signs of a short-term bottom in sight.
The main catalyst for this drop is the strong bullish momentum of the U.S. dollar. A series of upbeat U.S. economic data – including jobs reports, personal consumption expenditures (PCE), and consumer confidence – all exceeded expectations, fueling USD strength. Meanwhile, the Bank of England (BoE) remains cautious amid slowing growth and cooling inflation, offering little support for the pound.
From a technical perspective, momentum has clearly shifted in favor of the bears. Price remains pressured below both the 34 and 89 EMAs, confirming strong downside momentum. The previous break below the rising trendline and failure to hold above the prior support zone – around the 0.5–0.618 Fibonacci retracement – further supports the ongoing bearish bias.
Looking ahead, if the selling pressure continues and the current support gives way, GBPUSD could fall toward the 1.272 Fibonacci extension at 1.3129. If that level fails to hold, 1.3004 (Fibo 1.618) becomes the next key downside target. These are crucial zones to monitor for potential price reactions in the coming sessions.
In short, the probability of further downside is higher than a meaningful recovery. With both technical and macro forces favoring the bears, GBPUSD may remain under pressure in the days ahead – unless a strong catalyst from the UK emerges to shift sentiment. What’s your outlook on this scenario? Let’s discuss in the comments below!
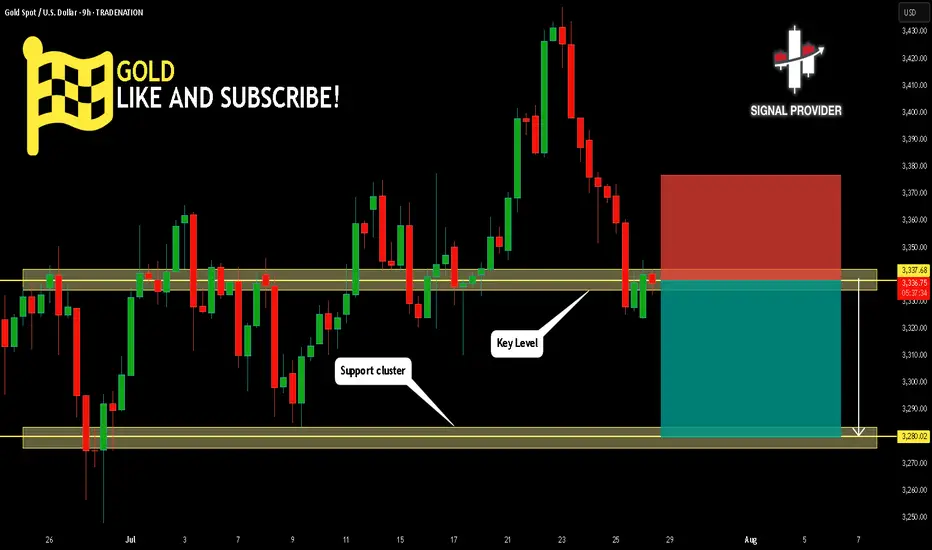
GOLD Will Move Lower! Sell!
Here is our detailed technical review for GOLD.
Time Frame: 9h
Current Trend: Bearish
Sentiment: Overbought (based on 7-period RSI)
Forecast: Bearish
The market is testing a major horizontal structure 3,337.68.
Taking into consideration the structure & trend analysis, I believe that the market will reach 3,280.02 level soon.
P.S
The term oversold refers to a condition where an asset has traded lower in price and has the potential for a price bounce.
Overbought refers to market scenarios where the instrument is traded considerably higher than its fair value. Overvaluation is caused by market sentiments when there is positive news.
Disclosure: I am part of Trade Nation's Influencer program and receive a monthly fee for using their TradingView charts in my analysis.
Like and subscribe and comment my ideas if you enjoy them!
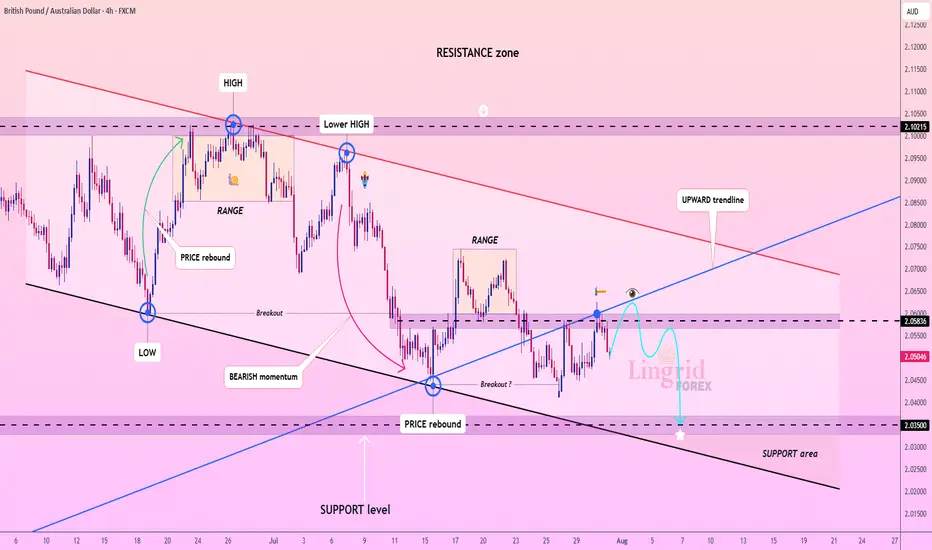
Lingrid | GBPAUD Bearish Pressure. Potential ShortThe price perfectly fulfilled my previous idea . FX:GBPAUD rebounded from support and has climbed into a tight resistance zone near 2.05836, but momentum remains weak near the downward trendline. The price structure shows a sequence of lower highs and a tight range below resistance, suggesting sellers are still in control. A rejection at this level would confirm another failed breakout attempt. If confirmed, the pair could revisit the 2.03500 support area with bearish continuation pressure.
📌 Key Levels
Sell trigger: Rejection at 2.05836 and break of 2.05000
Sell zone: 2.05800–2.06000
Target: 2.03500
Invalidation: Strong break and close above 2.06000
💡 Risks
Bullish breakout above trendline resistance
Fundamental surprise (UK/AU economic data)
Shift in broader risk sentiment or AUD weakness
If this idea resonates with you or you have your own opinion, traders, hit the comments. I’m excited to read your thoughts!
Lingrid | DOGEUSDT Pullback and Continuation OpportunityBINANCE:DOGEUSDT is currently testing the intersection of its upward channel support and a critical horizontal zone near 0.21378, after a steep corrective decline from the 0.28628 resistance area. The recent price action formed a rounded pullback, suggesting potential accumulation near trendline confluence. A bullish bounce here could trigger a strong rally toward 0.26350 as shown by the projected upward path. Failure to hold the 0.21000 area would expose the pair to deeper downside toward the 0.15706 support.
📌 Key Levels
Buy zone: 0.21000–0.21700
Buy trigger: Break and close above 0.23000
Target: 0.26350
Invalidation: Break below 0.21000
⚠️ Risks
Breakdown of ascending trendline support
Weak volume on upward breakout
Broader market weakness impacting altcoins
If this idea resonates with you or you have your own opinion, traders, hit the comments. I’m excited to read your thoughts!

EURUSD breakdown alert – Will the drop accelerate?Hello traders, let’s take a look at how EURUSD is performing today!
Yesterday, EURUSD extended its downward slide after failing to sustain bullish momentum from the 1.1600 zone. The pair is now hovering around 1.1426.
The recent decline is largely attributed to the strength of the US dollar, which continues to benefit from a series of upbeat economic data – including robust job reports, strong consumer spending, and improving sentiment. All of these came in above expectations, pushing the dollar higher. In contrast, the European Central Bank (ECB) maintains a cautious stance, with no clear signals of policy changes – leaving the euro under persistent pressure.
From a technical standpoint, the short-term outlook suggests the beginning of a new bearish wave. Notably, price action is reacting to resistance from the nearby EMA 34 and EMA 89 levels. The break below the recent support zone has added fuel to the ongoing bearish momentum.
If the current support fails to hold, EURUSD could slip further toward the 1.272 Fibonacci extension at 1.1305, and potentially as low as 1.1178 – the 1.618 extension level.
Looking ahead, traders should focus on potential pullback opportunities, targeting SELL entries around 1.1540–1.1580 – a confluence zone of technical interest. However, if price breaks above the 1.1600 threshold and holds, this bearish scenario may be invalidated.
What’s your outlook for EURUSD in the coming days? Share your thoughts in the comments below!

Gold is Falling Sharply – Will It Keep Falling?Hello dear traders, what’s your view on XAUUSD?
Yesterday, XAUUSD continued its strong downtrend and is now trading around 3,296 USD.
The recent drop in gold is largely due to the strengthening U.S. dollar, following the Federal Reserve’s decision to hold interest rates steady as expected — despite sharp criticism from President Donald Trump.
Technically speaking, after breaking below the rising trendline, gold failed to retest successfully and plunged further, confirming that the bearish trend is now in control. Price is currently moving below key moving averages, and the structure has clearly formed a sequence of lower highs and lower lows — reinforcing the likelihood of continued downside.
If a pullback occurs before the next leg down, the Fibonacci 0.5 and 0.618 retracement zone — which aligns with the EMA 34 and 89 and a major resistance level — will be a key area to watch. This could present a prime opportunity for breakout and trend-following traders.
Looking ahead, the next key support sits near 3,220 USD. If this level breaks, gold may head toward the 3,162 USD zone.
What do you think? Will gold keep falling, or will buyers step in? Drop a comment and hit follow to catch the next big move!

Closed Longs, Now Selling Rallies on EURUSD ReversalAs mentioned in my previous posts, I’m been bullish on EURUSD in the medium term, targeting 1.20 and even beyond.
But no pair—especially not EURUSD, which tends to move more steadily and rationally—goes up in a straight line.
________________________________________
🔹 Last week, the pair stalled just below 1.18, and I decided to close my long trade with a +150 pip gain. That proved to be a wise call, as price dropped hard shortly after.
________________________________________
📉 What’s happening now?
• EURUSD has broken below the rising trendline
• More importantly, it’s broken below the neckline of a double top pattern
• Now trading around 1.1535
This opens the door for a deeper correction, and I expect we could see a test of the 1.1150–1.1100 zone by the end of summer.
________________________________________
📌 Trading Plan:
• I’m now in sell-the-rally mode
• Ideal short entry: around 1.1650, where we also get a favorable 1:3+ risk-reward
• Watch also for interim support around 1.1400
________________________________________
Conclusion:
The bigger picture remains bullish— but this correction looks healthy and isn’t done yet.
Selling rallies makes more sense now, until the structure tells us otherwise.
Disclosure: I am part of TradeNation's Influencer program and receive a monthly fee for using their TradingView charts in my analyses and educational articles.
Gold Weekly Outlook (XAUUSD) -28th JulyGold Enters a High-Stakes Week
This week sets the stage for major moves in gold. The charts are signalling liquidity grabs, premium compression, and volatility driven by upcoming macro catalysts.
Key events ahead:
Tuesday: ADP Employment Data
Wednesday: The Fed
Gold is currently consolidating beneath a critical supply zone, suggesting potential for a breakout or rejection. We'll align macro drivers with Smart Money Concepts, ICT methodology, Fibonacci levels, EMAs, RSI, and Fair Value Gaps to craft a precise trading framework.
Technically, price action reflects a corrective phase within a broader uptrend. Confluence support from the ascending trendline and a key horizontal level is in play. As long as price remains above 3342, a bounce toward 3400 remains the preferred scenario.
The broader bullish structure and underlying momentum suggest that once this retracement completes, the uptrend may resume with strength.
🟡 – Summary
🔹 Macro & HTF View:
Bias: Bullish but weakening under premium supply
Key Events: ADP (Tue), FOMC (Wed) → potential for liquidity grabs
Indicators:
RSI divergence (75 → 66)
EMAs flattening
Unfilled FVGs above (3365–3405) and below (3280–3320)
Key Fib targets: 3405 (127%) and 3439 (161.8%)
🔸 Weekly Key Zones
Supply (Short Trap): 3350–3439 → heavy confluence, short bias unless W1 closes above 3439
Primary Demand: 3220–3285 → ideal for news-driven long
Deep Discount (Long Only if Panic): 2960–3050
🎯 Strategy Summary
Short Setup:
Target 3350–3439 → wait for rejection after news
Long Setup:
Target 3220–3285 or deeper
Look for wick rejections + bullish structure reclaim
Avoid: 3285–3350 → indecision zone
🧭 Daily Zones
Sell Zone: 3345–3415 → trap area with FVG + Fib + EMA confluence
Buy Zones:
3290–3320 (primary)
3240–3270 (deeper)
3000–3140 (only if USD spikes)
⏱ H4 + Intraday Bias
Bias: Bearish below 3350
Short Zones:
3365–3405 (rejection only)
3355 (flip zone)
Buy Zones:
3290–3310 (reclaim setup)
3250–3280 (panic flush)
📌 Key Intraday Levels
Resistance: 3405, 3385, 3375–3350, 3350–3340
Support: 3314–3302, 3289–3272, 3260, 3240
⚠️ Final Execution Notes
Stay out of 3340–3326 zone – it’s chop
Wait for confirmation candles (engulfing, pin bars, OB reactions)
Discipline over prediction. Sniper mode only.
Disclaimer: For educational context only.

GOLD recovers after many days of declineOANDA:XAUUSD has recovered after several days of declines. Investors will focus on the Federal Reserve's interest rate decision on Wednesday, which is expected to cause significant market volatility.
Gold hit a three-week low of $3,301 an ounce on Monday, before recovering somewhat on Tuesday after falling for a fourth straight day as the dollar erased some of its earlier gains, boosting demand for the precious metal.
Falling US Treasury yields and a weak US jobs report also prompted investors to buy gold.
Data released by the U.S. Labor Department on Tuesday showed the number of jobs added fell in June after two straight months of gains.
The number of jobs added in June fell to 7.44 million from a revised 7.71 million in May. The median forecast of economists in a survey was 7.5 million.
Focus on the Federal Reserve's decision
The Federal Reserve will announce its interest rate decision at 01:00 IST on Thursday; Federal Reserve Chairman Powell will hold a press conference on monetary policy at 01:30 IST on the same day.
The market generally expects the Federal Reserve to keep interest rates unchanged, with the focus on whether Fed Chairman Powell's speech will provide any clues about the timing or pace of future rate cuts.
The market sees a very low chance of a rate cut in July and a roughly 40% chance of another rate cut in September, up from about 10% last month, according to the Chicago Mercantile Exchange's FedWatch tool. Investors will be closely watching the statement and Fed Chairman Powell's remarks at his post-meeting press conference for fresh clues on the timing of the next rate cut.
- If Powell opens the door to a rate cut in September, citing the recent trade deal as a reason to ease uncertainty, US Treasury yields could fall immediately, paving the way for gold prices to rise.
- On the other hand, if Powell avoids committing to a rate cut at this meeting, citing recent rising inflation data, gold prices could fall.
Gold typically performs well in low-interest-rate environments because it does not pay interest and its appeal increases when returns from other assets decline.
Technical Outlook Analysis OANDA:XAUUSD
Gold has recovered from the key $3,300 price point and is holding above $3,310, which is also the nearest support. However, the current recovery is not technically enough to create a short-term uptrend, or conditions for a sustained price increase. In terms of position, gold is under pressure with the 21-day EMA as the nearest resistance at around $3,340 – $3,350. If gold falls below the 0.382% Fibonacci retracement level, it will be eligible to open a new downtrend with a target of around $3,246 in the short term, more than the 0.50% Fibonacci retracement level.
On the other hand, RSI is below 50, and the current 50 level acts as momentum resistance in the short term. If RSI slopes down, it will signal bearish momentum with more downside ahead. For gold to qualify for bullish expectations, it needs to at least push price action above EMA21, then retrace back to the price channels and finally break above the 0.236% Fibonacci retracement level to confirm bullish conditions. The upside target could be towards $3,400 in the short term, more like $3,430 – $3,450.
For the day, the technical outlook for gold prices tends to lean more towards the downside, with the following notable points listed.
Support: 3,310 – 3,300 – 3,292 USD
Resistance: 3,340 – 3,350 – 3,371 USD
SELL XAUUSD PRICE 3376 - 3374⚡️
↠↠ Stop Loss 3380
→Take Profit 1 3368
↨
→Take Profit 2 3362
BUY XAUUSD PRICE 3280 - 3282⚡️
↠↠ Stop Loss 3276
→Take Profit 1 3288
↨
→Take Profit 2 3294
Gold’s Next Move: Bounce or Breakdown?Gold is pulling back after breaking the 3,360 USD resistance on the 6-hour chart. Price is currently testing the nearest fair value gap (3,370–3,380), but upside momentum is stalling, partly due to unfilled supply zones above.
A retest of the lower FVG near 3,340 will be key. Holding above this level could trigger renewed buying, while a break below may invalidate the bullish structure.
Traders should closely monitor whether downside gaps continue to fill and how price behaves near support zones. Lack of strong liquidity could lead to a false breakout.

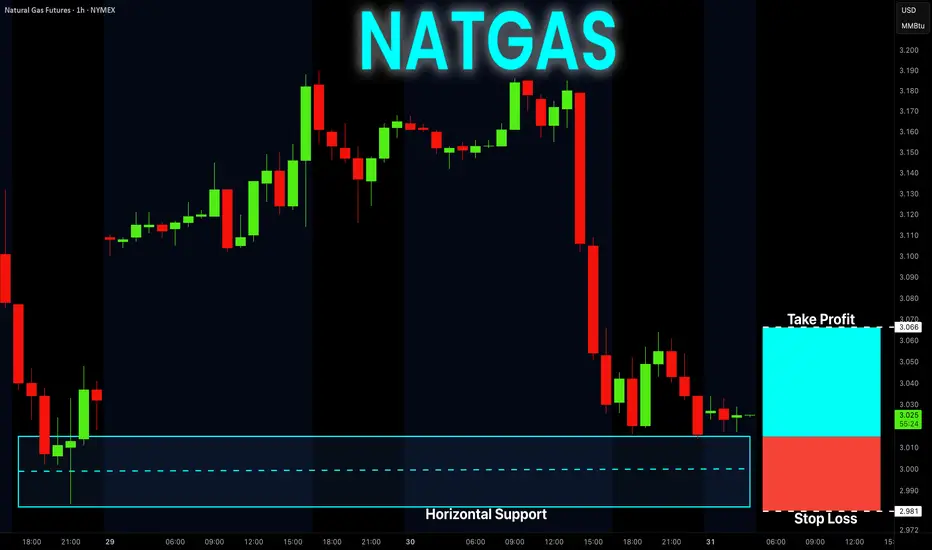
NATGAS Free Signal! Buy!
Hello,Traders!
NATGAS went down and
Almost reached the horizontal
Support of 3.014$ from where
We can enter a long trade
With the Take Profit of 3.066$
And the Stop Loss of 2.981$
Buy!
Comment and subscribe to help us grow!
Check out other forecasts below too!
Disclosure: I am part of Trade Nation's Influencer program and receive a monthly fee for using their TradingView charts in my analysis.
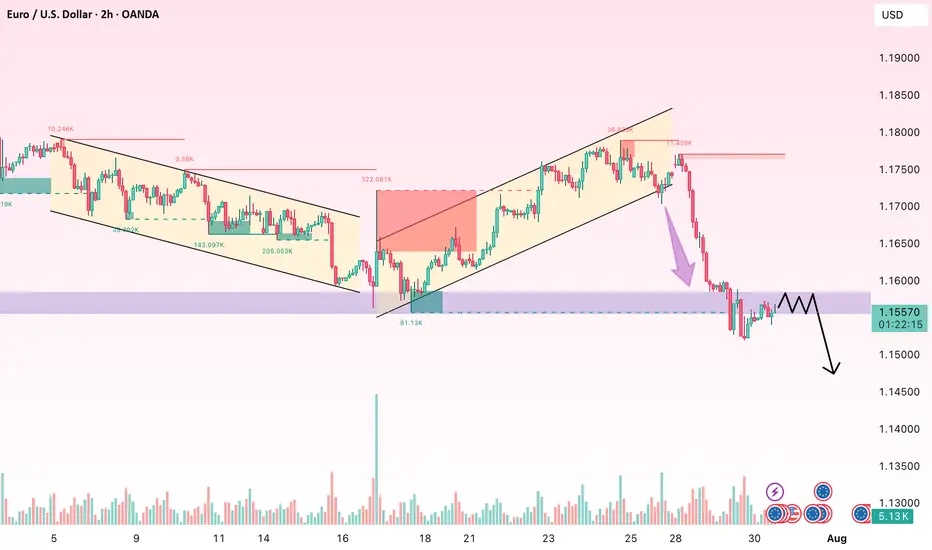
EUR/USD: A Fragile Rebound Within a Broader Bearish TrapEUR/USD has managed to stage a slight recovery after plunging through the key 1.1680 support — a level that had held firm for two weeks. The pair is now hovering just above 1.1500, but the bounce appears shallow and unconvincing. Volume remains low, momentum indicators offer little confirmation, and the broader structure still points to a prevailing downtrend.
On the H2 chart, price has rebounded from the 1.1505 area — a minor support formed during July's short-term consolidation. Yet, the EMA slope remains strongly negative, and RSI is struggling below the neutral 50 mark after exiting oversold territory. The structure continues to display classic lower highs and lower lows, with the 1.1585–1.1600 zone emerging as a potential resistance area for bears to re-enter.
From a macro perspective, the U.S. dollar remains supported by expectations that the Fed will maintain a hawkish stance, fueled by solid GDP, durable goods, and PCE data. In contrast, the Eurozone struggles with signs of stagnation, with both services and manufacturing PMIs deteriorating — most notably in Germany. This policy divergence continues to favor the greenback.
Unless bulls manage to decisively reclaim the 1.1600 zone with strong follow-through buying, any rebound risks being nothing more than a dead cat bounce. The downside target remains near 1.1460 – 1.1440 in the near term.