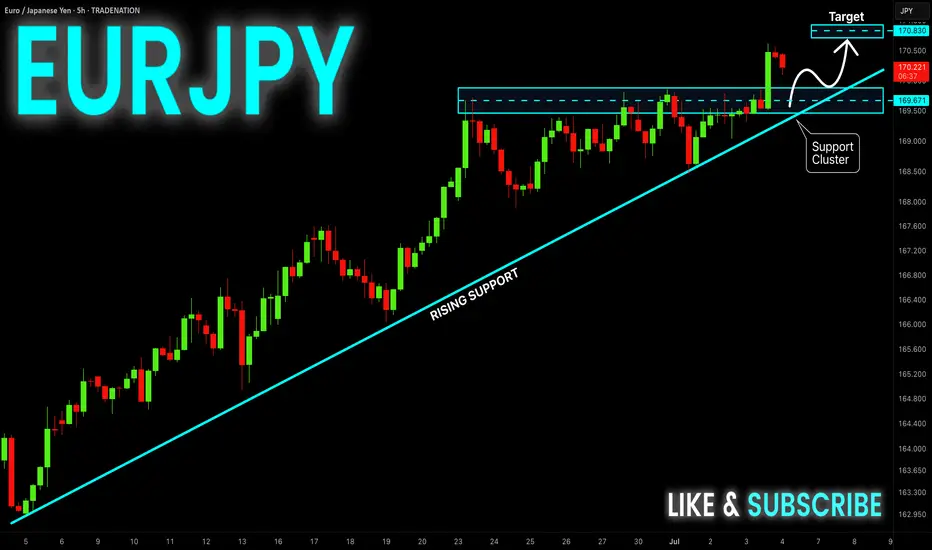
EUR-JPY Will Keep Growing! Buy!
Hello,Traders!
EUR-JPY is trading in an
Uptrend and the pair broke
The key horizontal level
Of 169.814 and the breakout
Is confirmed so after a potential
Retest of the support cluster
Of the rising and horizontal
Support lines below we will
Be expecting a bullish continuation
Buy!
Comment and subscribe to help us grow!
Check out other forecasts below too!
Disclosure: I am part of Trade Nation's Influencer program and receive a monthly fee for using their TradingView charts in my analysis.
Signals
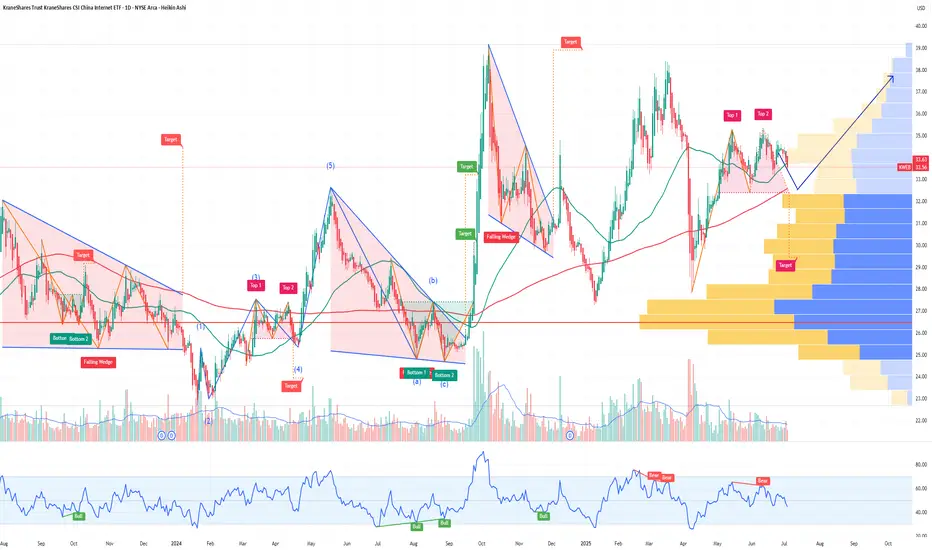
KWEB: China’s Internet Sector - AI Catch-Up and Cheap ValuationsChina’s internet and tech stocks have been hammered for years — regulatory crackdowns, slowing growth fears, and geopolitical tension have crushed sentiment. But as investors know, the best opportunities often hide in what everyone hates.
Enter KWEB, the KraneShares CSI China Internet ETF.
It’s a diversified, liquid way to play a bounce in major names like Alibaba, Tencent, JD .com, Baidu, Meituan and PDD.
Here’s why I think the risk/reward looks compelling now — especially if you believe in AI closing the gap.
Key Bullish Points:
1) Valuations at Rock-Bottom
Many big China internet stocks are still trading at single-digit P/E ratios, even as their cash flows recover. Compared to U.S. big tech trading at 30–50x, this is a huge valuation gap.
Regulatory fears seem largely priced in — Beijing wants growth, not stagnation, and some policies are easing.
2) China’s AI Push — Just “Months Behind”
Jansen Whang recently argued that China’s generative AI development is only “months behind” the U.S. Players like Baidu, Alibaba Cloud, Tencent, and SenseTime are all racing to launch new LLMs and integrated AI tools.
If you believe the gap closes, Chinese platforms could see a major earnings rebound as they roll out AI upgrades across search, cloud, e-commerce and social media.
3) Sentiment So Bad, It’s Good
When the headlines scream “China is uninvestable,” that’s often when big mean reversion trades set up. Even a small policy pivot, stimulus plan, or positive AI news cycle can spark a sharp rally.
KWEB is one of the cleanest ways to express this view because it holds a diversified basket — you don’t have to pick a single winner.
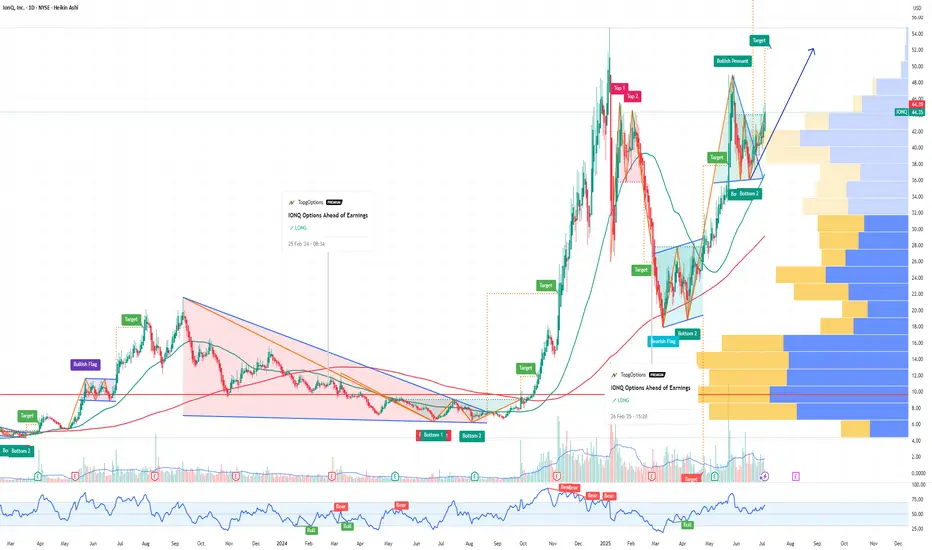
Why IonQ (IONQ) Could Be the NVDA of Quantum ComputingIf you haven`t bought IONQ before the rally:
Now you need to know that IonQ isn’t just another speculative quantum stock — The company is building a robust ecosystem around its best‑in‑class trapped‑ion architecture and targeting fault‑tolerant, networked quantum systems. With record bookings, major acquisitions, and a strong balance sheet, IonQ could emerge as the NVIDIA equivalent for quantum infrastructure.
Key Bullish Arguments
1) Superior Quantum Tech – Trapped‑Ion Advantage
IonQ’s trapped-ion processors boast 99.9% two-qubit fidelity, demonstrating higher accuracy and scalability than superconducting alternatives
These systems also operate at room temperature, meaning simpler deployment and lower costs
2) Ecosystem Strategy & Acquisitions
The $1.08B acquisition of Oxford Ionics (expected close in 2025) expands IonQ’s qubit control tech, pushing toward planned 80,000 logical‑qubit systems by decade’s end
Combined with ID Quantique and Lightsynq, IonQ is building a full-stack quantum and networking offering
3) Strong Revenue Growth & Cash Runway
Revenue soared from $22M in 2023 to $43.1M in 2024, with bookings of $95.6M
. Q1 2025 saw $7.6M revenue and EPS –$0.14, beating expectations; cash reserves near $697M provide years of runway
4) Real Commercial Deployments
IonQ sold its Forte Enterprise quantum system to EPB ($22M deal) for hybrid compute and networking, marking real-world commercial applications
5) AI & Quantum Synergy
Involvement in NVIDIA’s Quantum Day and hybrid quantum‑classical AI demos (e.g., blood pump simulation with Ansys, ~12 % faster) indicates strategic synergy and positions IonQ as a critical piece in the future AI stack
Recent Catalysts:
Texas Quantum Initiative passes – positions IonQ at forefront of U.S. state-backed innovation
Oxford Ionics acquisition pending – major expansion in qubit scale & tech
Barron’s analyst buys – industry analysts see long-term potential; IonQ among top quantum picks
Broader quantum optimism – McKinsey & Morgan Stanley forecasts highlight synergy between quantum and AI, benefiting IonQ
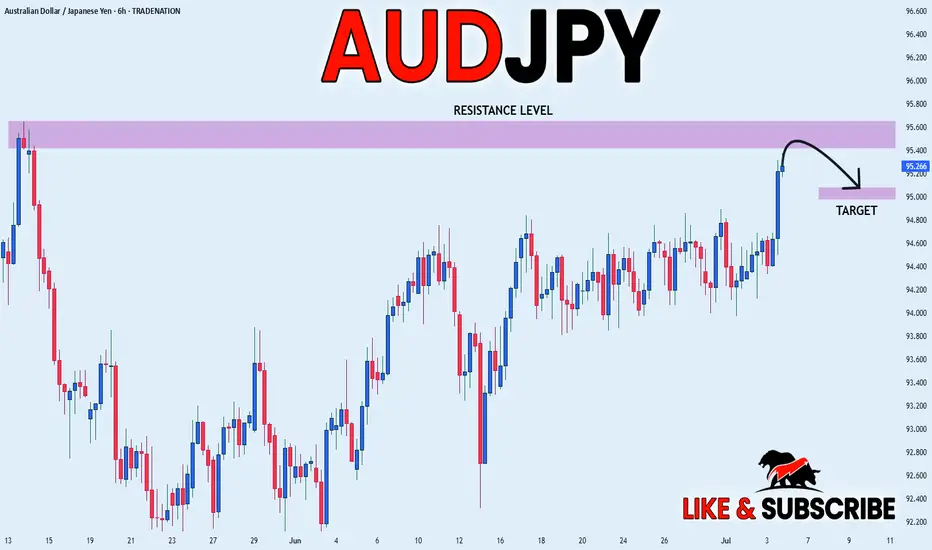
AUD_JPY RISKY SHORT|
✅AUD_JPY is set to retest a
Strong resistance level above at 95.600
After trading in a local uptrend for some time
Which makes a bearish pullback a likely scenario
With the target being a local support below at 95.081
SHORT🔥
✅Like and subscribe to never miss a new idea!✅
Disclosure: I am part of Trade Nation's Influencer program and receive a monthly fee for using their TradingView charts in my analysis.
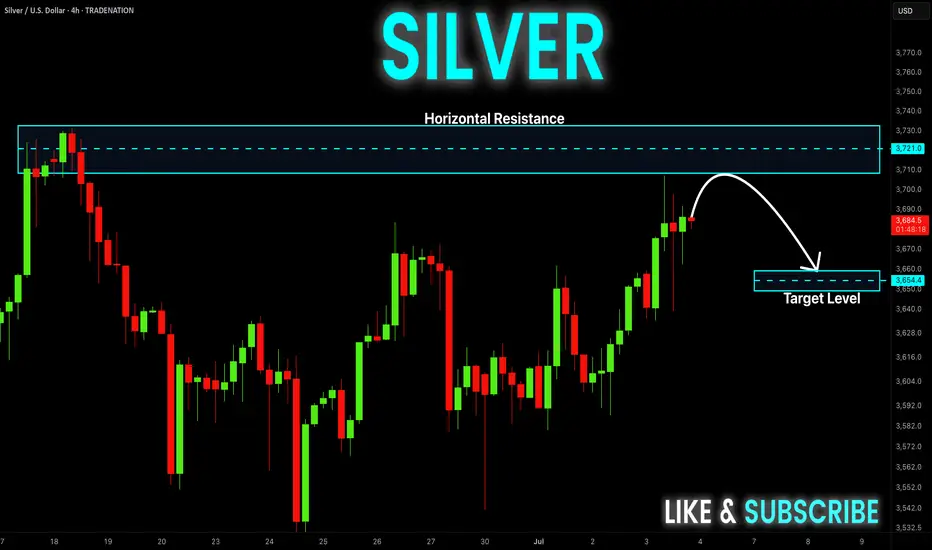
SILVER Short From Resistance! Sell!
Hello,Traders!
SILVER is trading in an
Uptrend but the price will
Soon hit a horizontal resistance
Area around 37,32$ from
Where we will be expecting
A local bearish correction
Sell!
Comment and subscribe to help us grow!
Check out other forecasts below too!
Disclosure: I am part of Trade Nation's Influencer program and receive a monthly fee for using their TradingView charts in my analysis.
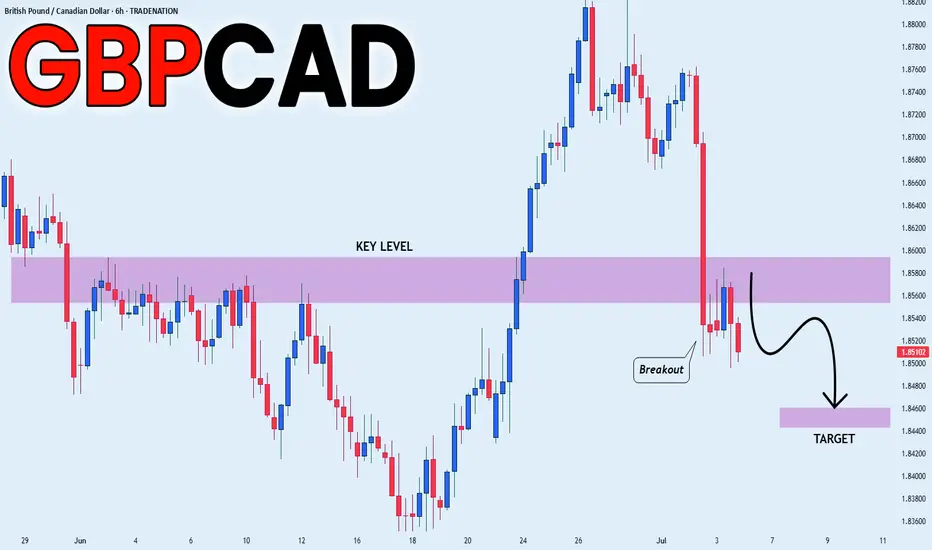
GBP_CAD BEARISH BREAKOUT|SHORT|
✅GBP_CAD broke the key structure level of 1.8580
While trading in an local downtrend
Which makes me bearish
And as the retest of the level is complete
Bearish continuation will follow
SHORT🔥
✅Like and subscribe to never miss a new idea!✅
Disclosure: I am part of Trade Nation's Influencer program and receive a monthly fee for using their TradingView charts in my analysis.
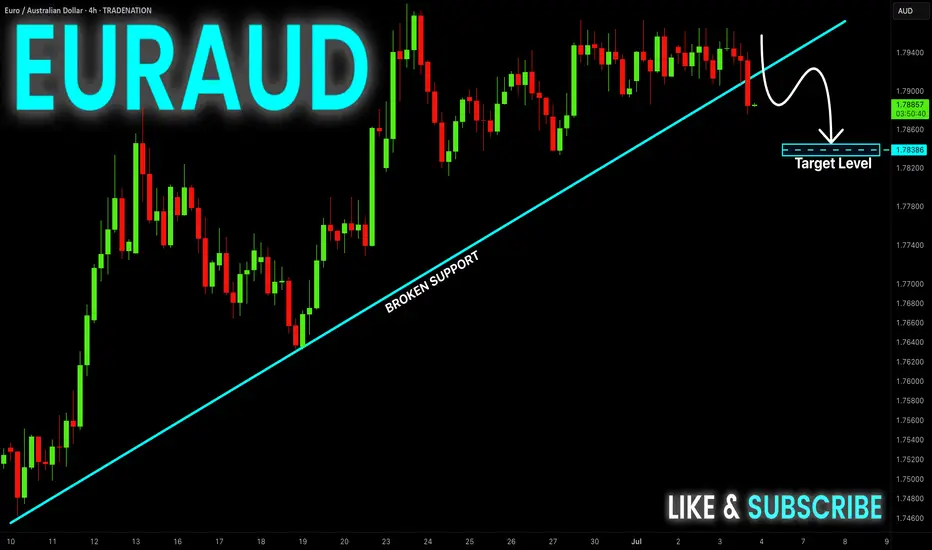
EUR-AUD Bearish Breakout! Sell!
Hello,Traders!
EUR-AUD was trading along
The rising support line but
Now we are seeing a bearish
Breakout so we are bearish
Biased and we will be expecting
A further bearish move down
Sell!
Comment and subscribe to help us grow!
Check out other forecasts below too!
Disclosure: I am part of Trade Nation's Influencer program and receive a monthly fee for using their TradingView charts in my analysis.
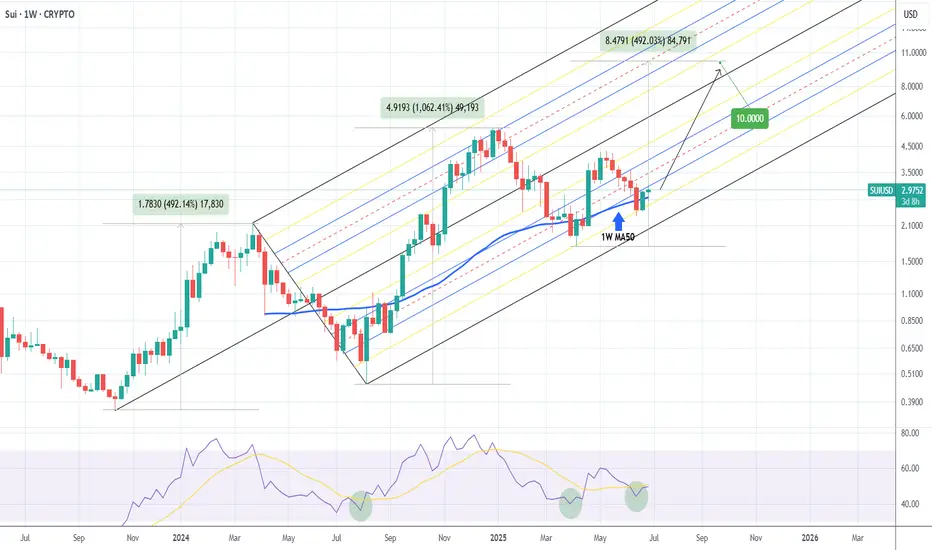
SUI Historic Pitchfork targets $10 at least!Sui (SUIUSD) has been staging a bounce attempt on its 1W MA50 (blue trend-line) since last week and if the current 1W candle closes in green, it will be the first 2-week green streak of Sui since March 24.
There are high probabilities of a sustainable rebound here, that may very well turn into a strong parabolic rally, similar to those of August - December 2024 and October 2023 - March 2024.
The reason is that the price hit and is staging this rebound attempt on the 0.786 level of the Pitchfork, which is where it started the April 07 2025 rally.
If we repeat the 'shortest' of those parabolic rallies (+492.14%), then we should hit $10.00 at least, which will also test the 0.236 level of the Pitchfork.
-------------------------------------------------------------------------------
** Please LIKE 👍, FOLLOW ✅, SHARE 🙌 and COMMENT ✍ if you enjoy this idea! Also share your ideas and charts in the comments section below! This is best way to keep it relevant, support us, keep the content here free and allow the idea to reach as many people as possible. **
-------------------------------------------------------------------------------
💸💸💸💸💸💸
👇 👇 👇 👇 👇 👇
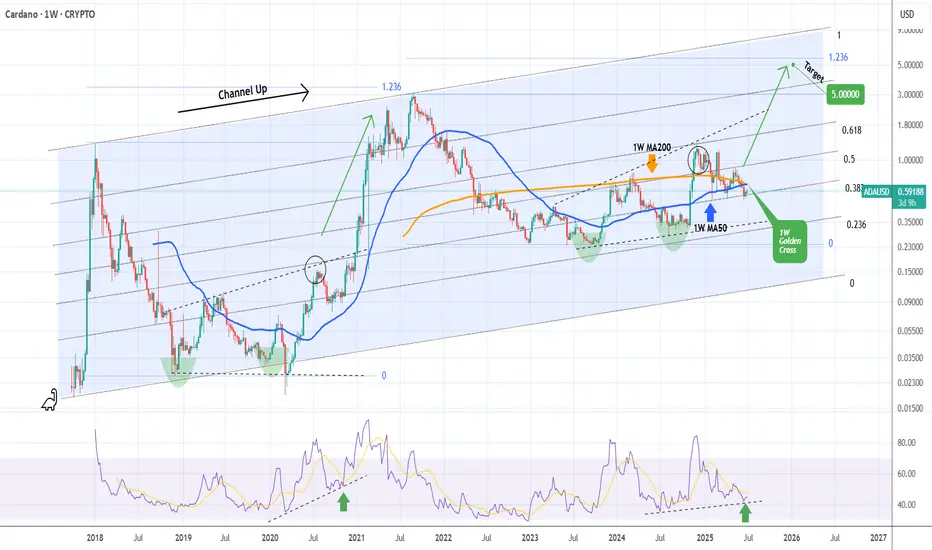
ADAUSD Is this 1W Golden Cross what the market needs??Cardano (ADAUSD) just formed a 1W Golden Cross this week, the first in its history, amidst a continuous bearish sequence since the December 02 2024 High. With its 1W RSI just below neutrality, this simply highlights the undervalued condition of this token relative not only to the rest of the high cap market, but also to its previous Bull Cycle.
As you can see, based both on 1W RSI and price action terms, we may be in a consolidation phase similar to September - November 2020, at the end of a Megaphone pattern. That pattern was the Accumulation vessel of the Cycle that led to the massive 2021 parabolic rally and the eventual Cycle Top / Higher High of the historic Channel Up.
According to that, we should be expecting a 1.236 Fibonacci extension test, targeting $5.000.
-------------------------------------------------------------------------------
** Please LIKE 👍, FOLLOW ✅, SHARE 🙌 and COMMENT ✍ if you enjoy this idea! Also share your ideas and charts in the comments section below! This is best way to keep it relevant, support us, keep the content here free and allow the idea to reach as many people as possible. **
-------------------------------------------------------------------------------
💸💸💸💸💸💸
👇 👇 👇 👇 👇 👇
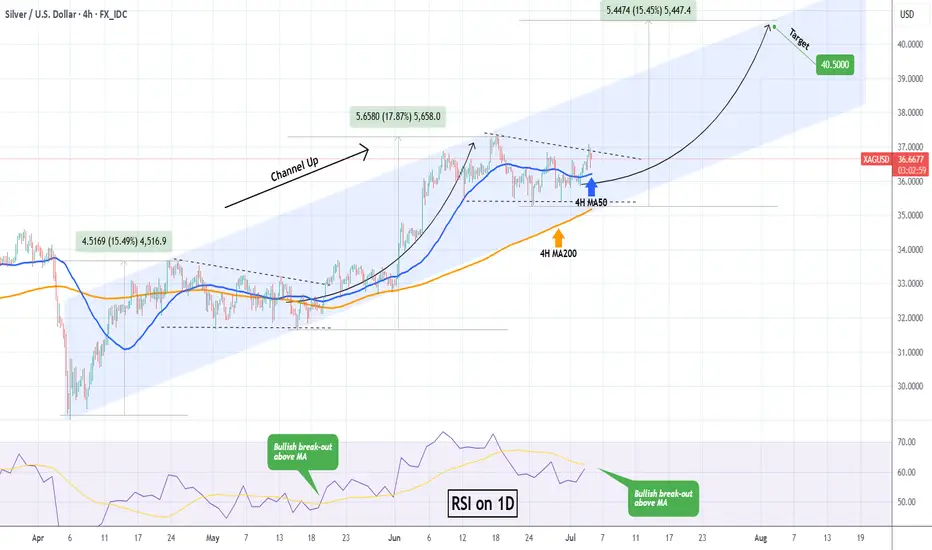
XAGUSD Strong accumulation waiting for a break-out. Silver (XAGUSD) has been trading within a 3-month Channel Up pattern and since the June 18 Higher High, it has entered a Descending Triangle.
This has previous been an Accumulation pattern, which after broken to the upside, it led to June's High. Similarly, we expect a bullish break-out once the 4H RSI breaks above its MA, and as long as the 4H MA200 (orange trend-line) holds, we expect a +15.50% minimum rise (like the first Bullish Leg of the Channel Up), with our Target se at 40.500.
-------------------------------------------------------------------------------
** Please LIKE 👍, FOLLOW ✅, SHARE 🙌 and COMMENT ✍ if you enjoy this idea! Also share your ideas and charts in the comments section below! This is best way to keep it relevant, support us, keep the content here free and allow the idea to reach as many people as possible. **
-------------------------------------------------------------------------------
💸💸💸💸💸💸
👇 👇 👇 👇 👇 👇
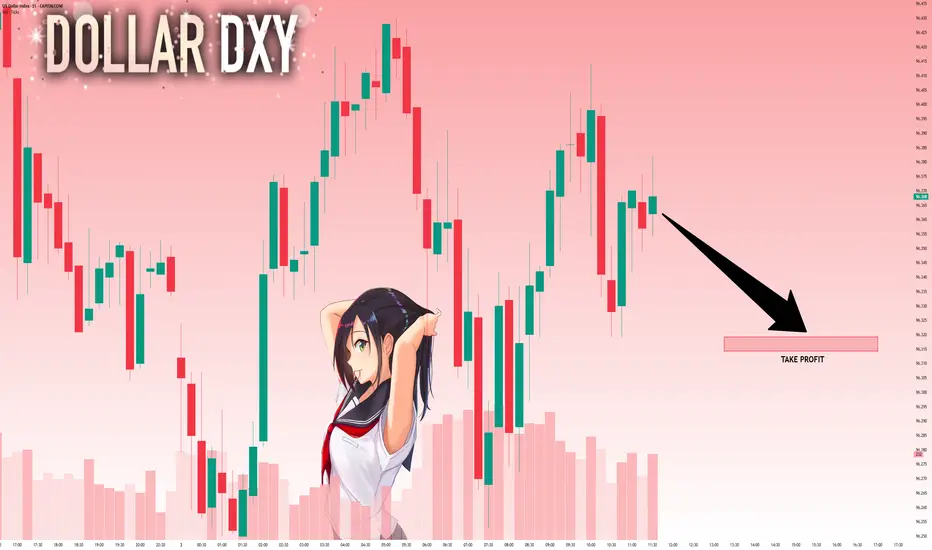
DXY: Next Move Is Down! Short!
My dear friends,
Today we will analyse DXY together☺️
The market is at an inflection zone and price has now reached an area around 96.362 where previous reversals or breakouts have occurred.And a price reaction that we are seeing on multiple timeframes here could signal the next move down so we can enter on confirmation, and target the next key level of 96.319..Stop-loss is recommended beyond the inflection zone.
❤️Sending you lots of Love and Hugs❤️
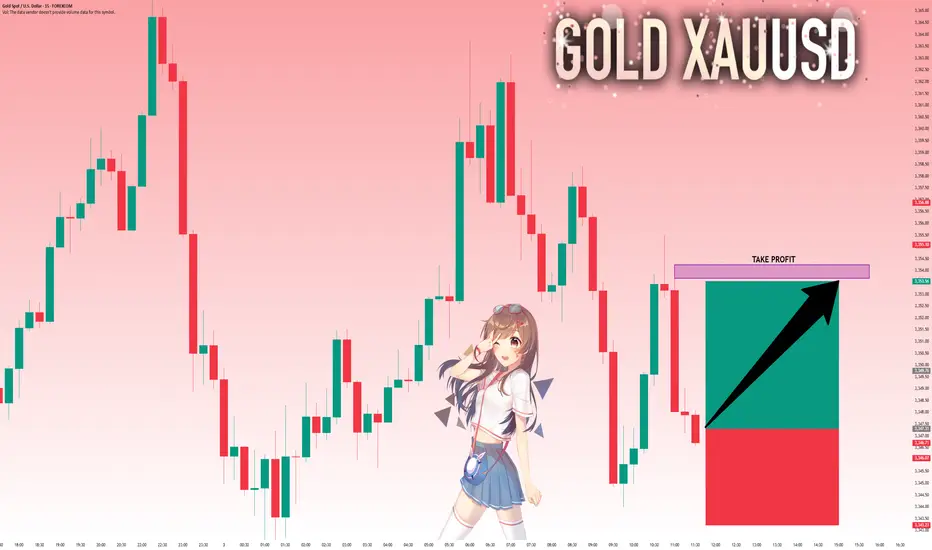
GOLD: Target Is Up! Long!
My dear friends,
Today we will analyse GOLD together☺️
The price is near a wide key level
and the pair is approaching a significant decision level of 3,347.31 Therefore, a strong bullish reaction here could determine the next move up.We will watch for a confirmation candle, and then target the next key level of 3,353,67.Recommend Stop-loss is beyond the current level.
❤️Sending you lots of Love and Hugs❤️
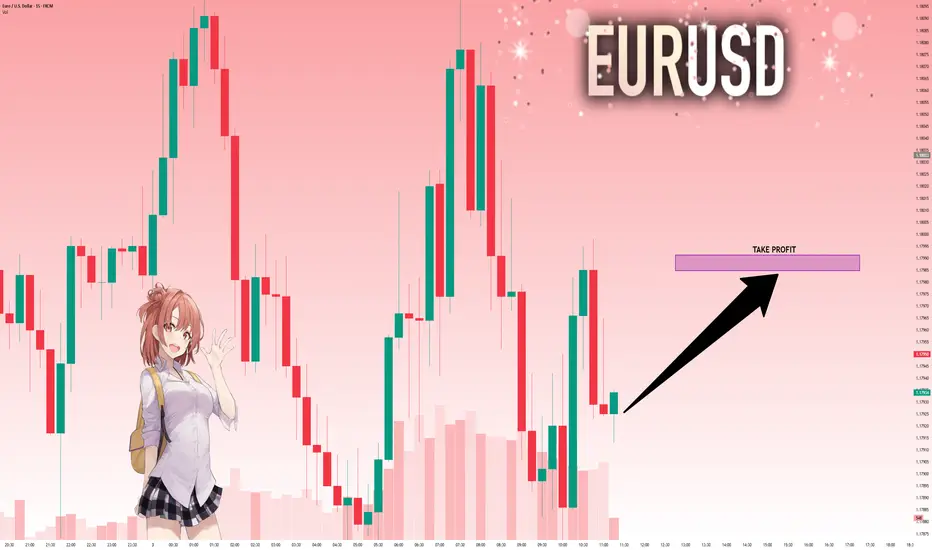
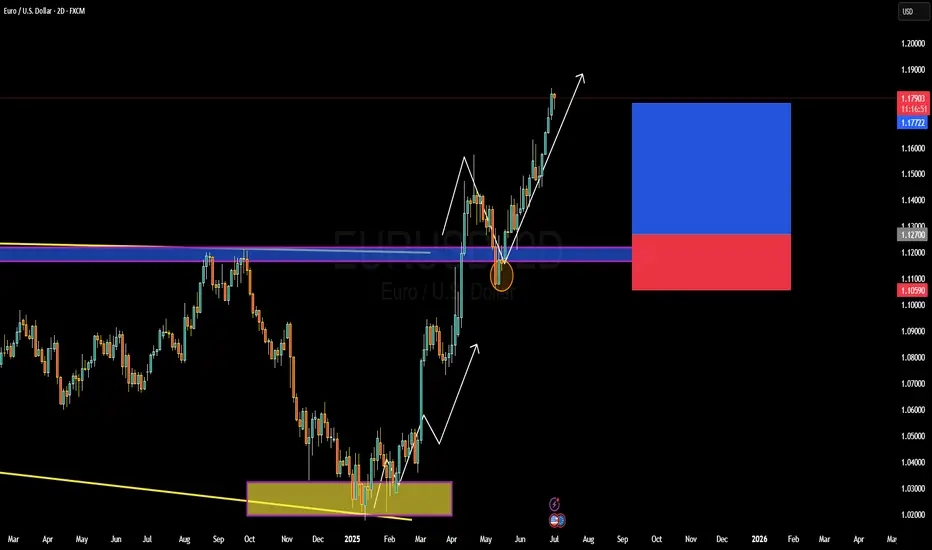
EURUSD: Move Up Expected! Long!
My dear friends,
Today we will analyse EURUSD together☺️
The recent price action suggests a shift in mid-term momentum. A break above the current local range around 1.17930v will confirm the new direction upwards with the target being the next key level of 1.17985 and a reconvened placement of a stop-loss beyond the range.
❤️Sending you lots of Love and Hugs❤️
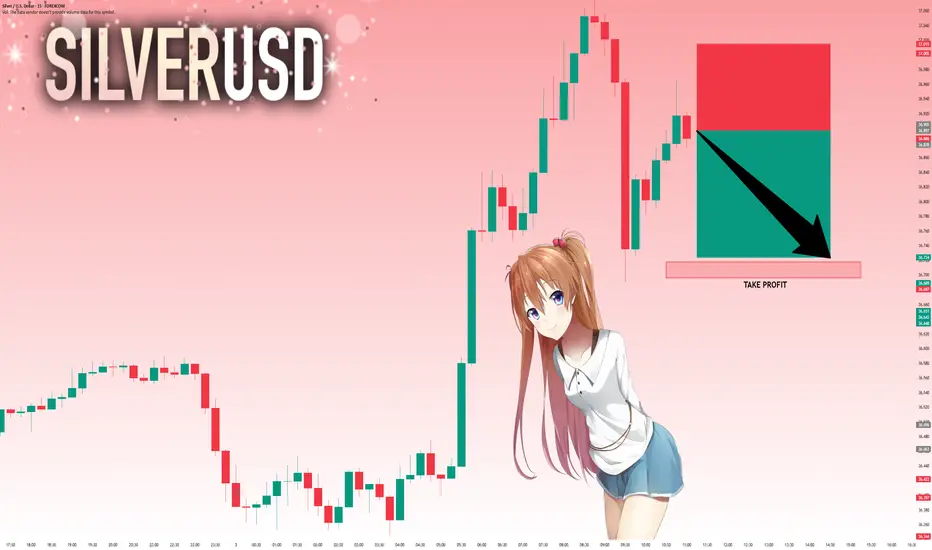
SILVER: Local Bearish Bias! Short!
My dear friends,
Today we will analyse SILVER together☺️
The in-trend continuation seems likely as the current long-term trend appears to be strong, and price is holding below a key level of 36.897 So a bearish continuation seems plausible, targeting the next low. We should enter on confirmation, and place a stop-loss beyond the recent swing level.
❤️Sending you lots of Love and Hugs❤️
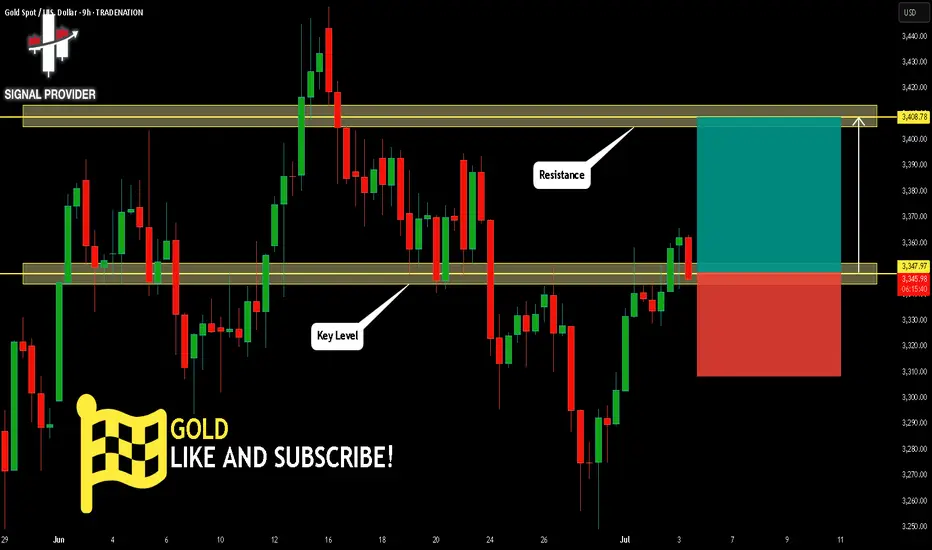
GOLD Will Move Higher! Long!
Here is our detailed technical review for GOLD.
Time Frame: 9h
Current Trend: Bullish
Sentiment: Oversold (based on 7-period RSI)
Forecast: Bullish
The market is approaching a significant support area 3,347.97.
The underlined horizontal cluster clearly indicates a highly probable bullish movement with target 3,408.78 level.
P.S
The term oversold refers to a condition where an asset has traded lower in price and has the potential for a price bounce.
Overbought refers to market scenarios where the instrument is traded considerably higher than its fair value. Overvaluation is caused by market sentiments when there is positive news.
Disclosure: I am part of Trade Nation's Influencer program and receive a monthly fee for using their TradingView charts in my analysis.
Like and subscribe and comment my ideas if you enjoy them!
EURUSD BULISH OR BEARISH DETAILED ANALYSISEURUSD has been playing out exactly as forecasted, now trading confidently above the key 1.17 handle. Price action has respected prior structure levels perfectly, with the recent bullish impulse forming clean higher highs and higher lows. After a minor corrective move and successful retest of the previous breakout zone, we’re now seeing continuation momentum build toward the 1.21 target. This pattern is a textbook bullish flag followed by a clean breakout and retest, confirming the strength behind this current upside leg.
Fundamentally, the euro has gained strength due to growing divergence between the ECB and the Fed. With inflation in the Eurozone stabilizing and recent data indicating a modest recovery in manufacturing and services PMI, there's increasing speculation the ECB may hold rates longer, while the Fed is seen leaning toward eventual rate cuts as US labor data softens. The June NFP miss and downward revisions in prior data have weakened the USD’s position, creating a favorable environment for EURUSD bulls.
The technical confluence with macro fundamentals is striking. Risk sentiment is improving across global markets as inflation fears ease and rate clarity emerges. The euro remains supported by strong capital inflows and demand for yield stability. Additionally, EURUSD has cleared multi-month resistance zones with conviction, signaling institutional interest and momentum-based positioning. The recent candle formations suggest buyers are in firm control.
We remain on track for the 1.21 level, which aligns with prior swing highs and a key Fibonacci extension target. Any pullback toward the 1.16–1.1650 region should be viewed as a high-probability buying opportunity. With the DXY under pressure and euro zone resilience improving, EURUSD continues to be one of the top-performing major pairs heading into Q3. Stay patient and ride the wave—this move has more room to run.
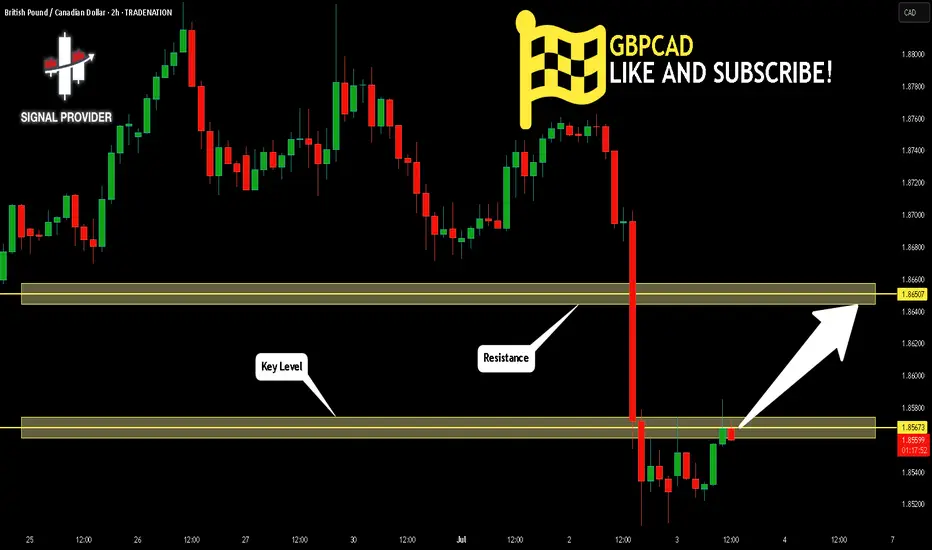
GBPCAD Is Going Up! Long!
Here is our detailed technical review for GBPCAD.
Time Frame: 2h
Current Trend: Bullish
Sentiment: Oversold (based on 7-period RSI)
Forecast: Bullish
The market is trading around a solid horizontal structure 1.856.
The above observations make me that the market will inevitably achieve 1.865 level.
P.S
Please, note that an oversold/overbought condition can last for a long time, and therefore being oversold/overbought doesn't mean a price rally will come soon, or at all.
Disclosure: I am part of Trade Nation's Influencer program and receive a monthly fee for using their TradingView charts in my analysis.
Like and subscribe and comment my ideas if you enjoy them!
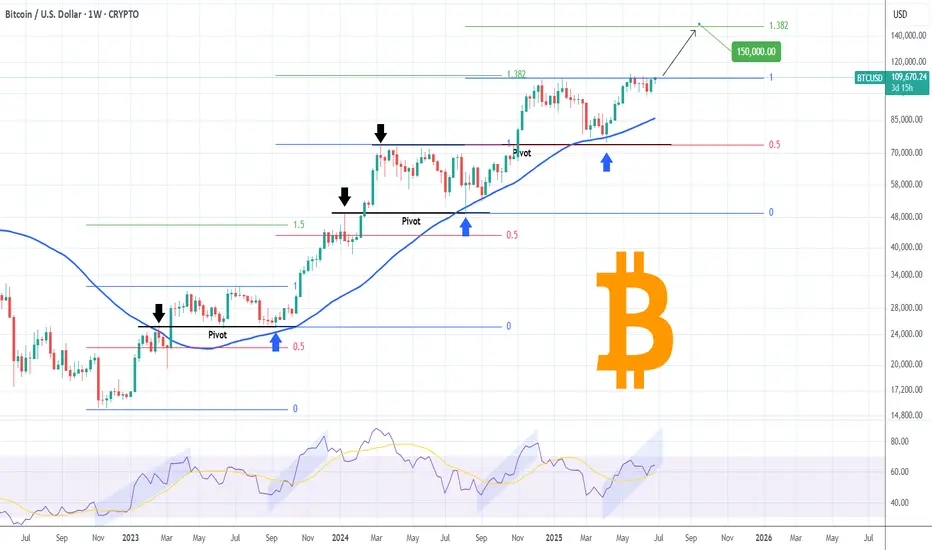
BITCOIN now starts ascent to $150k.Bitcoin (BTCUSD) closed last week with a strong green 1W candle, recovering all loses and has started the current one with a stable rise. As stable as the whole Bull Cycle has been so far since the November 2022 market bottom.
The current uptrend is the technical Bullish Leg that has always emerged the Triple Support Combo of the 1W MA50 (blue trend-line), 0.5 Fibonacci retracement level and former Resistance, turned Support (Pivot).
As you can see, this has happened 2 times already and this is the 3rd. The previous one peaked a little above the 1.382 Fibonacci extension, which gives us an immediate Target on a 2-month horizon at $150000. This confirms a number of previous studies we conducted, all leading towards this price or around it.
So do you think all roads lead to $150k? Feel free to let us know in the comments section below!
-------------------------------------------------------------------------------
** Please LIKE 👍, FOLLOW ✅, SHARE 🙌 and COMMENT ✍ if you enjoy this idea! Also share your ideas and charts in the comments section below! This is best way to keep it relevant, support us, keep the content here free and allow the idea to reach as many people as possible. **
-------------------------------------------------------------------------------
💸💸💸💸💸💸
👇 👇 👇 👇 👇 👇
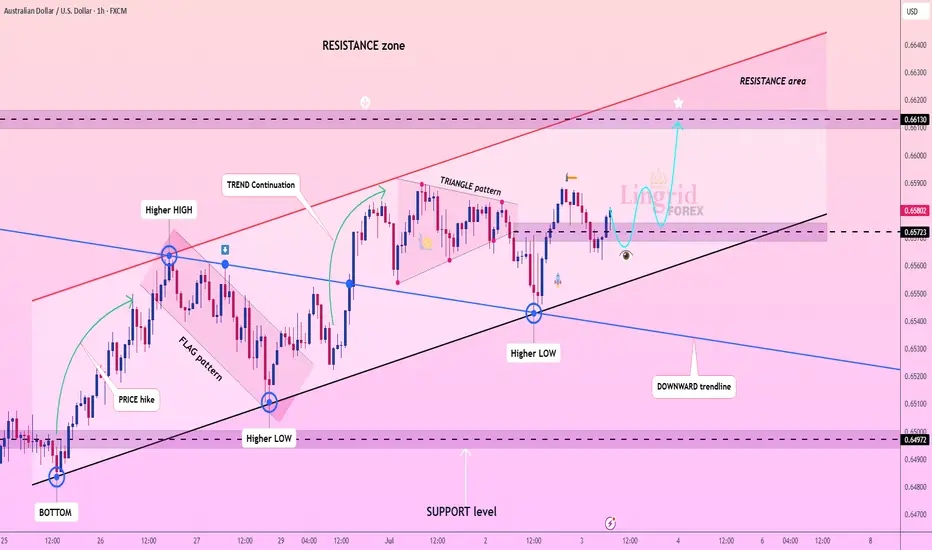
Lingrid | AUDUSD capitalizing on the BULLISH ContinuationOANDA:AUDUSD is forming higher lows above the key ascending trendline, showing clear signs of bullish structure continuation. After breaking out of the flag pattern and triangle, price is now consolidating just above the 0.6572 support zone. If buyers hold this level, a breakout toward the 0.6613 resistance area becomes increasingly likely.
📈 Key Levels
Buy zone: 0.6572–0.6580 (above trendline)
Sell trigger: break below 0.6572 trendline support
Target: 0.6613 resistance area
Buy trigger: bounce from trendline and continuation above minor resistance
💡 Risks
Failure to hold the ascending trendline may trigger deeper correction
Low volume during breakout attempts could invalidate the move
Strong resistance at 0.6613 may cause short-term rejection
If this idea resonates with you or you have your own opinion, traders, hit the comments. I’m excited to read your thoughts!
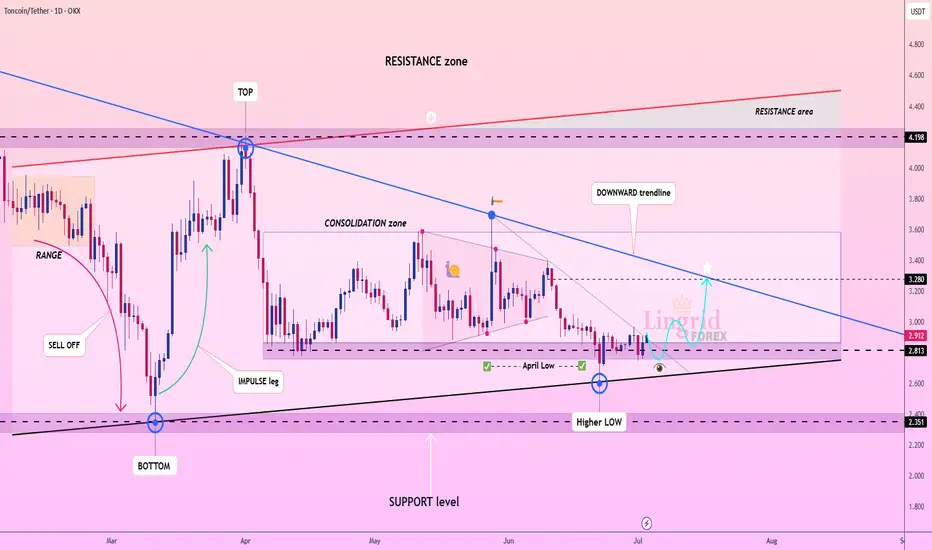
Lingrid | TONUSDT Market Bottom Established at Demand ZoneOKX:TONUSDT is rebounding from the April low near the 2.81 zone after holding a higher low structure above key support. Price remains compressed within a long-term consolidation, but the higher lows and recent bounce signal potential for a breakout attempt. A move toward the 3.28 level would test the major downward trendline and open the path toward the upper resistance range.
📈 Key Levels
Buy zone: 2.81–2.90 (above April low)
Sell trigger: rejection at 3.28 trendline resistance
Target: 3.28 breakout zone
Buy trigger: daily close above 3.28 confirms bullish reversal
💡 Risks
Repeated failure to break the trendline may reintroduce downside pressure
Momentum could stall without volume confirmation
Strong resistance between 3.28–3.40 may limit breakout attempts
If this idea resonates with you or you have your own opinion, traders, hit the comments. I’m excited to read your thoughts!
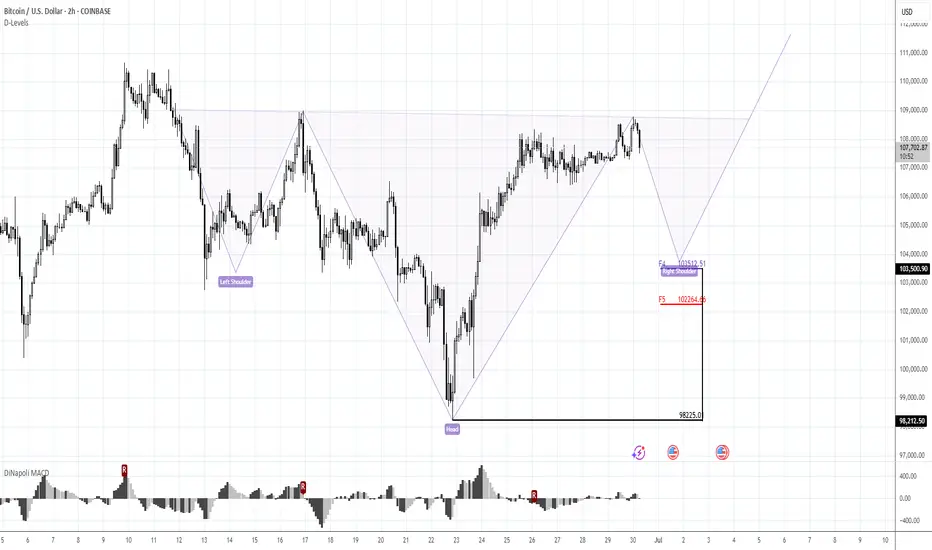
Wait for something more reliableMorning folks,
Since our last update action was anemic. Nothing has changed seriously. BTC was able to show just minor upside action. Based on current performance, I do not want to take long position right here and prefer to wait for something more reliable. Because BTC action stands rather different from the one that we expected to see.
For example it might be H&S pattern on 1H chart. Thus, an area around 103K seems the one that we will keep an eye on.
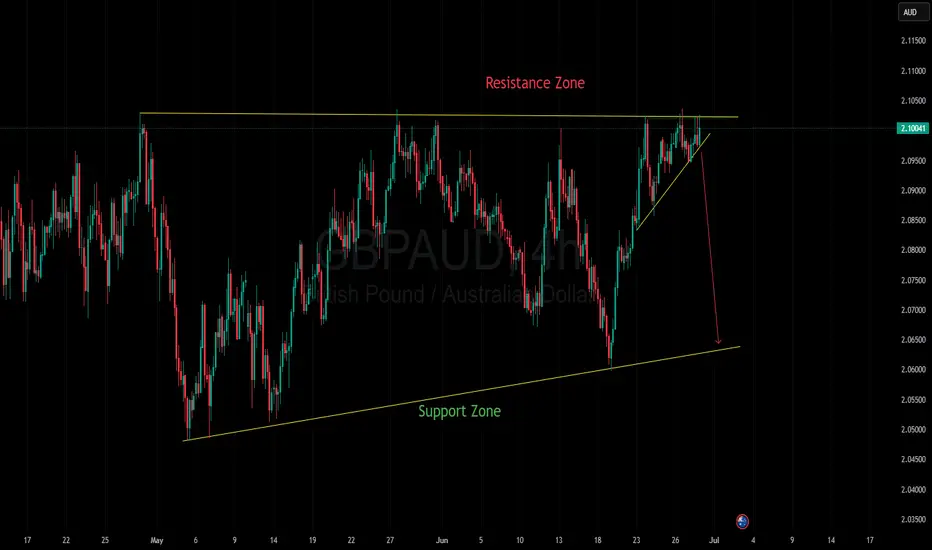
We hit. We failed. Now we drop.OANDA:GBPAUD
Inside this price channel, the market is forming a flag in an attempt to break out.
But given the market cycle and three failed breakout attempts,
I believe it's time for sellers to take control.
📉 I’m siding with the bears on this one!
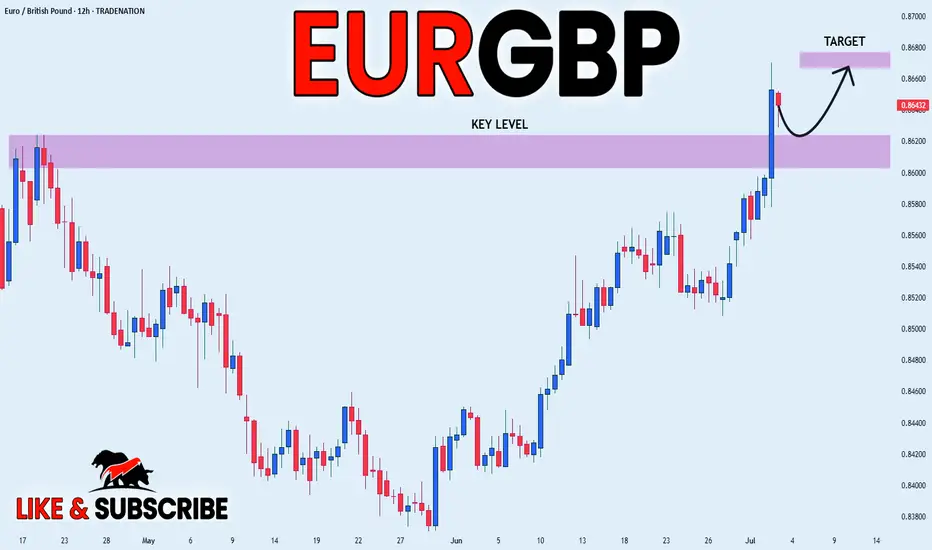
EUR_GBP BULLISH BIAS|LONG|
✅EUR_GBP broke the key
Structure level of 0.8620
While trading in an local uptrend
Which makes me bullish
And I think that after the retest
Of the broken level is complete
A rebound and bullish continuation will follow
LONG🚀
✅Like and subscribe to never miss a new idea!✅
Disclosure: I am part of Trade Nation's Influencer program and receive a monthly fee for using their TradingView charts in my analysis.