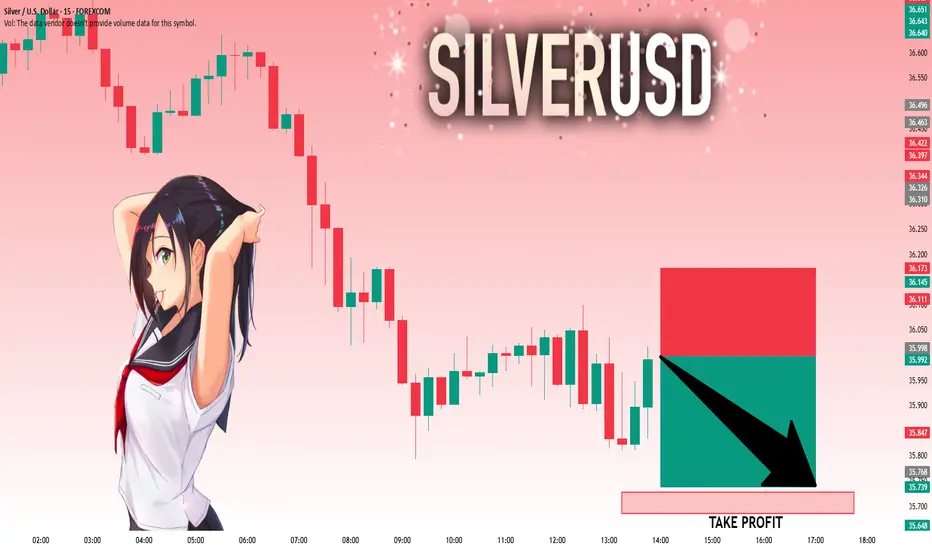
SILVER: The Market Is Looking Down! Short!
My dear friends,
Today we will analyse SILVER together☺️
The market is at an inflection zone and price has now reached an area around 35.998 where previous reversals or breakouts have occurred.And a price reaction that we are seeing on multiple timeframes here could signal the next move down so we can enter on confirmation, and target the next key level of 35.727..Stop-loss is recommended beyond the inflection zone.
❤️Sending you lots of Love and Hugs❤️
Signals
GOLD recovers, capped by $3,350, trend viewOANDA:XAUUSD recovered then weakened as it failed to break above $3,350, supported by a weaker dollar and market uncertainty sparked by reports that U.S. President Donald Trump could replace Federal Reserve Chairman Jerome Powell in September or October. The reports raised concerns about the future independence of the Federal Reserve, boosting demand for safe-haven gold.
On Wednesday, Trump called Powell “terrible” and said he was considering three or four candidates to replace him. Meanwhile, the Wall Street Journal reported that Trump was even considering announcing a potential successor as early as September or October.
The current market narrative is that once Trump nominates a new Fed chair, market expectations will tend to favor a more “dovish” Fed. This could lead to a weaker US dollar, higher long-term US Treasury yields and higher stock prices.
Forexlive points out that this story may be more an emotional reaction than a result of objective and rational thinking. The policy of the FOMC (Federal Open Market Committee) is decided not only by the Fed Chairman but also by a majority vote of the 12 voting members (including 7 directors and 5 regional Fed presidents). The Fed Chairman does have a lot of influence, but he does not have absolute control over monetary policy. The Fed was originally designed to be independent of political pressure.
Moreover, even if Trump nominates the next chairman, there is no guarantee that this will automatically lead to a rate cut. In fact, Powell was also nominated by Trump, but his monetary policy decisions are still based on professional judgment rather than serving Trump's wishes.
So, in the worst case, the market could face policy uncertainty as differences between FOMC members increase and more disagreements emerge. Currently, there are fewer moderate members on the committee, while neutral or hawkish members dominate.
Markets are now focused on personal consumption expenditure (PCE) data due later today (Friday) for further clues on whether the Federal Reserve will cut interest rates.
On the geopolitical front, a ceasefire between Israel and Iran appeared to be in place on Wednesday after Trump hailed a swift end to the 12-day conflict at the NATO summit and said he would seek a commitment from Iran to abandon its nuclear ambitions in talks next week.
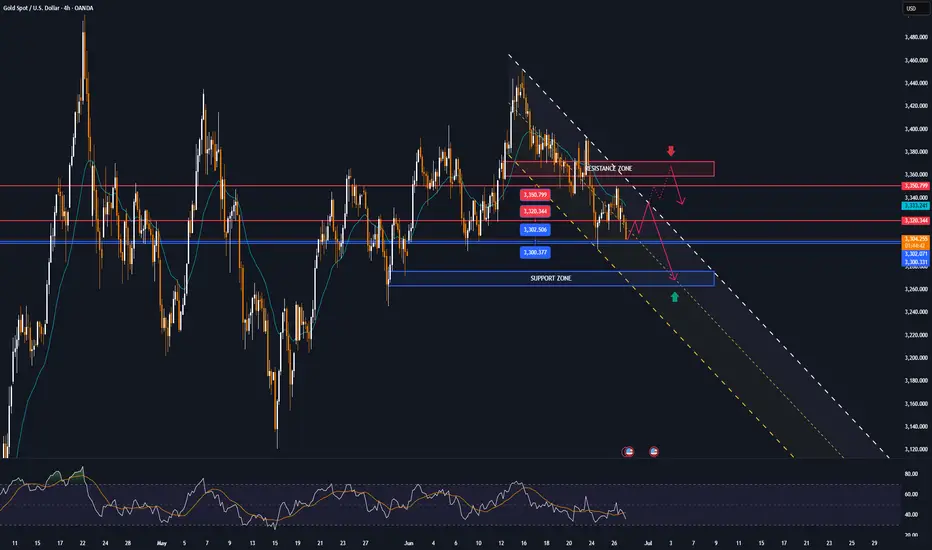
Technical Outlook Analysis OANDA:XAUUSD
On the daily chart, after gold recovered and reached the initial target at 3,350 USD, the nearest resistance is also the price point of the EMA21 noted for readers in the previous publication.
However, the recovery momentum is currently weakening, specifically at the time of writing, the gold price is falling below 3,320 USD. Gold falling below 3,320 USD provides conditions for a possible decline with the next target around 3,302 - 3,300 USD, which is the area of the 0.382% Fibonacci retracement confluence with the lower edge of the price channel.
In terms of momentum, the RSI is heading down and breaking below 50, which should be considered an initial bearish signal.
Overall, gold does not have a clear long-term trend as the uptrend is still the main trend, while the momentum is showing signs of decline.
But personally, I am still leaning towards the uptrend, and continue to look for positions to buy.
Finally, the notable positions will be listed as follows.
Support: 3,302 – 3,300 USD
Resistance: 3,320 – 3,350 – 3,371 USD
SELL XAUUSD PRICE 3367 - 3365⚡️
↠↠ Stop Loss 3371
→Take Profit 1 3359
↨
→Take Profit 2 3353
BUY XAUUSD PRICE 3272 - 3274⚡️
↠↠ Stop Loss 3268
→Take Profit 1 3280
↨
→Take Profit 2 3286
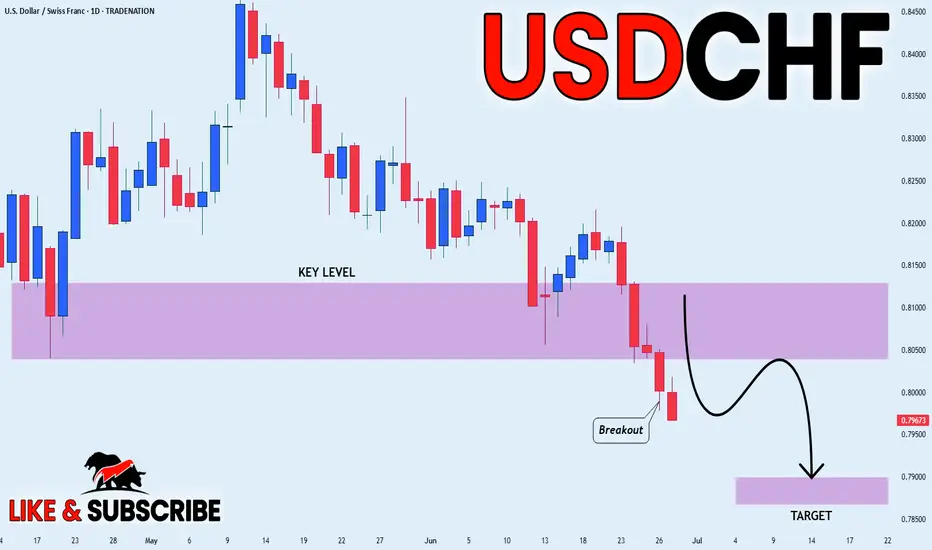
USD_CHF BEARISH BREAKOUT|SHORT|
✅USD_CHF broke the key structure level of 0.8050
While trading in a strong downtrend
Which makes me bearish
And I think that after the retest of the broken level is complete
A bearish continuation will follow
SHORT🔥
✅Like and subscribe to never miss a new idea!✅
Disclosure: I am part of Trade Nation's Influencer program and receive a monthly fee for using their TradingView charts in my analysis.
Gold Fails to Hold the Fear – Ceasefire Triggers 500+ Pip DropIn yesterday’s analysis, I pointed out that despite the weekend escalation in the middle-east, which triggered a gap up in Gold, the price action didn’t confirm the fear narrative. Gold failed to hold its gains – a clear sign of weakness.
📌 What happened next?
Throughout the day, Gold attempted multiple pushes toward 3400 – but each effort was met with strong selling pressure.
Then came the ceasefire announcement… and Gold dropped hard, now trading around 3320, locking in over 500 pips of profit from my short setup.
________________________________________
❓ More importantly, what’s next for Gold?
More important than the short-term noise is what the charts are now telling us:
📉 Weekly chart? Bearish.
🕯️ Daily chart? Also turned bearish after last week’s indecisive price action.
________________________________________
📌 Strategy remains the same:
I continue to sell rallies, and I’m now watching the 3280 support zone for a possible test in the coming hours.
Patience. Discipline. Let the market come to you. 🚀
Disclosure: I am part of TradeNation's Influencer program and receive a monthly fee for using their TradingView charts in my analyses and educational articles.
Trading balanceTrading balance The price of the asset has rebounded from the balance zone. With the prospect of growth into the resistance zone.
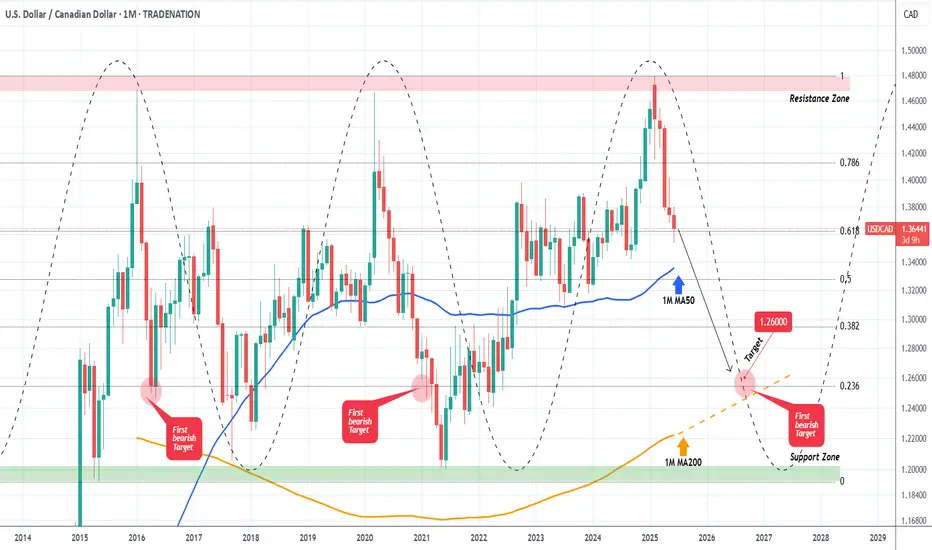
USDCAD Strongest long-term Sell in the market right now.At the beginning of the year (January 15, see chart below), we made an unpopular bearish call at the time, hinting that the USDCAD pair was approaching its Resistance Zone, hence a multi-year Top was in order:
As you can see, the moment the price hit that Resistance Zone, it got instantly rejected and a new Bearish Leg started, which has extended up to this day. This time we view this on the 1M time-frame where the Support levels are more clearly illustrated.
More particularly, the 1M MA50 (blue trend-line) poses as the first one, in fact it has been holding since September 2022. Our Target is still located at 1.26000, which is marginally above the 0236 Fibonacci level, which has been the 1st Target during both previous Bearish Legs. Also it is where the 1M MA200 (orange trend-line) is headed to, and there are high chances of a long-term bounce there.
-------------------------------------------------------------------------------
** Please LIKE 👍, FOLLOW ✅, SHARE 🙌 and COMMENT ✍ if you enjoy this idea! Also share your ideas and charts in the comments section below! This is best way to keep it relevant, support us, keep the content here free and allow the idea to reach as many people as possible. **
-------------------------------------------------------------------------------
Disclosure: I am part of Trade Nation's Influencer program and receive a monthly fee for using their TradingView charts in my analysis.
💸💸💸💸💸💸
👇 👇 👇 👇 👇 👇
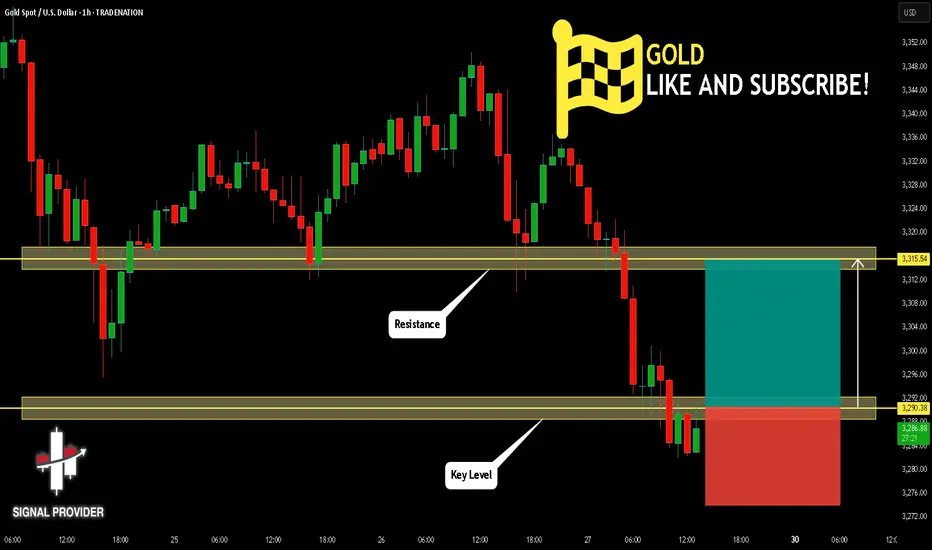
GOLD Will Grow! Long!
Here is our detailed technical review for GOLD.
Time Frame: 1h
Current Trend: Bullish
Sentiment: Oversold (based on 7-period RSI)
Forecast: Bullish
The market is trading around a solid horizontal structure 3,290.38.
The above observations make me that the market will inevitably achieve 3,315.54 level.
P.S
We determine oversold/overbought condition with RSI indicator.
When it drops below 30 - the market is considered to be oversold.
When it bounces above 70 - the market is considered to be overbought.
Disclosure: I am part of Trade Nation's Influencer program and receive a monthly fee for using their TradingView charts in my analysis.
Like and subscribe and comment my ideas if you enjoy them!
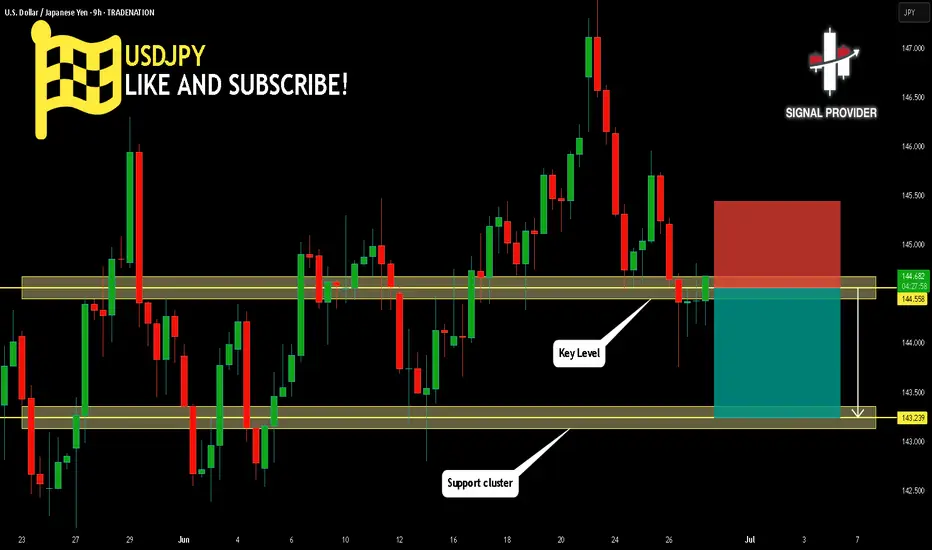
USDJPY Will Go Lower From Resistance! Sell!
Take a look at our analysis for USDJPY.
Time Frame: 9h
Current Trend: Bearish
Sentiment: Overbought (based on 7-period RSI)
Forecast: Bearish
The market is testing a major horizontal structure 144.558.
Taking into consideration the structure & trend analysis, I believe that the market will reach 143.239 level soon.
P.S
Overbought describes a period of time where there has been a significant and consistent upward move in price over a period of time without much pullback.
Disclosure: I am part of Trade Nation's Influencer program and receive a monthly fee for using their TradingView charts in my analysis.
Like and subscribe and comment my ideas if you enjoy them!
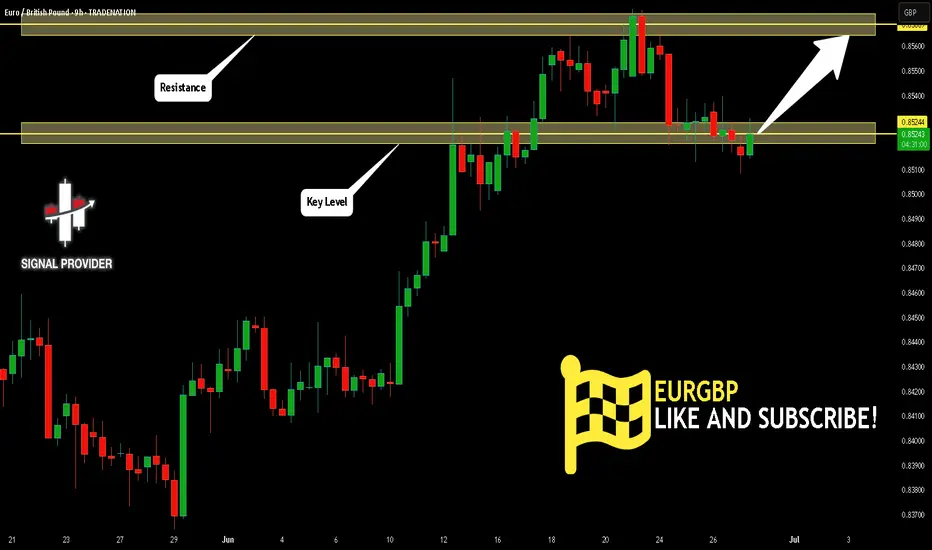
EURGBP Will Go Higher! Long!
Here is our detailed technical review for EURGBP.
Time Frame: 9h
Current Trend: Bullish
Sentiment: Oversold (based on 7-period RSI)
Forecast: Bullish
The market is approaching a significant support area 0.852.
The underlined horizontal cluster clearly indicates a highly probable bullish movement with target 0.856 level.
P.S
The term oversold refers to a condition where an asset has traded lower in price and has the potential for a price bounce.
Overbought refers to market scenarios where the instrument is traded considerably higher than its fair value. Overvaluation is caused by market sentiments when there is positive news.
Disclosure: I am part of Trade Nation's Influencer program and receive a monthly fee for using their TradingView charts in my analysis.
Like and subscribe and comment my ideas if you enjoy them!
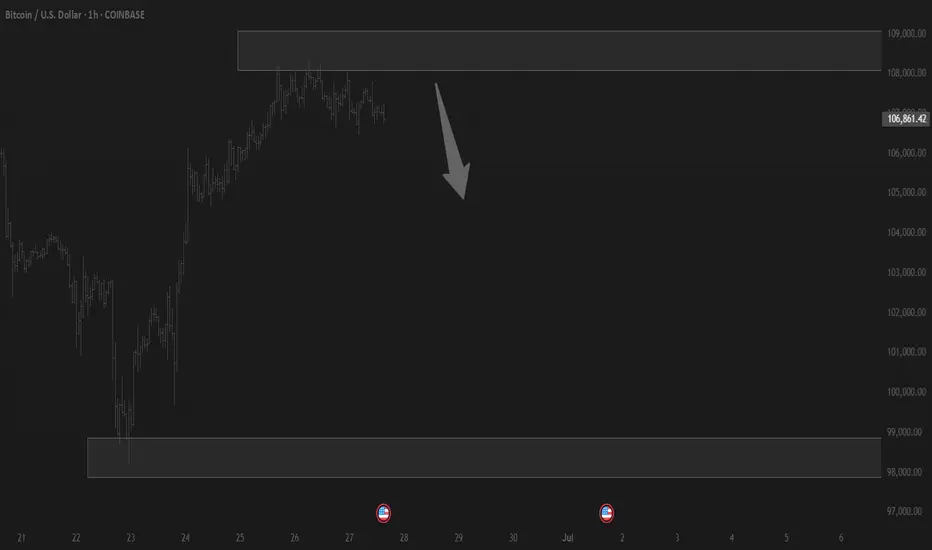
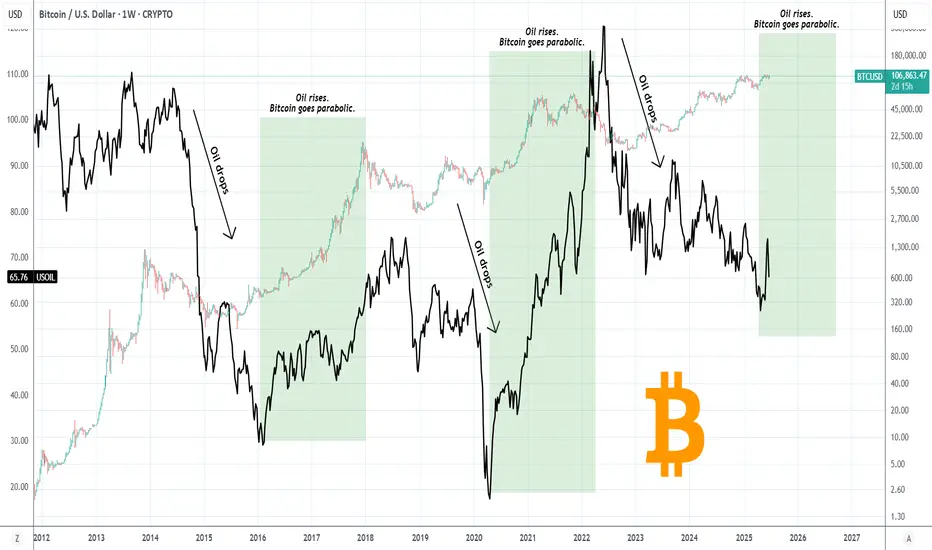
BITCOIN Just wait until OIL turns bullish!Bitcoin (BTCUSD) has a unique long-term relationship/ correlation with WTI Oil (USOIL) and this charts shows why.
In the past 11 years, when Oil started to decline sharply, Bitcoin formed a market bottom before Oil did. When Oil started to rise again, Bitcoin was out of its bottom and has initiated its Parabolic Rally stage (green Rectangle). Then Oil peaked after BTC has already priced its own Cycle Top.
Based on this correlation, we can assume that we haven't yet seen BTC's Parabolic stage as Oil hasn't yet started to rise. If we assume that the late April Low on Oil was its market bottom, then only now it has started its rise, so at best BTC has just started the Cycle's Parabolic Rally. If that turns out o be true, then the upside potential is huge for BTC. Needless to say other key macroeconomic factors have to assist e.g. higher adoption, ETF inflows, FED Rate Cut, but that's what the current chart says!
So do you think that Oil can be the driver behind a new Bitcoin parabolic rally? Feel free to let us know in the comments section below!
-------------------------------------------------------------------------------
** Please LIKE 👍, FOLLOW , SHARE and COMMENT if you enjoy this idea! Also share your ideas and charts in the comments section below! This is best way to keep it relevant, support us, keep the content here free and allow the idea to reach as many people as possible. **
-------------------------------------------------------------------------------
💸💸💸💸💸💸
👇 👇 👇 👇 👇 👇
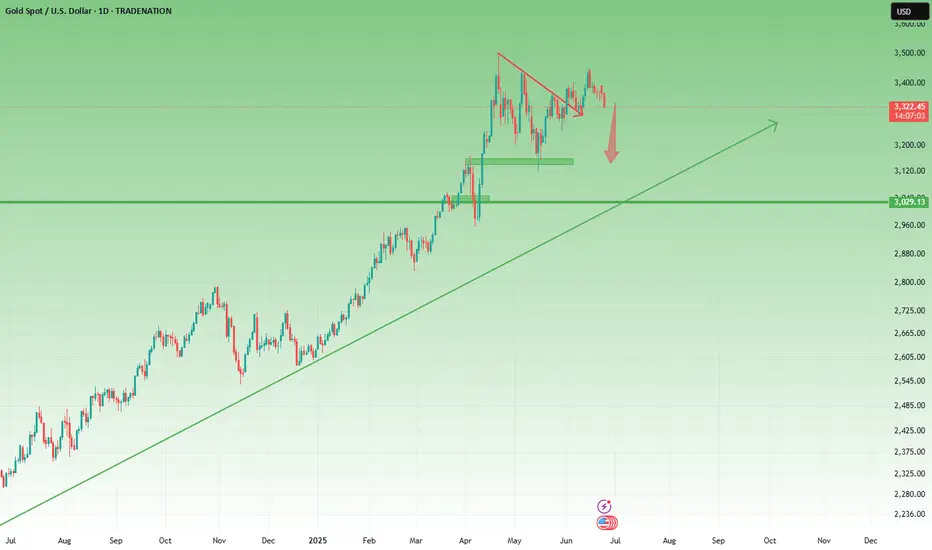
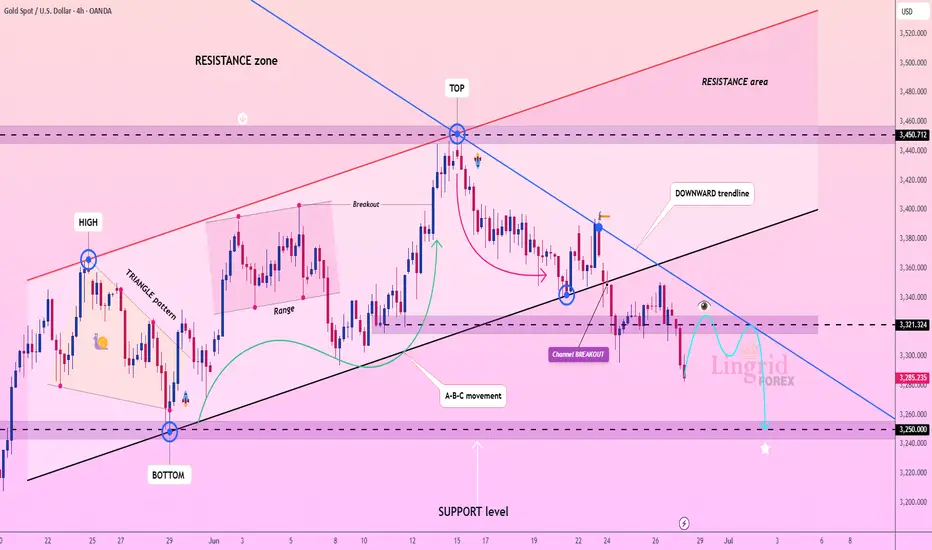
Lingrid | GOLD Bear Channel Break: Short OpportunityOANDA:XAUUSD has broken down from the upward channel and is now trading below the key 3,321 level, which previously served as support. The price is forming a bearish structure beneath the black and blue trendlines, with 3,250 emerging as the next potential target. A minor relief bounce could retest 3,320, but rejection here would reinforce downside continuation.
📈 Key Levels
Sell zone: 3,315–3,330
Sell trigger: rejection below 3,321
Target: 3,250
Sell confirmation: breakdown from 3,285 with momentum
💡 Risks
False breakout above 3,321 could trap sellers
Weak bearish momentum may result in sideways chop
Re-entry into channel could negate bearish outlook
If this idea resonates with you or you have your own opinion, traders, hit the comments. I’m excited to read your thoughts!
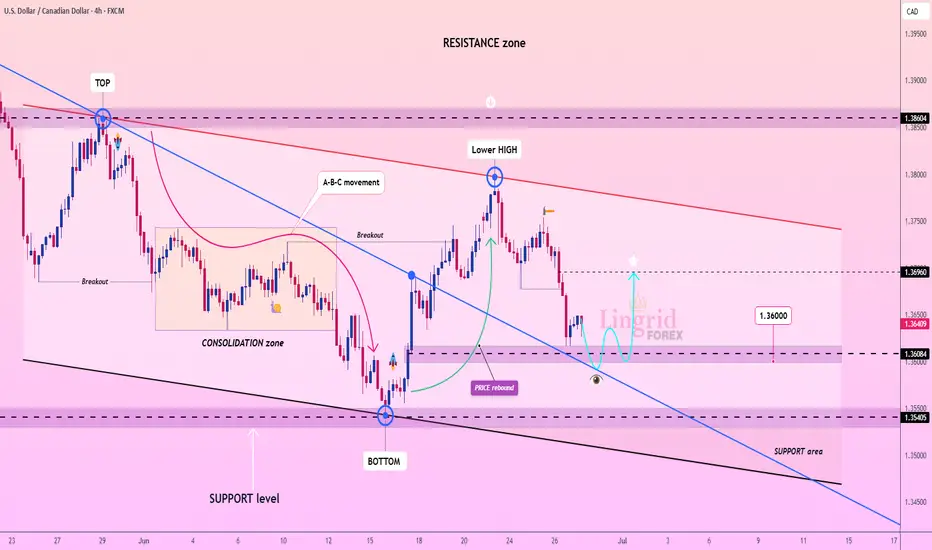
Lingrid | USDCAD Support Level Bounce OpportunityThe price perfectly fulfilled my last idea . FX:USDCAD is attempting to stabilize after a sharp drop from the 1.3696 resistance area, approaching the lower boundary of the falling wedge pattern. The price is testing the 1.3600–1.3550 support band, aligned with the blue descending trendline and historical pivot zones. A bullish rebound here could push the pair back toward 1.3696, while failure to hold exposes 1.3500 and lower.
📈 Key Levels
Buy zone: 1.3550–1.3600
Sell trigger: breakdown below 1.3550
Target: 1.3696
Buy trigger: breakout and retest of 1.3625–1.3650 zone
💡 Risks
Bearish momentum continuation toward 1.3500 if bounce fails
Weak volume recovery may trap buyers near 1.3620
Rejection near descending red trendline can maintain bearish pressure
If this idea resonates with you or you have your own opinion, traders, hit the comments. I’m excited to read your thoughts!
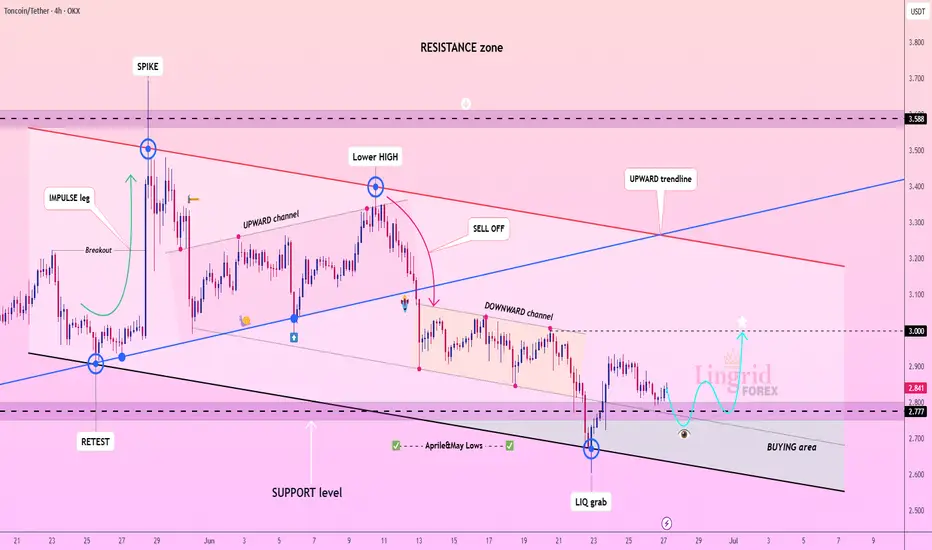
Lingrid | TONUSDT April-May Low Fake BreakoutOKX:TONUSDT is recovering after a liquidity grab near the April–May lows, bouncing from the lower boundary of the descending channel. The current move is stabilizing inside the BUYING area, suggesting accumulation and possible breakout preparation. If the 2.77 support holds, price may rally toward the 3.00 psychological barrier. A deeper dip below 2.77 would negate the bullish setup and reintroduce downside risks.
📈 Key Levels
Buy zone: 2.75–2.80
Sell trigger: sustained close below 2.75
Target: 3.00
Buy trigger: breakout above 2.90 with volume
💡 Risks
Low demand at the base could stall recovery
Failure to break out of the downward channel weakens upside case
Price rejection near 2.90 may trap early buyers
If this idea resonates with you or you have your own opinion, traders, hit the comments. I’m excited to read your thoughts!
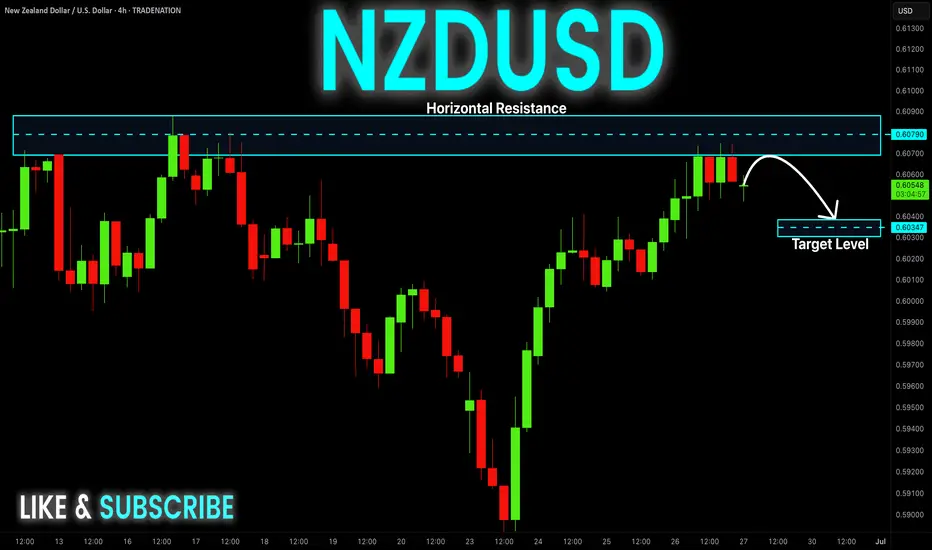
NZD-USD Will Fall! Sell!
Hello,Traders!
NZD-USD made a retest
Of the horizontal resistance
Level of 0.6087 and as it
Is a strong key structure
We will be expecting
A local move down
Sell!
Comment and subscribe to help us grow!
Check out other forecasts below too!
Disclosure: I am part of Trade Nation's Influencer program and receive a monthly fee for using their TradingView charts in my analysis.
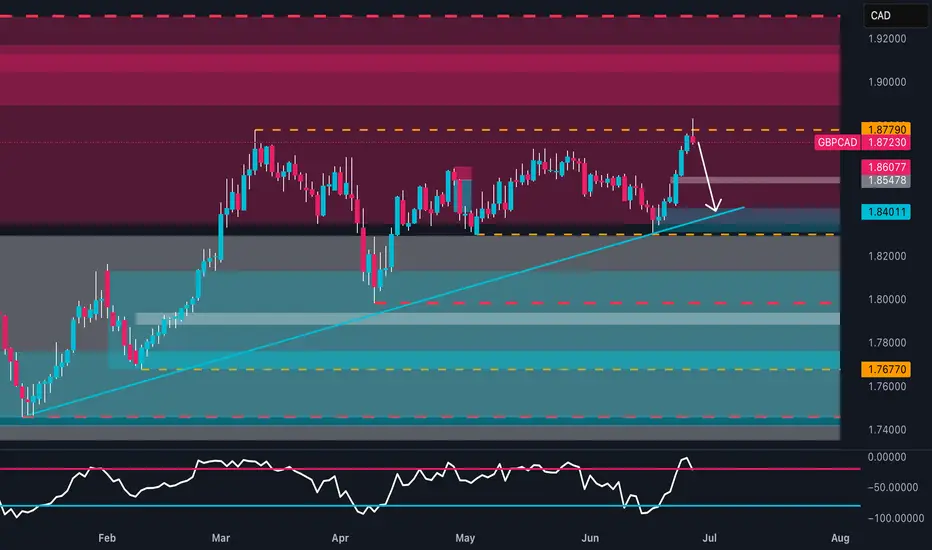
85% of Traders Are Wrong on GBPCAD - I'm Going Short!📊 COT Analysis
GBP:
Non-Commercials remain net long with 106,282 longs vs 63,425 shorts. However, long positions are decreasing (-4,794) while shorts are slightly increasing (+3,983), suggesting profit-taking or a potential shift in sentiment.
Commercials are strongly net short (35,707 longs vs 87,770 shorts), with a significant reduction in both longs (-24,958) and shorts (-33,457) — a clear reduction in overall exposure.
→ Non-Commercial positioning is still bullish, but momentum is fading.
CAD:
Non-Commercials remain heavily net short (28,154 longs vs 94,487 shorts), but notable changes are taking place: sharp increase in longs (+8,503) and a significant cut in shorts (-18,307), pointing to a possible reversal in sentiment.
Commercials are net long with a rise in both longs (+1,834) and shorts (+31,186), indicating potential hedging as expectations shift.
→ CAD strength is emerging in the COT data, supporting a potential bearish move on GBPCAD.
📈 Seasonality – June/July
GBP tends to perform poorly in June across all historical averages (-0.004 / -0.006). July shows slight positivity but is statistically insignificant.
CAD has a mildly negative June, but July is historically its strongest month (+0.006 / +0.007 on 20Y and 15Y averages).
→ Seasonal bias favors CAD strength in the June–July transition.
🧠 Retail Sentiment
Retail traders are 85% long on GBPCAD, a strong contrarian signal.
→ Such imbalance increases the odds of a correction or reversal to the downside.
→ Confirms short bias.
📉 Price Action & RSI
Price surged into strong resistance at 1.8779 (triple top area).
Current daily rejection + RSI in overbought territory suggest a potential swing high forming.
Natural downside target: 1.8400–1.8450 (prior structure and base of the move).
→ Ideal short setup from resistance with confirmation via bearish price action.
#ETH Rebounds on Ceasefire News – Eyes Set on $3100 and Beyond!By analyzing the #Ethereum chart on the weekly (logarithmic) timeframe, we can see that after dropping to $2100, ETH started recovering strongly following the ceasefire announcement, and is currently trading around $2430. If Ethereum manages to close above $2700 by the end of the week, we could expect further upside.
The next potential bullish targets are $2890, $3100, and $4100.
Please support me with your likes and comments to motivate me to share more analysis with you and share your opinion about the possible trend of this chart with me !
Best Regards , Arman Shaban

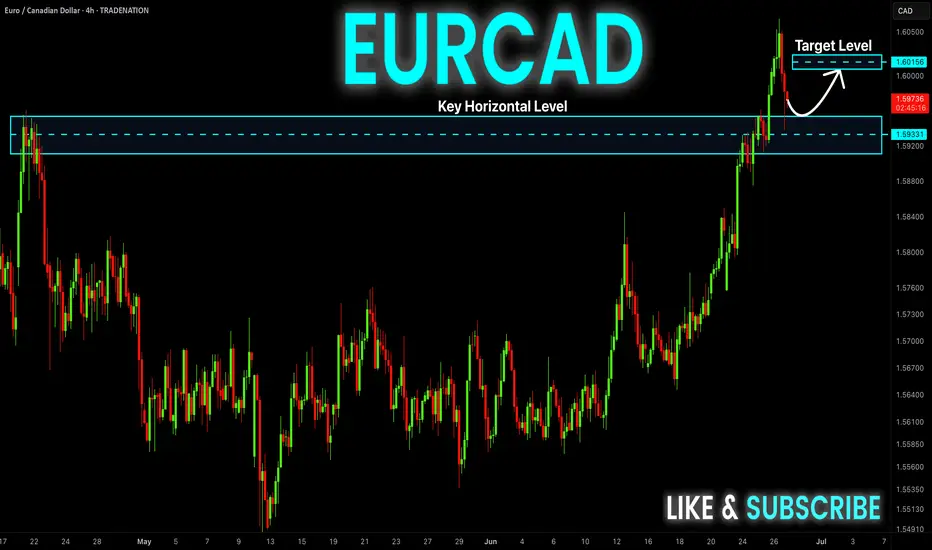
EUR-CAD Local Long! Buy!
Hello,Traders!
EUR-CAD is trading in an
Uptrend and the pair is
About to retest a horizontal
Support of 1.5933 and as
We are locally bullish biased
We will be expecting a
Local bullish rebound
Buy!
Comment and subscribe to help us grow!
Check out other forecasts below too!
Disclosure: I am part of Trade Nation's Influencer program and receive a monthly fee for using their TradingView charts in my analysis.
US100 BULLISH BREAKOUT|LONG|
✅US100 is going up
Now and the index made a bullish
Breakout of the key horizontal
Level of 22,222 and the breakout
Is confirmed so we are bullish
Biased and we will be expecting
A further bullish move up
LONG🚀
✅Like and subscribe to never miss a new idea!✅
Disclosure: I am part of Trade Nation's Influencer program and receive a monthly fee for using their TradingView charts in my analysis.

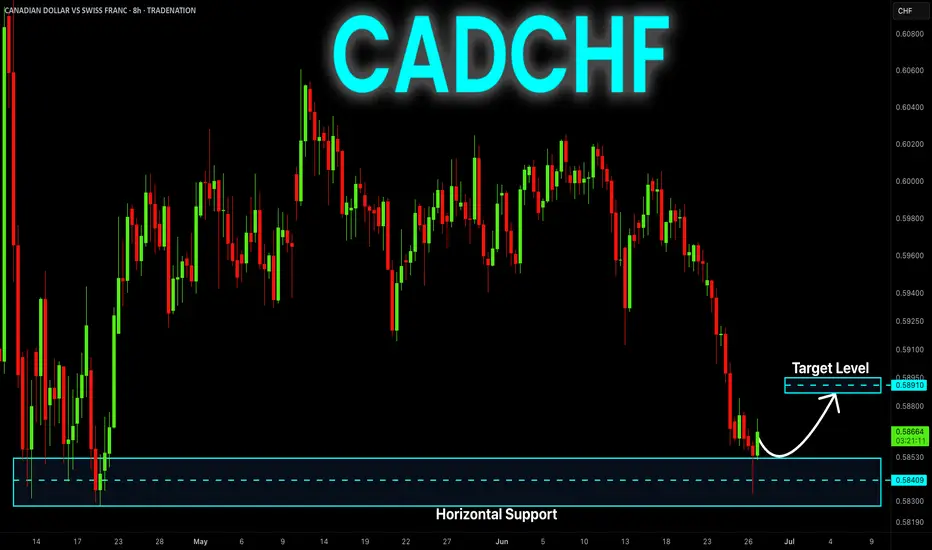
CAD-CHF Bullish Rebound Ahead! Buy!
Hello,Traders!
CAD-CHF fell down sharply
And the pair was oversold
So we are not surprised to
See a bullish rebound from
The strong horizontal support
Around 0.5830 level and we
Think that we are likely
To see a further bullish move up
Buy!
Comment and subscribe to help us grow!
Check out other forecasts below too!
Disclosure: I am part of Trade Nation's Influencer program and receive a monthly fee for using their TradingView charts in my analysis.
Trading balanceTrading balance The price of the asset has rebounded from the balance zone. With the prospect of growth into the resistance zone.
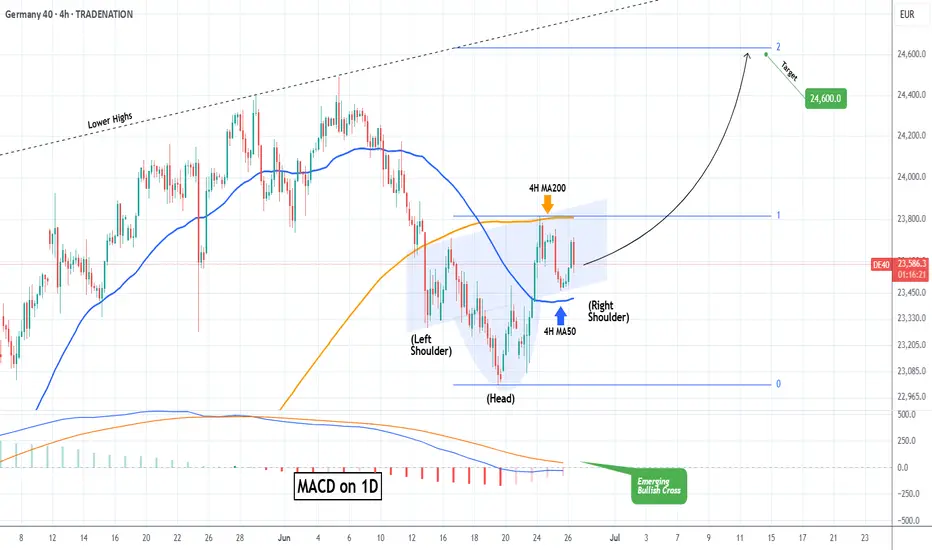
DAX Inverse Head and Shoulders target 24600!DAX (DE40) is about to complete an Inverse Head and Shoulders (IH&S) pattern, with the price currently stuck in range within the 4H MA50 (blue trend-line) and the 4H MA200 (orange trend-line).
A 4H candle closing above the 4H MA200, confirms the IH&S pattern and the bullish break-out technically targets the 2.0 Fibonacci extension, currently a little above 24600. On top of that, the break-out may be accompanied by a 1D MAD Bullish Cross, further confirmation of the bullish sentiment.
-------------------------------------------------------------------------------
** Please LIKE 👍, FOLLOW ✅, SHARE 🙌 and COMMENT ✍ if you enjoy this idea! Also share your ideas and charts in the comments section below! This is best way to keep it relevant, support us, keep the content here free and allow the idea to reach as many people as possible. **
-------------------------------------------------------------------------------
Disclosure: I am part of Trade Nation's Influencer program and receive a monthly fee for using their TradingView charts in my analysis.
💸💸💸💸💸💸
👇 👇 👇 👇 👇 👇
DXY Short-term rebound quite likely.The U.S. Dollar index (DXY) has been trading within almost a 3-year Channel Down, which has assisted us in choosing the right levels to sell high and buy low.
Despite being now on its 2nd major Bearish Leg, we see a short-term bounce possibly up to August quite likely based on the previous major Bearish Leg. As you see, the current setup resembles the April 13 023 Low after which the price rebounded short-term just above the 0.786 Fibonacci level, only to get rejected later and complete the bottom on the 1.1 Fib extension.
Even the 1W RSI sequences between the two fractals are identical. Therefore, before diving below 96.000, we believe a 100.000 test is quite likely.
-------------------------------------------------------------------------------
** Please LIKE 👍, FOLLOW ✅, SHARE 🙌 and COMMENT ✍ if you enjoy this idea! Also share your ideas and charts in the comments section below! This is best way to keep it relevant, support us, keep the content here free and allow the idea to reach as many people as possible. **
-------------------------------------------------------------------------------
💸💸💸💸💸💸
👇 👇 👇 👇 👇 👇
