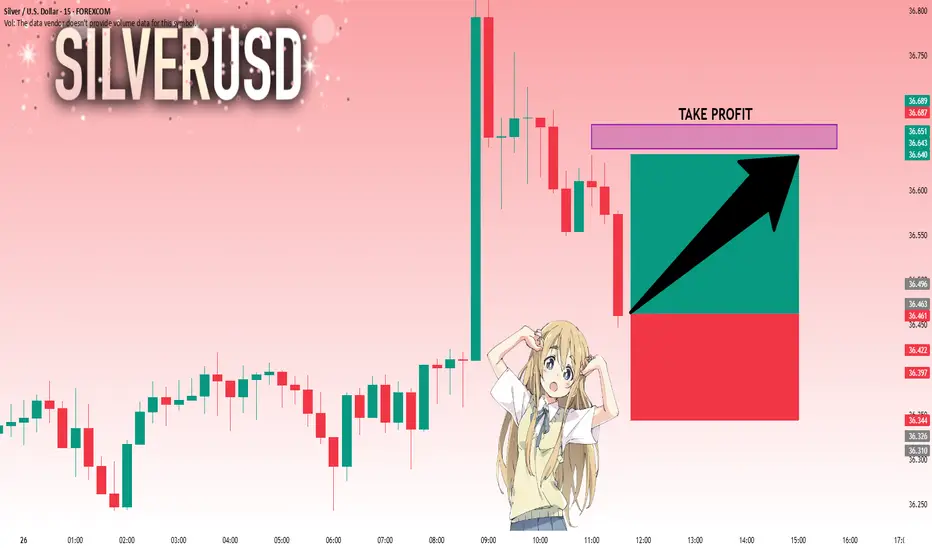
SILVER: Bulls Are Winning! Long!
My dear friends,
Today we will analyse SILVER together☺️
The recent price action suggests a shift in mid-term momentum. A break above the current local range around 36.463 will confirm the new direction upwards with the target being the next key level of 36.640 and a reconvened placement of a stop-loss beyond the range.
❤️Sending you lots of Love and Hugs❤️
Signals
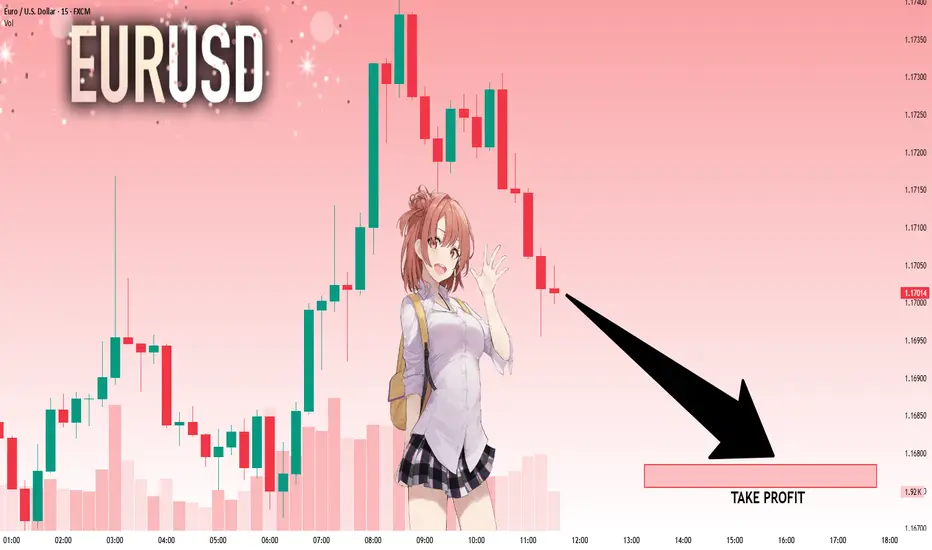
EURUSD: Next Move Is Down! Short!
My dear friends,
Today we will analyse EURUSD together☺️
The in-trend continuation seems likely as the current long-term trend appears to be strong, and price is holding below a key level of 1.17021 So a bearish continuation seems plausible, targeting the next low. We should enter on confirmation, and place a stop-loss beyond the recent swing level.
❤️Sending you lots of Love and Hugs❤️
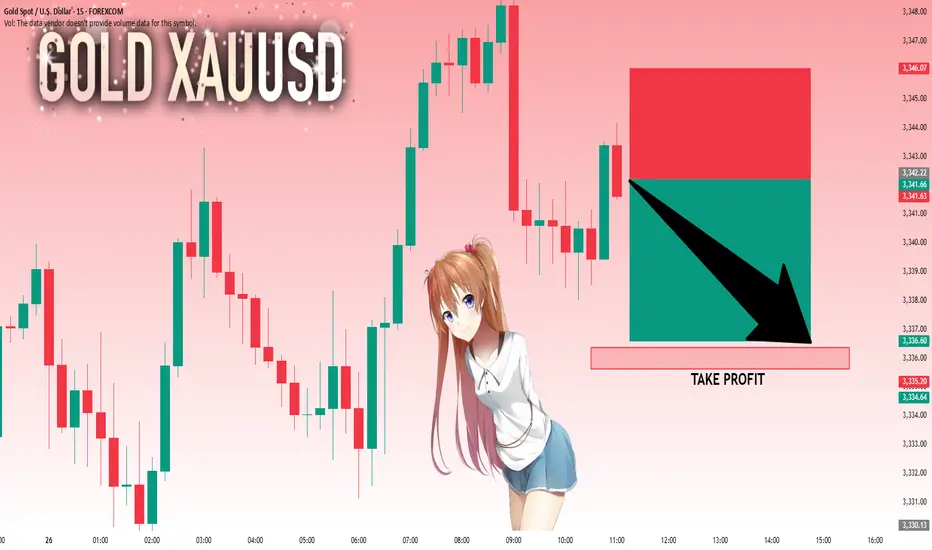
GOLD: Target Is Down! Short!
My dear friends,
Today we will analyse GOLD together☺️
The market is at an inflection zone and price has now reached an area around 3,342.22 where previous reversals or breakouts have occurred.And a price reaction that we are seeing on multiple timeframes here could signal the next move down so we can enter on confirmation, and target the next key level of 3,336.36..Stop-loss is recommended beyond the inflection zone.
❤️Sending you lots of Love and Hugs❤️
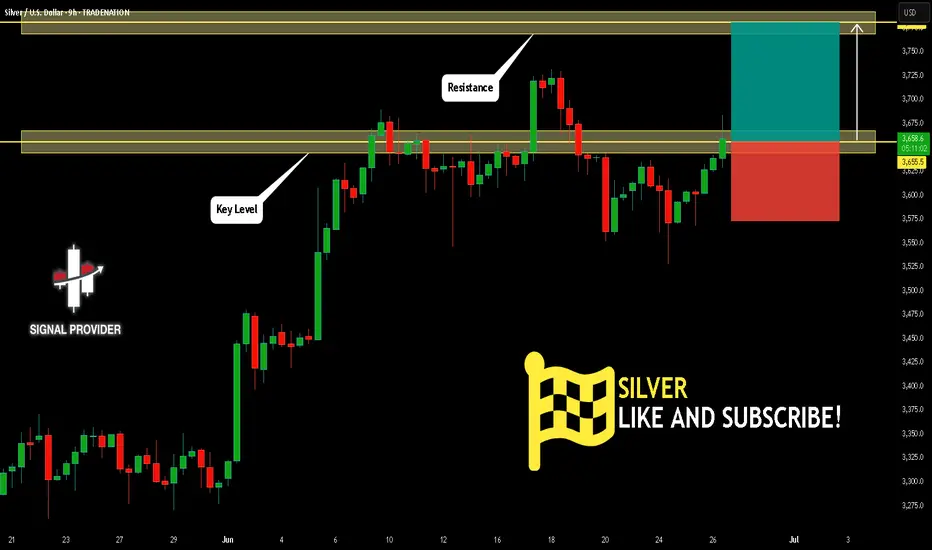
SILVER Will Go Up! Buy!
Take a look at our analysis for SILVER.
Time Frame: 9h
Current Trend: Bullish
Sentiment: Oversold (based on 7-period RSI)
Forecast: Bullish
The market is on a crucial zone of demand 3,655.5.
The oversold market condition in a combination with key structure gives us a relatively strong bullish signal with goal 3,780.6 level.
P.S
We determine oversold/overbought condition with RSI indicator.
When it drops below 30 - the market is considered to be oversold.
When it bounces above 70 - the market is considered to be overbought.
Disclosure: I am part of Trade Nation's Influencer program and receive a monthly fee for using their TradingView charts in my analysis.
Like and subscribe and comment my ideas if you enjoy them!
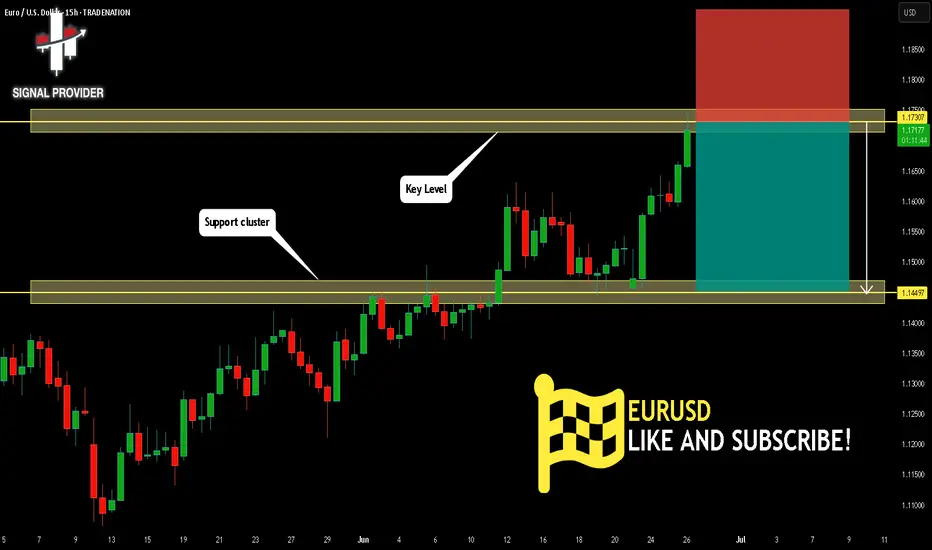
EURUSD Will Move Lower! Short!
Please, check our technical outlook for EURUSD.
Time Frame: 15h
Current Trend: Bearish
Sentiment: Overbought (based on 7-period RSI)
Forecast: Bearish
The price is testing a key resistance 1.173.
Taking into consideration the current market trend & overbought RSI, chances will be high to see a bearish movement to the downside at least to 1.144 level.
P.S
Overbought describes a period of time where there has been a significant and consistent upward move in price over a period of time without much pullback.
Disclosure: I am part of Trade Nation's Influencer program and receive a monthly fee for using their TradingView charts in my analysis.
Like and subscribe and comment my ideas if you enjoy them!
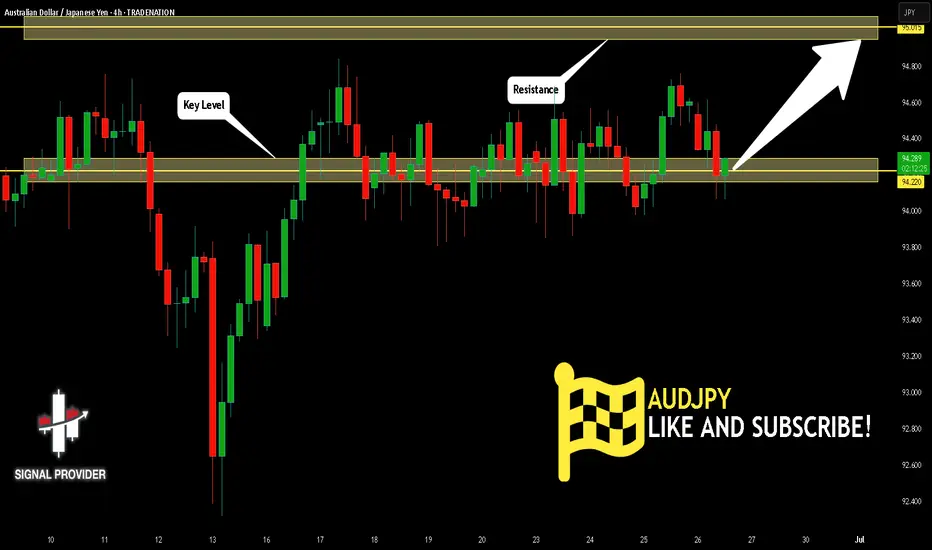
AUDJPY Is Bullish! Long!
Here is our detailed technical review for AUDJPY.
Time Frame: 4h
Current Trend: Bullish
Sentiment: Oversold (based on 7-period RSI)
Forecast: Bullish
The market is trading around a solid horizontal structure 94.220.
The above observations make me that the market will inevitably achieve 95.015 level.
P.S
Please, note that an oversold/overbought condition can last for a long time, and therefore being oversold/overbought doesn't mean a price rally will come soon, or at all.
Disclosure: I am part of Trade Nation's Influencer program and receive a monthly fee for using their TradingView charts in my analysis.
Like and subscribe and comment my ideas if you enjoy them!
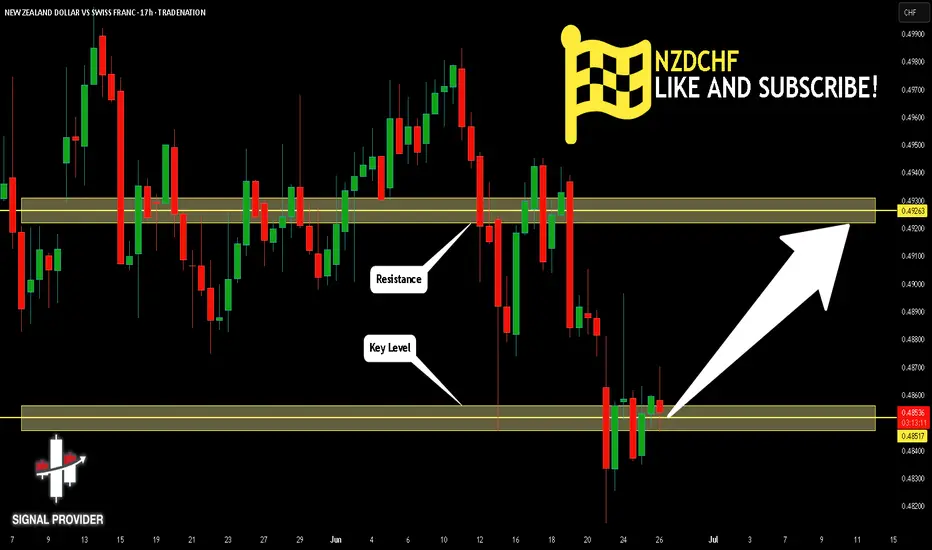
NZDCHF Is Very Bullish! Buy!
Take a look at our analysis for NZDCF
Time Frame: 17h
Current Trend: Bullish
Sentiment: Oversold (based on 7-period RSI)
Forecast: Bullish
The market is testing a major horizontal structure 0.485.
Taking into consideration the structure & trend analysis, I believe that the market will reach 0.492 level soon.
P.S
The term oversold refers to a condition where an asset has traded lower in price and has the potential for a price bounce.
Overbought refers to market scenarios where the instrument is traded considerably higher than its fair value. Overvaluation is caused by market sentiments when there is positive news.
Disclosure: I am part of Trade Nation's Influencer program and receive a monthly fee for using their TradingView charts in my analysis.
Like and subscribe and comment my ideas if you enjoy them!
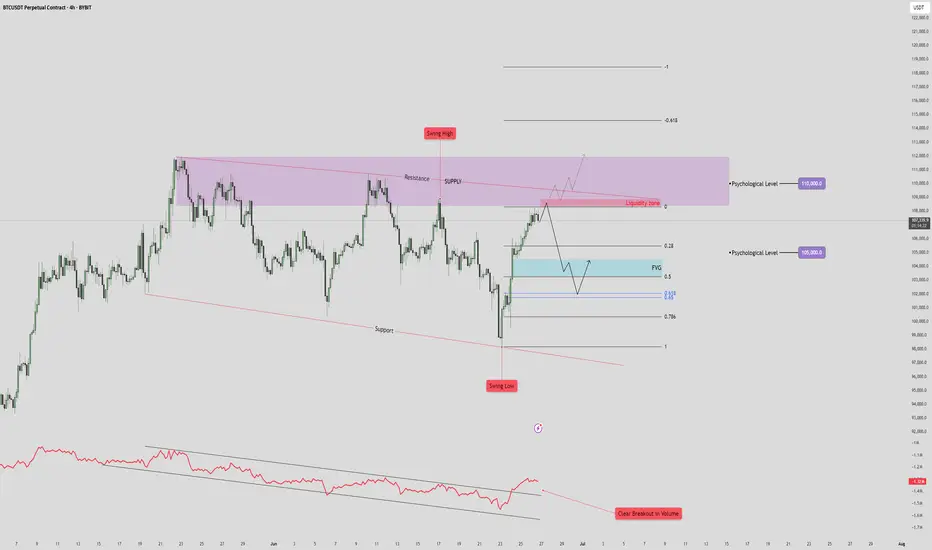
BTC/USDT Drop to 101k?🧠 High Time Frame Context
Trend: Consolidation within a broad range (support and resistance clearly defined).
Key Psychological Levels:
105,000 USDT – minor level, acting as a magnet in short-term PA.
110,000 USDT – major supply confluence and liquidity target.
🟪 Supply & Resistance Zone
Zone: Marked in purple (108.5k-112k).
Key Observation:
Swing high formed inside this zone, indicating liquidity trap.
Potential fake-out or strong rejection from this area.
Strong confluence with a descending resistance trendline, adding to the selling pressure.
🔵 Fair Value Gap (FVG) & Retracement Targets
FVG identified just below the current price (~103.5k-104.5k).
Price is projected to:
Reject from the current high.
Drop to fill the FVG zone.
Possibly bounce between FVG and Fibonacci retracement levels:
0.5
0.618
0.786
🔴 Volume & RSI Divergence
Volume breakout is noted on the last push down (bottom red annotation), followed by a retrace.
OBV shows bullish divergence with price:
🔻 Support Structure
Lower red trendline is a key long-term support.
Previous swing low aligns with this trendline – buyers showed strong interest here.
If FVG fails to hold, expect a retest of this trendline near 97,000–98,000.
📈 Likely Scenarios
Base Case (Neutral-Bearish):
Price rejects current zone (~107,000).
Pullback into FVG (101–104K).
Bounce to 105K (minor resistance), then decide next direction.
Bullish Breakout:
If price breaks and closes above 110K, it invalidates supply zone.
Opens door to 115–118K range.
Bearish Breakdown:
Fails FVG zone.
Tests previous swing low and support (~97K).
Below that, structure becomes macro bearish.
🧩 Summary
Short-Term: Retracement into FVG likely. Monitor reaction.
Medium-Term: Bearish bias while price is below 110K.
Invalidation for bears: Clean break and hold above 110K.
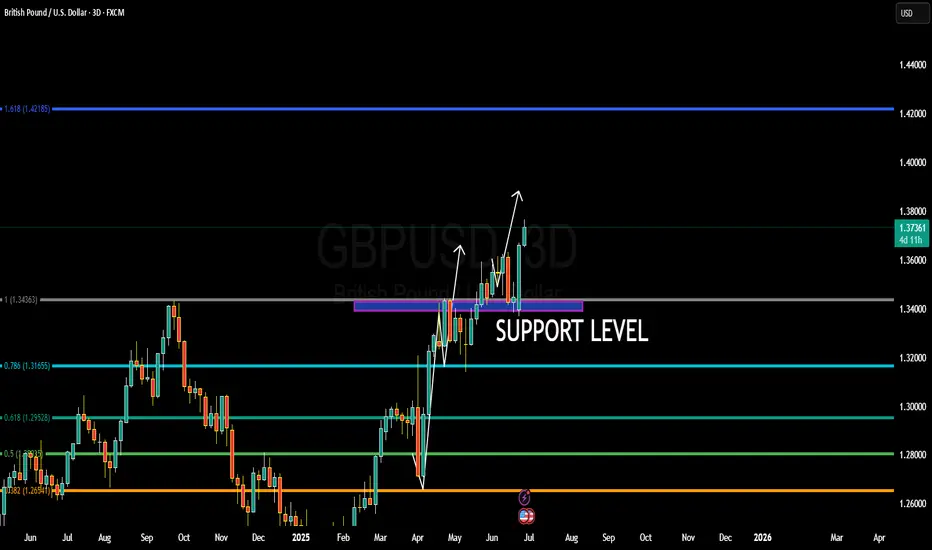
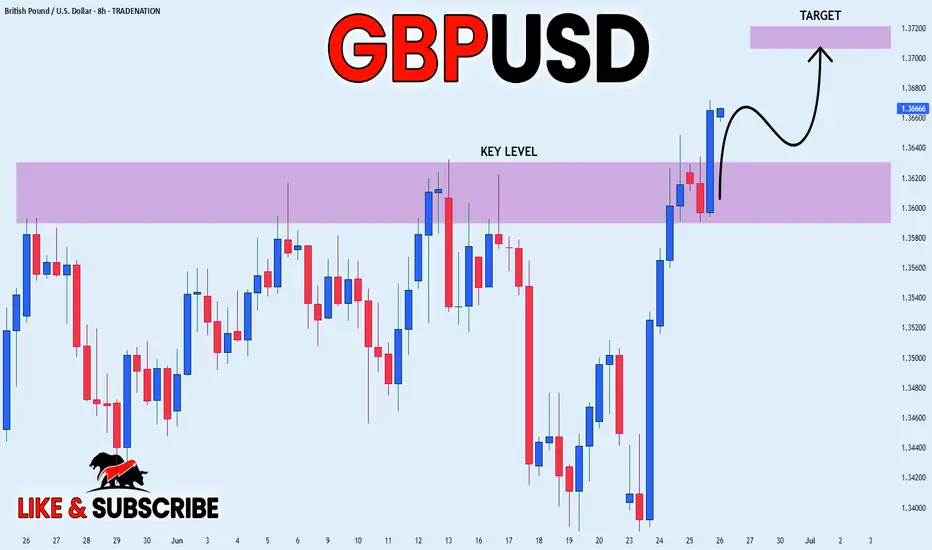
WHY GBPUSD BULLISH ???GBPUSD is unfolding exactly as anticipated, with price now hovering around the 1.3740 region and maintaining strong bullish momentum. Price has successfully bounced from the key support zone near 1.3430, which was previously a major resistance turned into solid demand. This level held firmly during multiple retests, confirming a clean breakout-retest continuation pattern. As long as this structure remains intact, I continue to hold a bullish bias targeting 1.4000 in the coming sessions.
From a fundamental perspective, the British Pound is gaining strength on the back of improved UK economic sentiment. The latest UK inflation data surprised to the upside, pushing annual CPI back above 3%, which reinforces expectations that the Bank of England may need to act sooner rather than later on rate hikes. Markets are now pricing in higher probability of a rate adjustment before the end of Q3 2025. Meanwhile, the US Dollar is under moderate pressure as recent soft labor data and downward revisions in consumer confidence readings have dampened expectations for further tightening from the Fed.
Technically, GBPUSD has cleared major Fibonacci resistance levels and is now forming higher highs and higher lows across the higher timeframes. The current bullish wave is fueled by clean institutional demand and strong price action momentum. If the pair can sustain above 1.3650–1.3680, a swift move toward the psychological 1.4000 handle is highly probable. The 1.4218 Fibonacci extension aligns as a longer-term secondary target for swing traders holding this bullish continuation.
This setup offers a solid blend of macroeconomic backing and technical structure. GBPUSD remains one of the top trending forex pairs right now, favored by strong price action, central bank divergence, and global capital rotation. I'm closely monitoring for intraday pullbacks to add long positions, aiming for extended upside as the market follows through on this bullish breakout continuation.
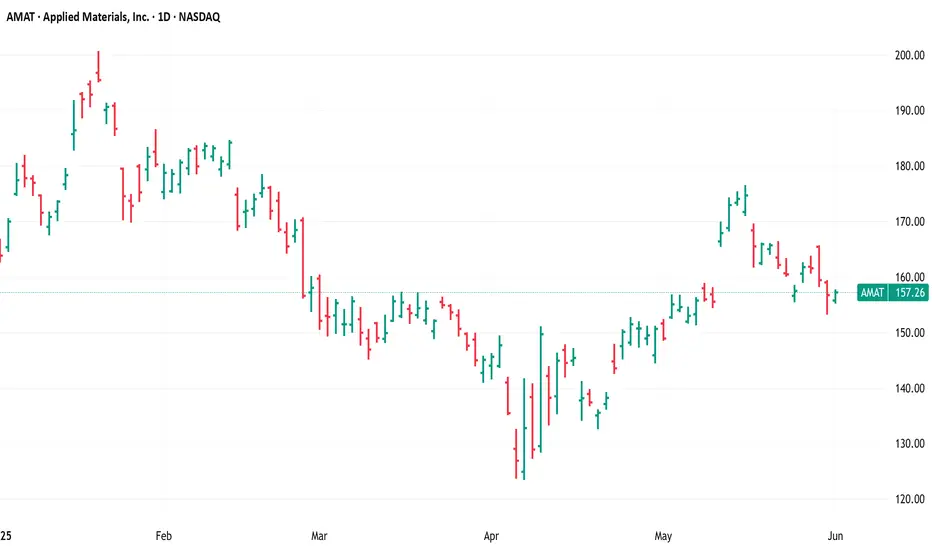
$AMAT, Long, TP>10-15%NASDAQ:AMAT , Long, TP>10-15%
Fundamentally the stock is good.
Choose an entry point and do not forget about a protective order if you are trading with leverage.
Don't risk it if you're not sure.
Good luck to everyone.
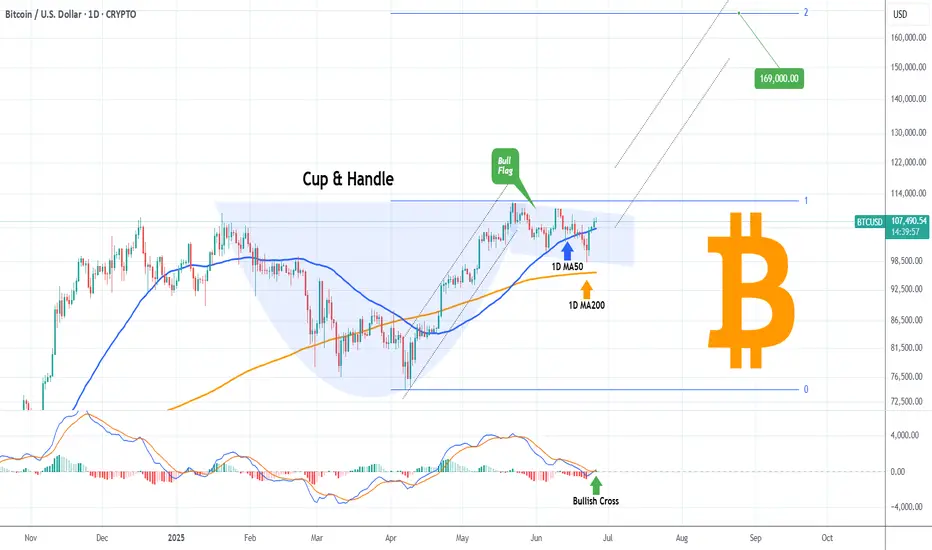
BITCOIN Cup & Handle completed! Technical Target $169k!Bitcoin (BTCUSD) is about to complete the Handle of a Cup and Handle (C&H) pattern. This comes only days after breaking below its 1D MA50 (blue trend-line) buy holding the 1D MA200 (orange trend-line) and rebounding.
Well the 1D MA50 has been recovered and on top of that, the 1D MACD just formed a Bullish Cross. This (isolated) Bull Flag, which is the Handle, technically targets the 2.0 Fibonacci extension at $169000.
Do you think that's realistic or a little excessive within thin time-frame? Feel free to let us know in the comments section below!
-------------------------------------------------------------------------------
** Please LIKE 👍, FOLLOW ✅, SHARE 🙌 and COMMENT ✍ if you enjoy this idea! Also share your ideas and charts in the comments section below! This is best way to keep it relevant, support us, keep the content here free and allow the idea to reach as many people as possible. **
-------------------------------------------------------------------------------
💸💸💸💸💸💸
👇 👇 👇 👇 👇 👇
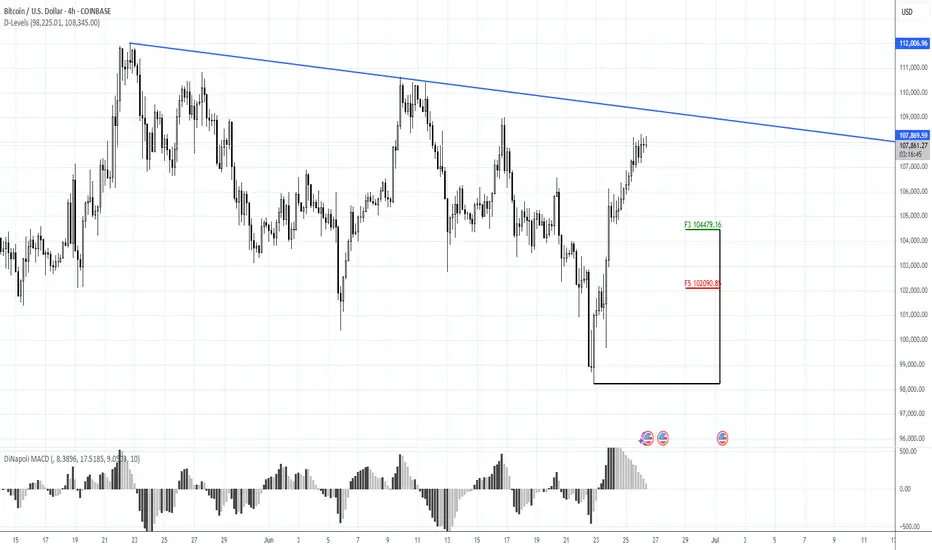
110K, maybe 112K at the bestMorning folks,
So, previous setup is done perfect, and BTC even reached 108K area. Now we think that upside potential is limited, at least in short-term. Price is coming to resistance area around 110K and previous top. Some intraday targets point on 112K area as well, but I wouldn't count now on something more extended.
The point is US Dollar stands at record monthly Oversold. So, its weakness in short term is limited as well. Besides, we're coming to very bumpy period of tariffs negotiations from 9th of July, debt ceil discussion and BBB voting, as early as tomorrow...
So for now, uncertainty and risk overcome the upside potential on BTC.
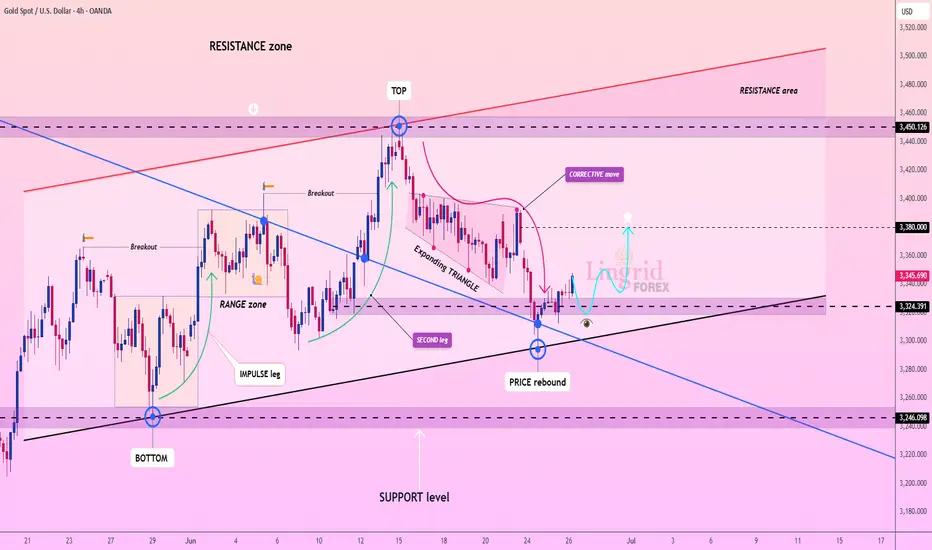
Lingrid | GOLD Potential Bullish Reversal TradeOANDA:XAUUSD is rebounding from key structure support after forming a double-leg corrective move inside an expanding triangle. Price has reclaimed the 3,324 zone, aligning with the trendline and support confluence, suggesting a short-term bullish bias. If this rebound sustains, gold could retest the 3,380 barrier before eyeing the 3,450 resistance ceiling. A rejection from mid-levels would reintroduce downside pressure toward the 3,246 zone.
📈 Key Levels
Buy zone: 3,320–3,330
Sell trigger: break below 3,324
Target: 3,450
Buy trigger: strong candle close above 3,380
💡 Risks
Weak volume could stall upside continuation
Failure to hold the trendline may drag price toward 3,246
Broader resistance zone between 3,380–3,450 could limit upside momentum
If this idea resonates with you or you have your own opinion, traders, hit the comments. I’m excited to read your thoughts!
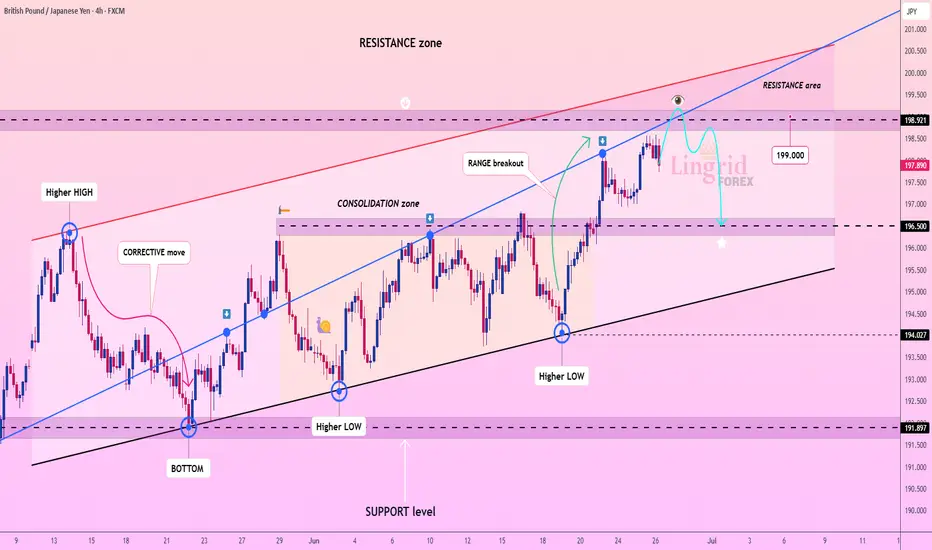
Lingrid | GBPJPY pullback TRADE. Short from RESISTANCE zoneThe market is stalling below the 199 zone after a sharp breakout from the previous consolidation block. Price action remains inside an ascending channel, with the structure posting consistent higher lows and a clean bullish leg. However, the pair is now testing a key resistance area near 198.9, where previous highs and upper trendline pressure may trigger a correction. If rejection follows, a drop toward the 196.5-196.0 region remains likely before any further continuation.
📈 Key Levels
Buy zone: 196.0–196.5
Sell trigger: rejection at 199 resistance
Target: 199.9–200.5
Buy trigger: strong candle close above 199.0
💡 Risks
False breakout above 199 may trap late buyers
Lack of follow-through volume could weaken bullish momentum
Channel support breach may flip structure bearish
If this idea resonates with you or you have your own opinion, traders, hit the comments. I’m excited to read your thoughts!
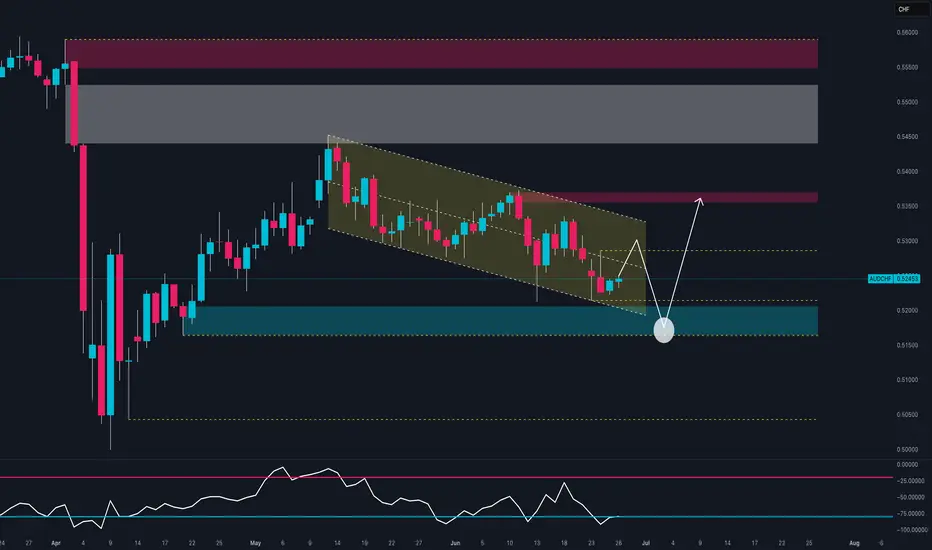
AUDCHF at Make-or-Break Zone: Smart Money Reversal or Breakdown?1. Price Action
Price is currently trading within a descending channel, with 0.5244 hovering near a key demand zone (0.5150–0.5200), where a first bullish reaction has already occurred.
The structure suggests a potential fake breakdown, with room for a rebound toward static resistances at 0.5330, and possibly 0.5450.
RSI is rising from oversold, showing signs of a potential bullish divergence.
📌 Technical bias: Waiting for confirmation of a reversal at key support.
Upside targets: 0.5330 > 0.5450.
Ideal stop-loss below 0.5160.
2. Retail Sentiment
72% of retail traders are long, with an average entry at 0.5551, now facing a 300+ pip drawdown.
This increases short-term contrarian bearish pressure, but also signals liquidity above the highs, which could be targeted before a true bullish reversal.
3. Commitment of Traders (as of June 17, 2025)
AUD – Bearish
Massive drop in both commercial longs (-60k) and shorts (-60k) suggests broad disengagement.
Non-commercials remain net short (-69k), with overall open interest declining.
CHF – Neutral to Bullish
CHF also sees declines in positioning, but commercial traders remain firmly net long (+51.7k).
Non-commercials are net short (-25.5k).
📌 COT Conclusion: AUD remains structurally weaker than CHF, but both currencies are showing signs of positioning uncertainty. This compression phase may precede a technical rebound on AUDCHF.
4. Seasonality
AUD
June historically shows modest strength on 10Y and 5Y averages.
However, 2Y data points to weakness → any rally may be short-lived or fragile.
CHF
CHF tends to be strong in June, especially on 20Y and 10Y views.
Yet, short-term (2Y) data shows end-of-month weakness, suggesting possible profit-taking ahead.
✅ Operational Outlook
Short-term bias: Long AUDCHF (corrective rebound)
Medium/long-term bias: Bearish (still in a downtrend)
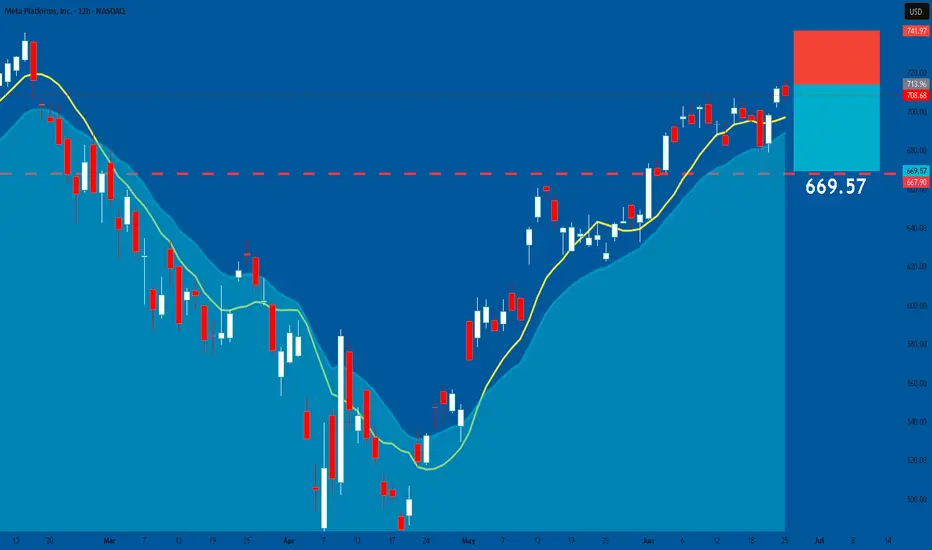
META: Short From Resistance! SELL!
META
- Classic bearish resistance pullback
- Our team expects a move down
SUGGESTED TRADE:
Swing Trade
Sell META
Entry Level - 708.68
Sl - 742.00
Tp - 667.90
Our Risk - 1%
Start protection of your profits from lower levels
Disclosure: I am part of Trade Nation's Influencer program and receive a monthly fee for using their TradingView charts in my analysis.
❤️ Please, support our work with like & comment! ❤️
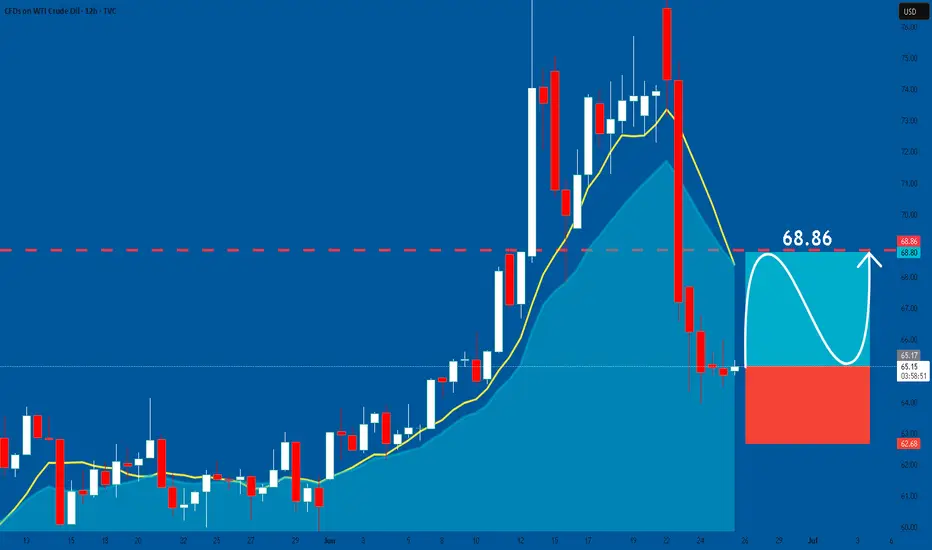
USOIL: Bullish Correction Ahead! Buy!
USOIL
- Classic bullish correction formation
- Our team expects growth
SUGGESTED TRADE:
Swing Trade
Buy USOIL
Entry Level - 65.16
Sl - 62.68
Tp - 68.86
Our Risk - 1%
Start protection of your profits from lower levels
Disclosure: I am part of Trade Nation's Influencer program and receive a monthly fee for using their TradingView charts in my analysis.
❤️ Please, support our work with like & comment! ❤️
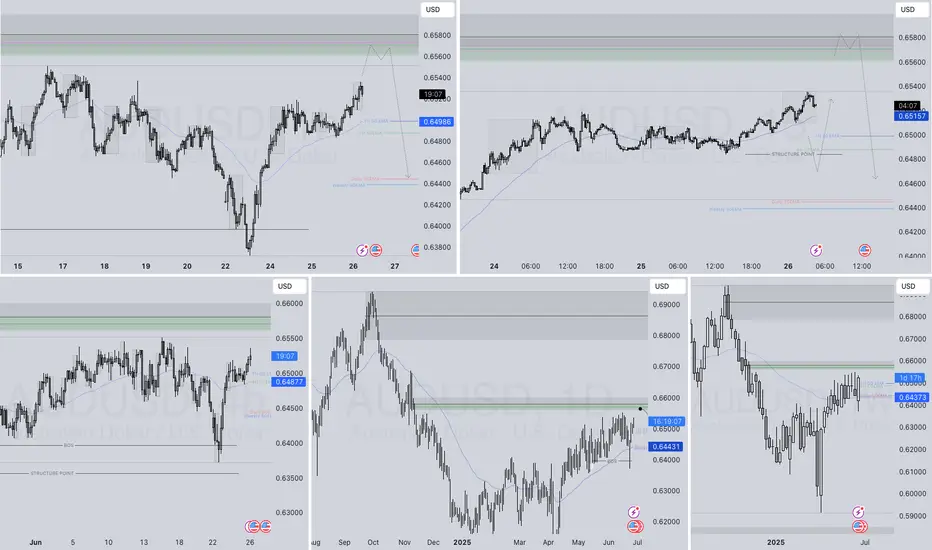
AUDUSD SHORT FORECAST Q2 W26 D26 Y25AUDUSD SHORT FORECAST Q2 W26 D26 Y25
Professional Risk Managers👋
Welcome back to another FRGNT chart update📈
Diving into some Forex setups using predominantly higher time frame order blocks alongside confirmation breaks of structure.
Let’s see what price action is telling us today!
💡Here are some trade confluences📝
✅Daily order block
✅1H Order block
✅Intraday breaks of structure
✅4H Order block
🔑 Remember, to participate in trading comes always with a degree of risk, therefore as professional risk managers it remains vital that we stick to our risk management plan as well as our trading strategies.
📈The rest, we leave to the balance of probabilities.
💡Fail to plan. Plan to fail.
🏆It has always been that simple.
❤️Good luck with your trading journey, I shall see you at the very top.
🎯Trade consistent, FRGNT X
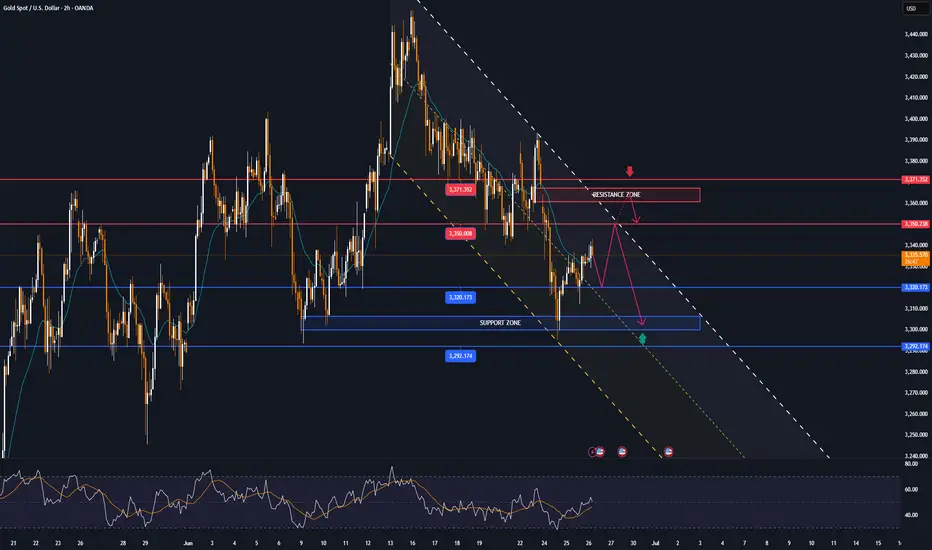
GOLD recovers from around $3,300 area, short-term targetsOANDA:XAUUSD has recovered slightly and is currently trading around $3,332/oz, supported by a decline in the US dollar and US bond yields. The market is closely watching the fragile ceasefire between Israel and Iran.
The US Dollar Index TVC:DXY is near a one-week low, making dollar-priced gold more attractive to holders of other currencies. The benchmark 10-year US Treasury yield is holding near its lowest in more than a month.
As the conflict between Israel and Iran ends, geopolitical risk levels have disappeared, safe-haven funds have flowed back and thus gold is under pressure.
From a more macro perspective, gold remains in an uptrend and real yields are expected to fall further amid continued Fed easing. In the short term, if the market reprices rate cut expectations to become hawkish, this could trigger a technical correction in gold.
Economic data in the coming months will be particularly important for the gold market. If inflation data remains weak or the labor market deteriorates further, Fed officials could cut rates sooner or more significantly than expected.
A ceasefire between Iran and Israel brokered by U.S. President Donald Trump appeared to have taken effect on Wednesday, a day after both countries signaled a temporary end to their conflicting air strikes.
WASHINGTON (Reuters) - U.S. consumer confidence unexpectedly fell in June, reflecting growing concerns among households about job prospects and another sign of a weakening labor market amid uncertainty over Trump’s tariffs.
Federal Reserve Chairman Jerome Powell told Congress on Tuesday that higher tariffs could start to push up inflation this summer, a key period when the Fed considers whether to cut interest rates.
Traders of federal funds futures are currently pricing in a cumulative 60 basis points of rate cuts through 2025, with the first cut likely to come in September.
Technical Outlook Analysis OANDA:XAUUSD
Gold has recovered slightly after testing the important support area noted by readers in yesterday's edition, around the raw price point of $3,300. However, the temporary recovery is being limited by the EMA21 moving average, followed by the 0.236% Fibonacci retracement level, which can also be considered as upside targets for the time being.
In terms of overall structure, gold is still in an uptrend with the price channel as the main trend. On the other hand, RSI is also hovering around 50, indicating that the market sentiment is still hesitant and does not have enough momentum for a complete trend.
Intraday, gold still has a bullish technical outlook, but a sell-off that takes gold below the 0.382% Fibonacci retracement level would be a bearish signal in the near term. Therefore, long positions should be opened near the $3,300 area, with protective levels behind the 0.382% Fibonacci retracement.
Notable positions will also be listed as follows.
Support: $3,320 – $3,300 – $3,292
Resistance: $3,350 – $3,371
SELL XAUUSD PRICE 3367 - 3365⚡️
↠↠ Stop Loss 3371
→Take Profit 1 3359
↨
→Take Profit 2 3353
BUY XAUUSD PRICE 3301 - 3303⚡️
↠↠ Stop Loss 3297
→Take Profit 1 3309
↨
→Take Profit 2 3315
GBP_USD WILL KEEP GROWING|LONG|
✅GBP_USD broke the key structure level of 1.3620
While trading in an local uptrend
Which makes me bullish biased
And I think that after the retest of the broken level is complete
A rebound and bullish continuation will follow
LONG🚀
✅Like and subscribe to never miss a new idea!✅
Disclosure: I am part of Trade Nation's Influencer program and receive a monthly fee for using their TradingView charts in my analysis.
AUD-NZD Long From Rising Support! Buy!
Hello,Traders!
AUD-NZD went down but
Will soon retest a rising
Support line from where
We will be expecting a
Bullish rebound and a move up
Buy!
Comment and subscribe to help us grow!
Check out other forecasts below too!
Disclosure: I am part of Trade Nation's Influencer program and receive a monthly fee for using their TradingView charts in my analysis.

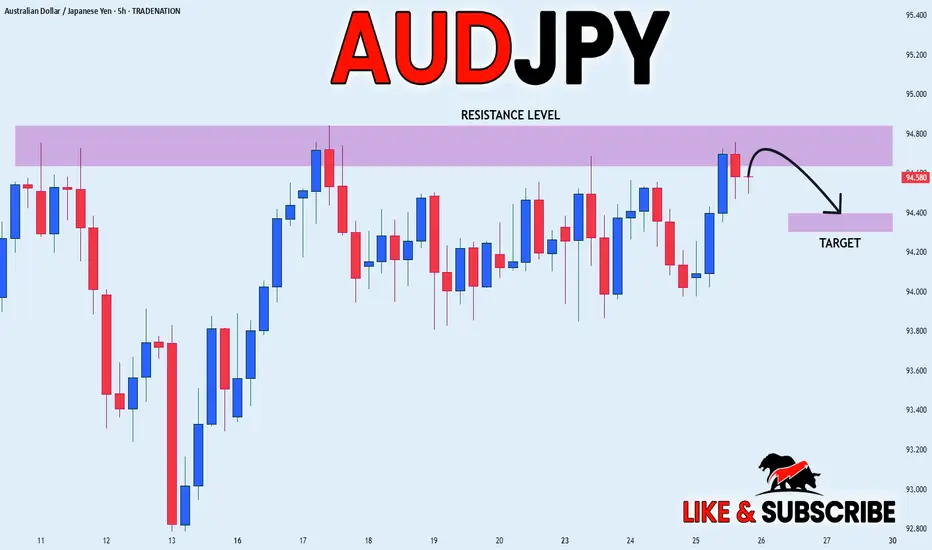
AUD_JPY LOCAL SHORT|
✅AUD_JPY made a retest of the
Strong horizontal resistance level of 94.800
And as you can see the pair is already
Making a local pullback from
The level which sends a clear
Bearish signal to us therefore
We will be expecting a
Further bearish correction
SHORT🔥
✅Like and subscribe to never miss a new idea!✅
Disclosure: I am part of Trade Nation's Influencer program and receive a monthly fee for using their TradingView charts in my analysis.
Lingrid | EURCAD April High - Key Resistance Level TestThe price perfectly fulfilled my last idea . FX:EURCAD is extending its bullish leg after breaking out of both a triangle pattern and the downward trendline. The pair reached the 1.59500 resistance area and is now hovering within a broad supply zone where previous reactions occurred. Unless bulls force a sustained breakout, the price may revisit the 1.58060 support for reaccumulation.
📈 Key Levels
Sell zone: 1.59500 - 1.59700
Sell trigger: breakdown below 1.59000
Target: 1.58060
Buy trigger: above 1.57500
💡 Risks
False breakout from resistance could trap late buyers
Extended move may prompt short-term profit-taking
Break below the upward trendline weakens bullish momentum
If this idea resonates with you or you have your own opinion, traders, hit the comments. I’m excited to read your thoughts!
