GME GameStop - A Crypto Proxy with Surprise UpsideIf you haven`t bought GME before the previous rally:
Why GME Could Rally by Year-End 2025:
1. Hidden Bitcoin Exposure
GameStop recently revealed it holds a significant amount of Bitcoin on its balance sheet — quietly positioning itself as a crypto proxy in the equity markets.
While not a traditional miner or crypto company, GME gives exposure to BTC upside without being a pure-play crypto stock.
With Bitcoin aiming for new highs in 2025, any company with BTC on its books becomes more valuable — just as we saw with Tesla and MicroStrategy in prior cycles.
2. Retail Speculation and Meme Momentum
GME has always been a retail-fueled stock, and retail interest is surging again in crypto and meme trades.
As crypto enters a new speculative phase, GME could benefit from a reflexive feedback loop: BTC goes up → GME gains attention → more retail FOMO → GME rises.
Recent reappearance of figures like Roaring Kitty has reignited interest — and if crypto sentiment stays hot, GME could ride that wave.
3. Lean Balance Sheet and Optionality
After multiple share offerings, GameStop is flush with cash and minimal debt — giving it financial flexibility.
Holding BTC enhances its treasury strategy during inflationary or weak-dollar cycles.
This also gives it optionality to enter Web3, NFTs (again), or even blockchain gaming — areas where its brand could carry weight.
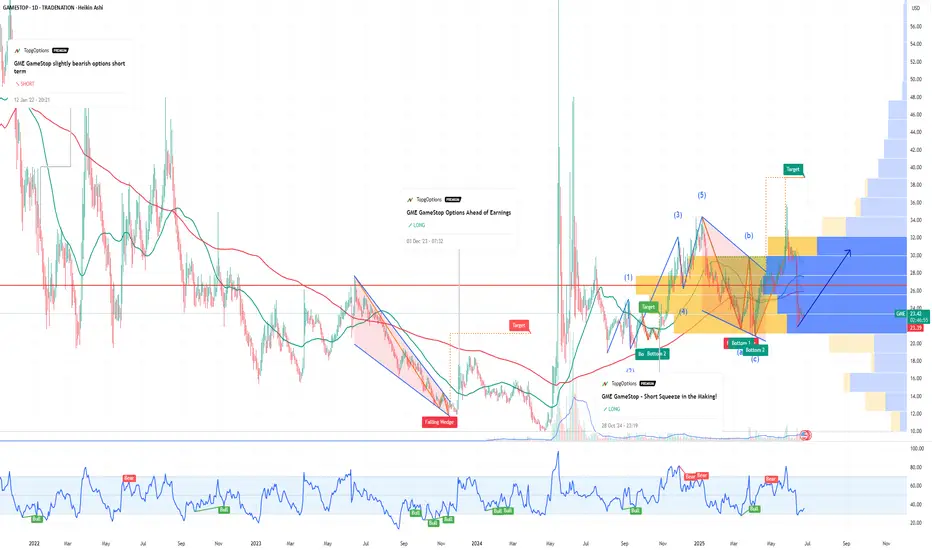
Technical Setup
GME is consolidating above key support in the $20–23 zone, forming a potential bull flag or base for another breakout.
Any breakout in Bitcoin or renewed meme-stock energy could push GME to test $35–40, or even $50+ if momentum returns.
Final Thoughts
GME may not be a traditional crypto stock, but it’s now quietly tied to Bitcoin performance. With crypto heating up and retail risk appetite returning, GameStop becomes a speculative bet on BTC, memes, and volatility — all in one ticker.
Disclosure: I am part of Trade Nation's Influencer program and receive a monthly fee for using their TradingView charts in my analysis.
Signals
RIOT Stock: Leveraged Bet on Bitcoin’s Next Leg UpMy Bullish Thesis:
1. Leverage to Bitcoin Without Holding BTC
RIOT is one of the largest publicly traded Bitcoin miners in the U.S., offering investors exposure to the upside of Bitcoin — without directly owning the coin.
If Bitcoin goes to $100K or higher, miner stocks like RIOT historically outperform BTC in percentage terms.
This makes RIOT a high-beta play on the ongoing crypto bull market.
2. Post-Halving Upside
The April 2024 Bitcoin halving cut block rewards by 50%, which squeezes less-efficient miners — but RIOT benefits from:
Low-cost mining operations due to cheap electricity agreements in Texas.
Recent upgrades in hardware efficiency (with high-performance ASICs).
Greater share of the network hash rate as weaker players drop out.
Historically, Bitcoin and miners perform best in the 6–18 months after a halving, positioning RIOT for strong gains through year-end 2025.
3. Massive Infrastructure and Expansion
RIOT owns a 400+ megawatt mining facility in Texas, one of the largest in North America.
They’re expanding capacity and have locked in long-term energy deals that give them a key advantage during spikes in energy costs.
The company also earns revenue through demand response credits, essentially being paid to shut down power usage during Texas grid stress — a unique hedge for a miner.
4. Regulatory Edge Over Offshore Miners
As U.S.-based and NASDAQ-listed, RIOT is better positioned than foreign or unregulated competitors if/when the U.S. passes legislation around digital assets and mining.
This could lead to greater institutional adoption of RIOT versus other miners.
It’s also eligible for ETF inclusion or institutional funds focused on digital infrastructure or U.S. innovation.
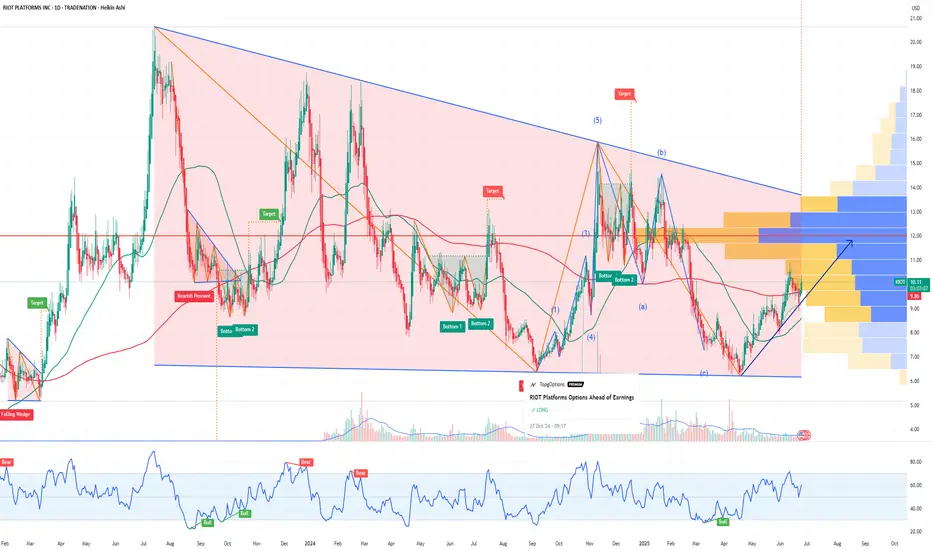
RIOT is a classic “picks and shovels” play on the Bitcoin bull run — offering levered upside without having to buy BTC directly. With post-halving tailwinds, institutional favorability, and a strong technical breakout in progress, RIOT may be one of the top speculative growth plays in the crypto equity space heading into the second half of 2025.
Disclosure: I am part of Trade Nation's Influencer program and receive a monthly fee for using their TradingView charts in my analysis.
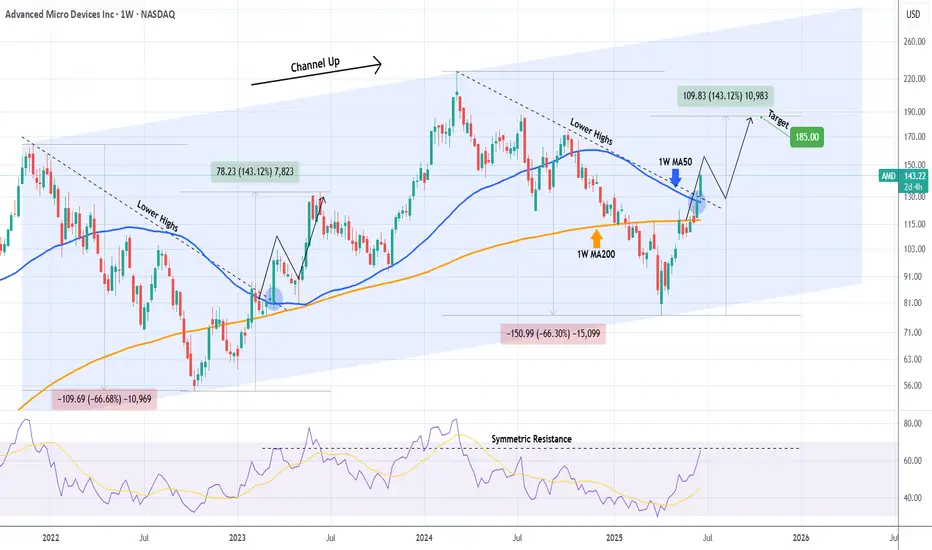
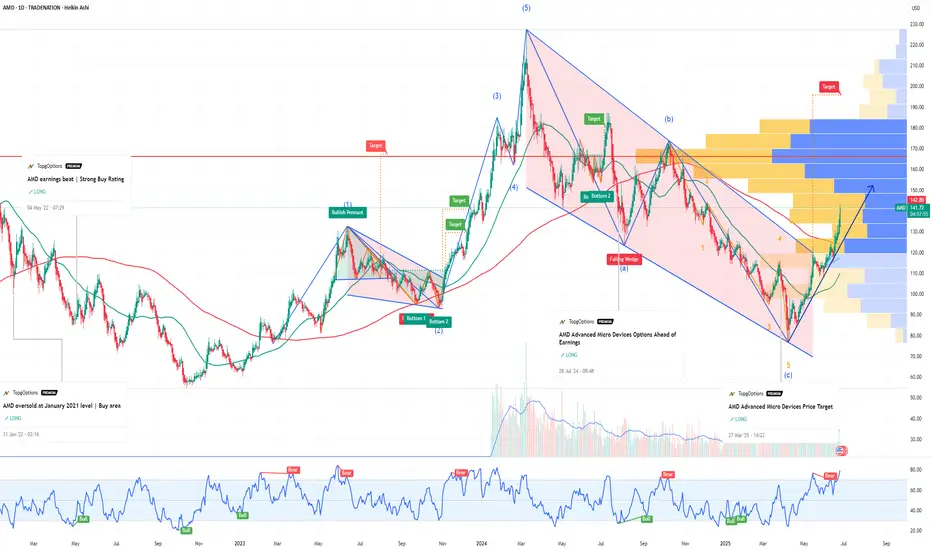
AMD Major Lower Highs/ 1W MA50 break-out.It was only 9 days ago (June 16, see chart below) when we called for a potential bullish break-out on Advanced Micro Devices (AMD) above the 1W MA50 (blue trend-line):
The break-out did happen, this 1W candle is already considerably above its 1W MA50 and based also on the level the 1W RSI is at right now, it may resemble more the March 13 2023 1W candle instead of the January 30 2023 as previously thought.
The reason is the major break-out of the All Time High (ATH) Lower Highs trend-line that came along with the 1W MA50. As you can see, it was on the March 13 2023 1W candle that AMD broke above that trend-line with the 1W RSI being on the same level (66.00) as today.
This candle formed a short-term Top, with the price initiating a 1.5 month pull-back that re-tested the 1W MA50 as Support and then moved on to complete the +143.12% Bullish Leg from the Channel Up bottom.
As a result, we can't rule out the first wave of short-term profit taking by next week. But a potential 1W MA50 test, will be another long-term buy entry in our view. Our $185.00 Target remains intact.
-------------------------------------------------------------------------------
** Please LIKE 👍, FOLLOW ✅, SHARE 🙌 and COMMENT ✍ if you enjoy this idea! Also share your ideas and charts in the comments section below! This is best way to keep it relevant, support us, keep the content here free and allow the idea to reach as many people as possible. **
-------------------------------------------------------------------------------
💸💸💸💸💸💸
👇 👇 👇 👇 👇 👇
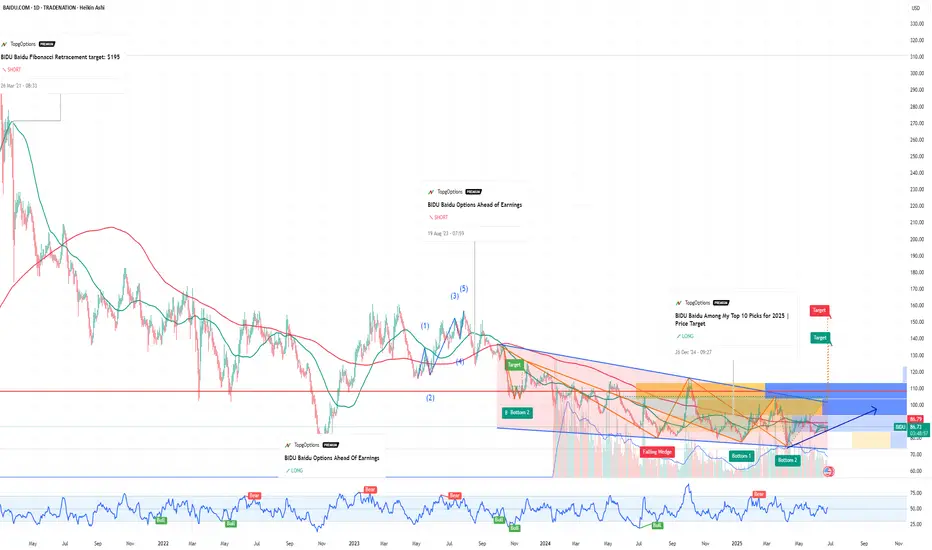
Baidu ($BIDU): China’s Google Is Ready to Break OutIf you haven`t bought BIDU on the previous dip:
What you need to know now:
1. Baidu = The Google of China
Baidu dominates China’s search engine market, holding over 60% market share, making it the Google equivalent in the world's second-largest economy.
Its advertising business is deeply entrenched in Chinese internet infrastructure.
As digital ad spending rebounds in China, Baidu’s core business benefits directly.
2. AI and Autonomous Driving Moonshots
Baidu is China’s national AI champion, pouring billions into next-gen technologies:
Ernie Bot (Baidu’s ChatGPT competitor) is now integrated across its ecosystem and enterprise offerings.
Apollo Go, Baidu’s autonomous driving platform, already operates robo-taxis in multiple Chinese cities and has received licenses for fully driverless operations.
Baidu also provides AI cloud services, competing with Alibaba Cloud and Huawei.
With the Chinese government pushing AI self-sufficiency, Baidu is one of the biggest beneficiaries.
3. Cheap Valuation with High-Tech Exposure
Baidu trades at a forward P/E under 10 and price-to-sales under 2, despite being a major player in AI, cloud, and mobility.
That’s a fraction of what US tech firms with similar ambitions (like Alphabet or Tesla) are valued at.
Over $25 billion in cash and investments on the balance sheet adds a margin of safety.
4. Government Support & Stimulus Tailwinds
The Chinese government is pivoting back toward supporting tech innovation, especially in AI, after years of regulatory crackdowns.
Baidu is aligned with national AI and autonomous driving goals.
If the government ramps up fiscal stimulus, especially in infrastructure and technology, Baidu will likely benefit.
Disclosure: I am part of Trade Nation's Influencer program and receive a monthly fee for using their TradingView charts in my analysis.
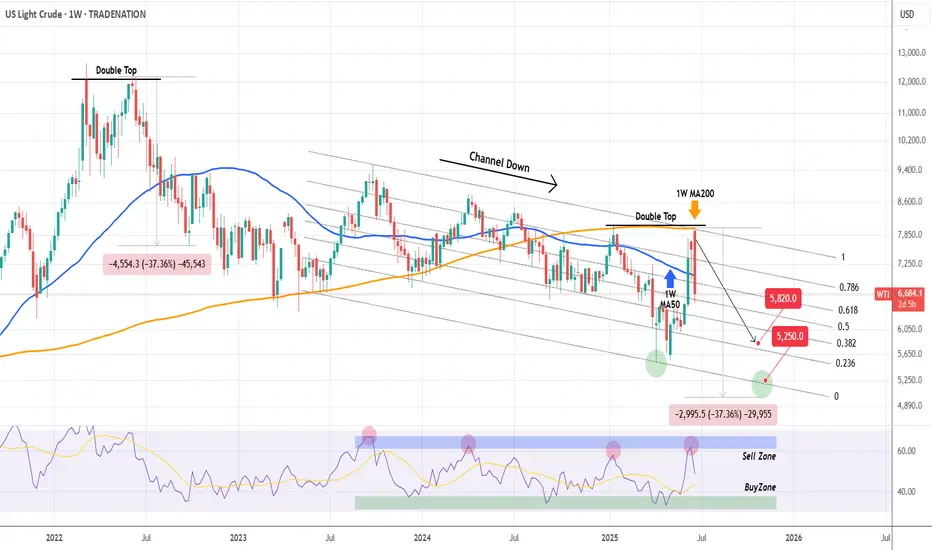
WTI OIL Progressively bearish on the long-term. Eyes $52.50.A week has passed since our sell signal on WTI Oil (USOIL) and the emerging geopolitical stability has already helped the price move much faster towards our $58.20 Target (see chart in related ideas below).
If we look at it from an even longer term perspective, the 1W time-frame in particular, we can see draw some very useful conclusions about the bearish case. First of all that this week's High got rejected exactly on the 1W MA200 (orange trend-line), which is the trend-line that made the last 3 major rejections on the market (January 13 2025, October 07 2024).
As you can see, that was a textbook Double Top formation. The last Double Top rejection took place on June 06 2022, the previous multi-year Top for the market. The result was a continued sell-off that didn't stop before testing the 1W MA200, which is now the Resistance.
As a result, even though our $58.20 Target stands, on the longer term we can even see a -37.36% decline towards the end of the year. Contact with the bottom of the Channel Down can be made at $52.50.
Alternatively, you can look at the 1W RSI, which has a clear Sell and clear Buy Zone. This week it was rejected on the Sell Zone, so you may look to book your profit as soon as it enters the Buy Zone.
-------------------------------------------------------------------------------
** Please LIKE 👍, FOLLOW ✅, SHARE 🙌 and COMMENT ✍ if you enjoy this idea! Also share your ideas and charts in the comments section below! This is best way to keep it relevant, support us, keep the content here free and allow the idea to reach as many people as possible. **
-------------------------------------------------------------------------------
Disclosure: I am part of Trade Nation's Influencer program and receive a monthly fee for using their TradingView charts in my analysis.
💸💸💸💸💸💸
👇 👇 👇 👇 👇 👇
Bullish Thesis: Why AMD Stock Could Soar by Year-End 2025If you haven`t bought AMD before the previous rally:
What to consider now:
1. AI Tailwinds Are Accelerating
AMD is finally gaining serious traction in the AI GPU race. Its MI300X accelerator chips are being adopted by big names like Microsoft, Meta, and Oracle for data center AI workloads. While NVIDIA is still dominant, AMD is expected to grab 10–20% of the AI GPU market share by 2025, according to industry estimates. That’s a multibillion-dollar opportunity.
The MI300X already passed $1B in revenue within its first quarters.
AI server TAM (total addressable market) is expected to grow to $400B by 2027 — AMD is positioning itself aggressively to carve out its slice.
2. Valuation Looks Reasonable vs Peers
AMD trades at a forward P/E around 40, significantly below Nvidia (which trades over 60x) despite similar growth projections for the next 2 years.
Revenue expected to grow over 15–20% YoY in 2025.
Gross margins expanding as high-performance chips dominate the mix.
3. Diversified Growth: Beyond AI
Gaming segment (PlayStation 5 and Xbox Series X chips) remains strong.
Embedded segment from Xilinx acquisition continues to generate solid cash flow.
Client CPU business is rebounding as the PC market stabilizes.
4. Strong Management and Execution
CEO Lisa Su is widely respected for turning AMD around and guiding the company through major innovations and acquisitions (Xilinx, Pensando). Execution has remained consistent, especially in delivering cutting-edge performance-per-watt chips.
Disclosure: I am part of Trade Nation's Influencer program and receive a monthly fee for using their TradingView charts in my analysis.
Trading balanceTrading balance The price of the asset has rebounded from the balance zone. With the prospect of growth into the resistance zone.
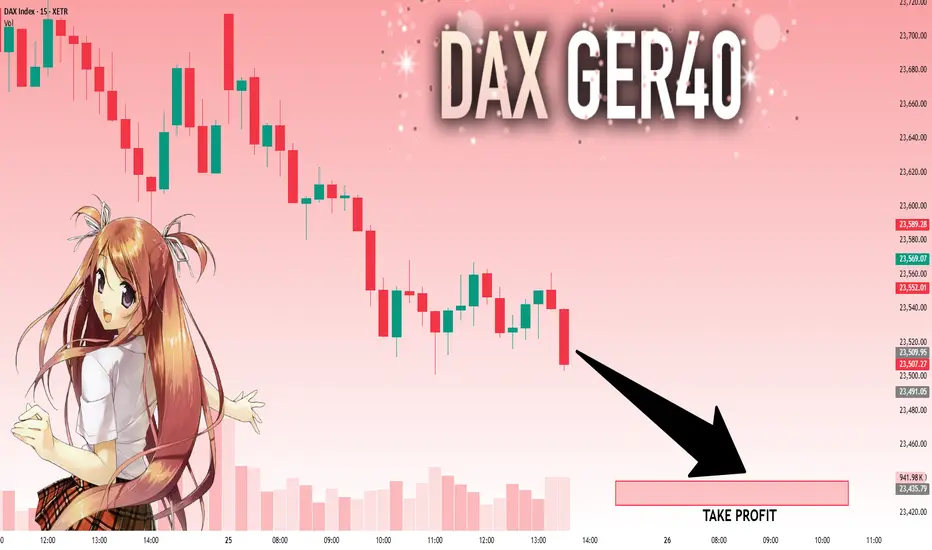
DAX: Move Down Expected! Short!
My dear friends,
Today we will analyse DAX together☺️
The price is near a wide key level
and the pair is approaching a significant decision level of 23,509.95 Therefore, a strong bearish reaction here could determine the next move down.We will watch for a confirmation candle, and then target the next key level of 23,438.51..Recommend Stop-loss is beyond the current level.
❤️Sending you lots of Love and Hugs❤️
GOLD: Local Bullish Bias! Long!
My dear friends,
Today we will analyse GOLD together☺️
The recent price action suggests a shift in mid-term momentum. A break above the current local range around 3,314.13 will confirm the new direction upwards with the target being the next key level of 3,322.84 and a reconvened placement of a stop-loss beyond the range.
❤️Sending you lots of Love and Hugs❤️

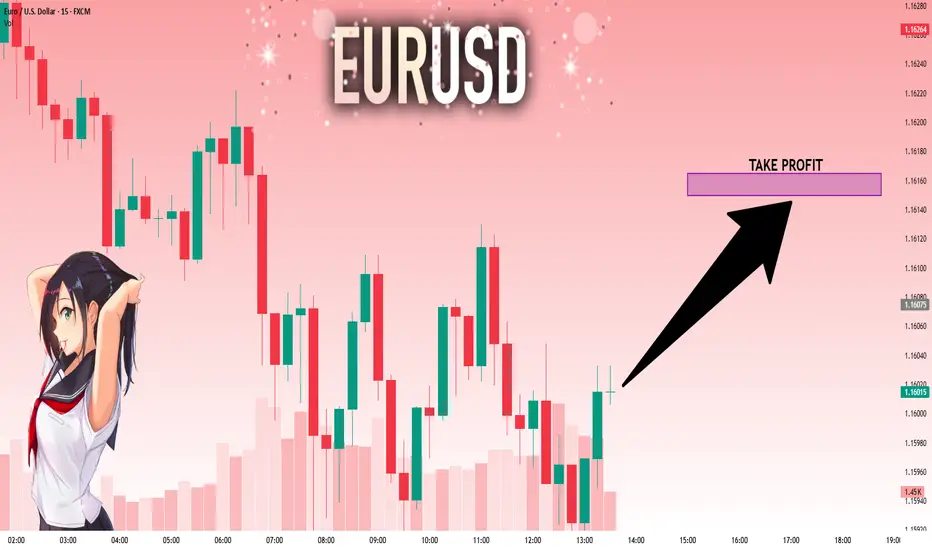
EURUSD: Strong Growth Ahead! Long!
My dear friends,
Today we will analyse EURUSD together☺️
The in-trend continuation seems likely as the current long-term trend appears to be strong, and price is holding above a key level of 1.16017 So a bullish continuation seems plausible, targeting the next high. We should enter on confirmation, and place a stop-loss beyond the recent swing level.
❤️Sending you lots of Love and Hugs❤️
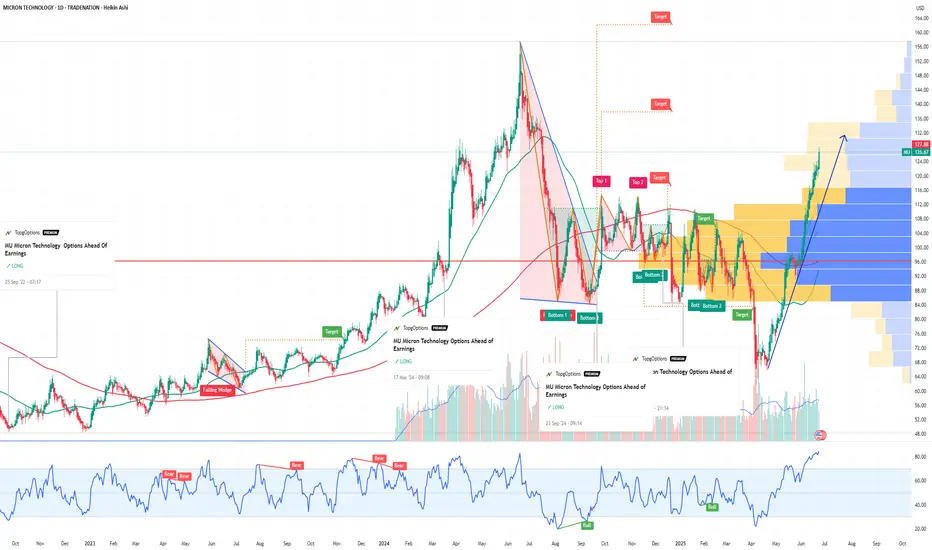
MU Micron Technology Options Ahead of EarningsIf you haven`t bought MU before the rally:
Now analyzing the options chain and the chart patterns of MU Micron Technology prior to the earnings report this week,
I would consider purchasing the 128usd strike price Calls with
an expiration date of 2025-6-27,
for a premium of approximately $5.52.
If these options prove to be profitable prior to the earnings release, I would sell at least half of them.
Disclosure: I am part of Trade Nation's Influencer program and receive a monthly fee for using their TradingView charts in my analysis.
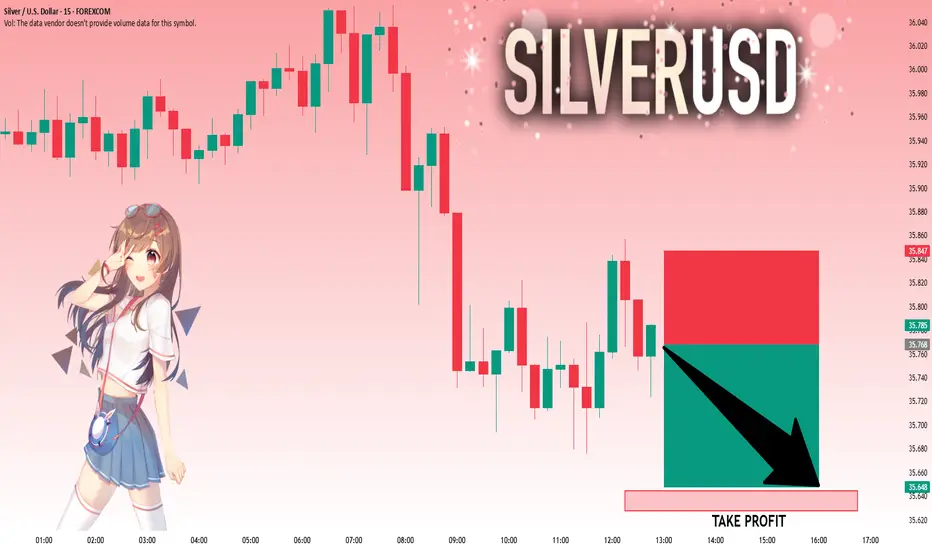
SILVER: Will Go Down! Short!
My dear friends,
Today we will analyse SILVER together☺️
The market is at an inflection zone and price has now reached an area around 35.768 where previous reversals or breakouts have occurred.And a price reaction that we are seeing on multiple timeframes here could signal the next move down so we can enter on confirmation, and target the next key level of 35.645..Stop-loss is recommended beyond the inflection zone.
❤️Sending you lots of Love and Hugs❤️
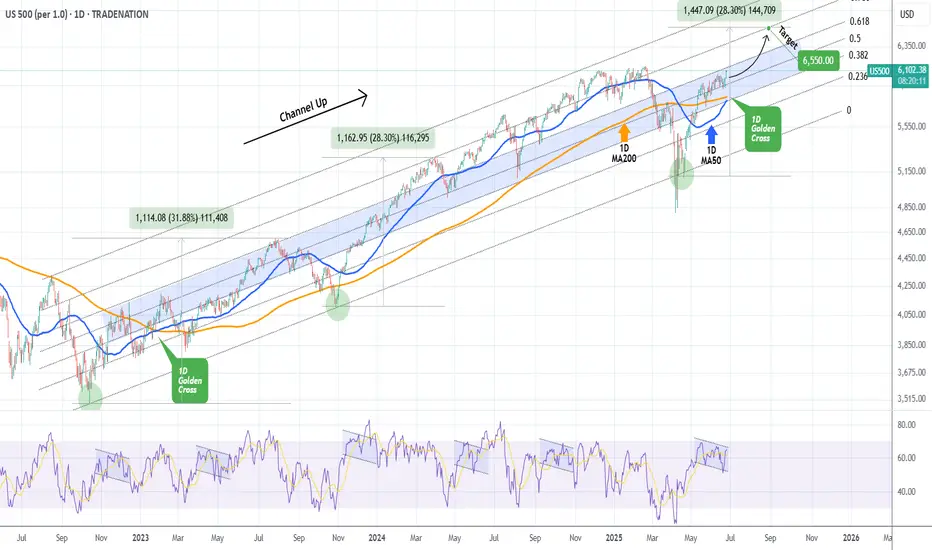
S&P500 1D Golden Cross, middle of 3y Channel, much upside to go!The S&P500 index (SPX) has been trading within a Channel Up since the final sell-off of the 2022 Inflation Crisis. The only time this pattern broke was for 4 days during the bottom formation (April 2025) of the recent Trade War.
Ahead of the first 1D Golden Cross since January 26 2023, the market looks more bullish than ever as it is trading within the 0.5 - 0.618 Fibonacci range of this Channel Up, suggesting that there is considerable upside before it tops.
The last Bullish Leg that started on the Channel Up bottom and peaked before a 1D MA50 (blue trend-line) test grew by +28.30%. Expecting a repeat of that, we may see the price targeting the 0.786 Fibonacci level at 6550 before the next 1D MA50 pull-back.
-------------------------------------------------------------------------------
** Please LIKE 👍, FOLLOW ✅, SHARE 🙌 and COMMENT ✍ if you enjoy this idea! Also share your ideas and charts in the comments section below! This is best way to keep it relevant, support us, keep the content here free and allow the idea to reach as many people as possible. **
-------------------------------------------------------------------------------
Disclosure: I am part of Trade Nation's Influencer program and receive a monthly fee for using their TradingView charts in my analysis.
💸💸💸💸💸💸
👇 👇 👇 👇 👇 👇
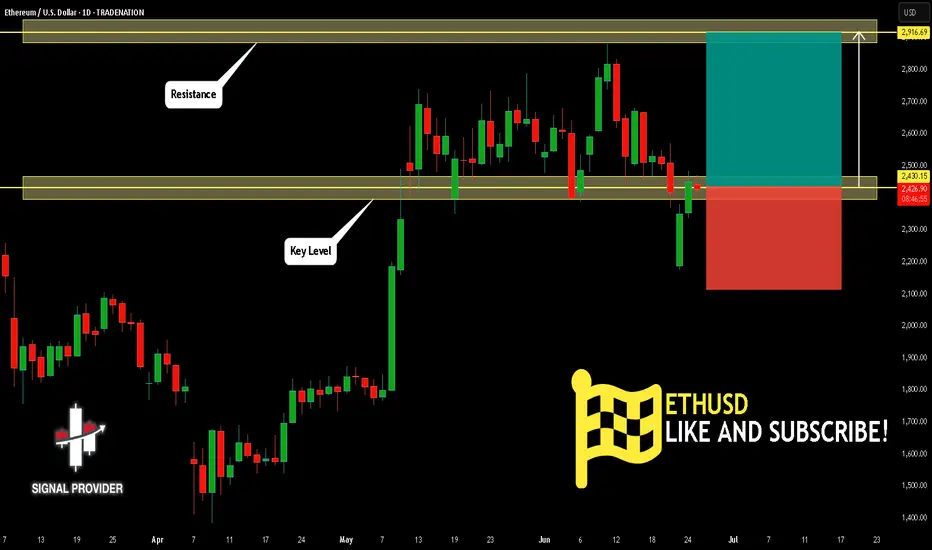
ETHUSD Is Going Up! Long!
Please, check our technical outlook for ETHUSD.
Time Frame: 1D
Current Trend: Bullish
Sentiment: Oversold (based on 7-period RSI)
Forecast: Bullish
The market is approaching a key horizontal level 2,430.15.
Considering the today's price action, probabilities will be high to see a movement to 2,916.69.
P.S
We determine oversold/overbought condition with RSI indicator.
When it drops below 30 - the market is considered to be oversold.
When it bounces above 70 - the market is considered to be overbought.
Disclosure: I am part of Trade Nation's Influencer program and receive a monthly fee for using their TradingView charts in my analysis.
Like and subscribe and comment my ideas if you enjoy them!
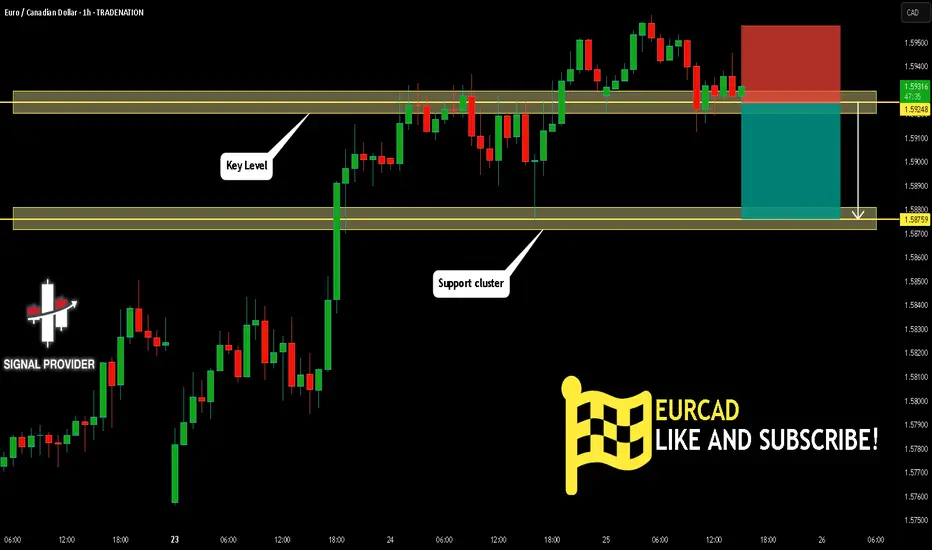
EURCAD Will Fall! Sell!
Here is our detailed technical review for EURCAD.
Time Frame: 1h
Current Trend: Bearish
Sentiment: Overbought (based on 7-period RSI)
Forecast: Bearish
The market is approaching a significant resistance area 1.592.
Due to the fact that we see a positive bearish reaction from the underlined area, I strongly believe that sellers will manage to push the price all the way down to 1.587 level.
P.S
Overbought describes a period of time where there has been a significant and consistent upward move in price over a period of time without much pullback.
Disclosure: I am part of Trade Nation's Influencer program and receive a monthly fee for using their TradingView charts in my analysis.
Like and subscribe and comment my ideas if you enjoy them!
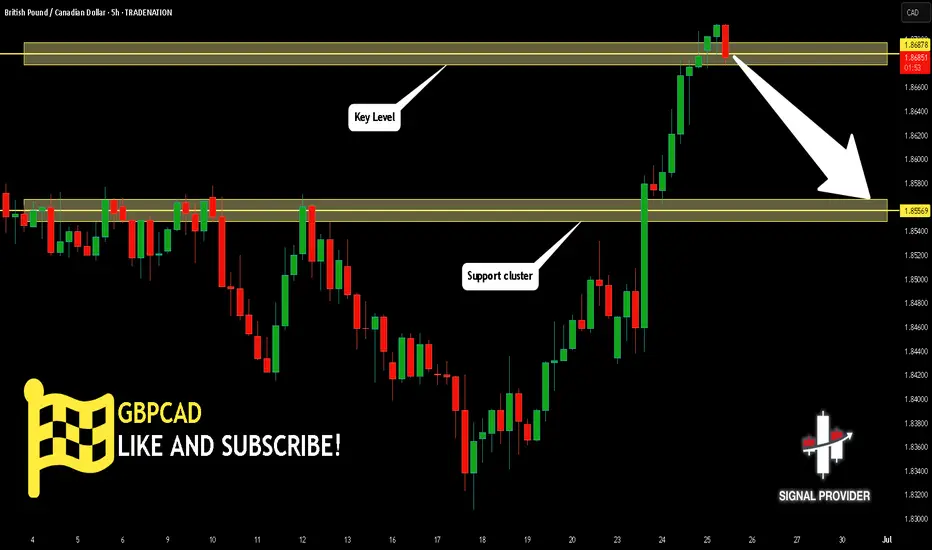
GBPCAD Will Go Down From Resistance! Short!
Please, check our technical outlook for GBPCAD.
Time Frame: 5h
Current Trend: Bearish
Sentiment: Overbought (based on 7-period RSI)
Forecast: Bearish
The price is testing a key resistance 1.868.
Taking into consideration the current market trend & overbought RSI, chances will be high to see a bearish movement to the downside at least to 1.855 level.
P.S
The term oversold refers to a condition where an asset has traded lower in price and has the potential for a price bounce.
Overbought refers to market scenarios where the instrument is traded considerably higher than its fair value. Overvaluation is caused by market sentiments when there is positive news.
Disclosure: I am part of Trade Nation's Influencer program and receive a monthly fee for using their TradingView charts in my analysis.
Like and subscribe and comment my ideas if you enjoy them!
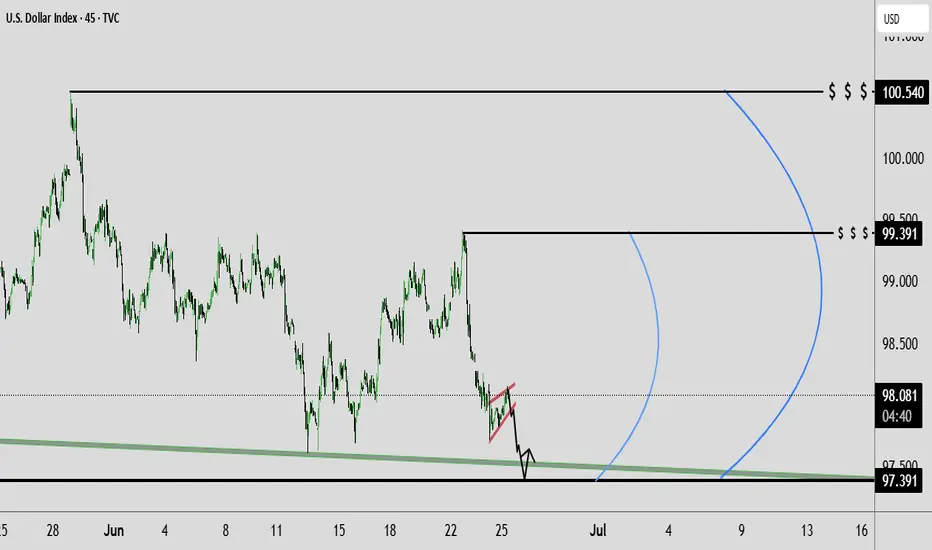
Dollar Index Analysis: Wedge + Powell Outlook – June 25, 2025📉 Technical Outlook: Bearish Rising Wedge + Liquidity Sweep Setup
TVC:DXY The Dollar Index (DXY) is currently trading within a rising wedge pattern, typically a bearish structure. We're anticipating a fake breakdown, potential sweep of the key demand zone, followed by a reversal move targeting key highs.
🔍 Key Technical Zones
📥 Demand Zone (Buy Area):
🔵 97.50 – 97.20 = Institutional accumulation + unfilled orders
🚫 Invalidation Level (Stop-Loss) :
❌ 96.70 = Clean break below confirms full bearish continuation
🎯 Target Projections (Upside Levels) :
TP1: 99.00
TP2: 100.00
TP3: 101.04 (HTF swing high liquidity cleanout)
🧠 Summary Setup :
Downtrend
Rising wedge formation
Sweep of 97.20 possible
Watch for fakeout & reversal play toward 101.04
🏛️ Fundamental Analysis – Powell’s Testimony Insights
Fed Chair Powell highlighted the following during his recent testimony:
🔄 “We’re not there yet on inflation” — Core services remain sticky
🛑 No immediate rate cuts — Growth is slowing but not crashing
🕰 Rate cuts likely postponed to Q4 2025
🔐 “Real rates are restrictive enough” = No more hikes expected
💡 Implication for DXY :
✅ Short-term bullish bias as higher U.S. yields remain attractive if rate cuts are delayed.
🌍 Macro Context Snapshot (as of June 25, 2025)
🇺🇸 US Disinflation: CPI & PCE easing, but not collapsing
🇪🇺 ECB Cut in June: Euro may weaken further
🇯🇵 BOJ Policy Unclear: USD/JPY likely volatile
🌐 Global Risk Appetite High: Volatility may return with geopolitical events
🔥 Watch This: Trade Tariff Narrative Heating Up
🚨 New U.S. Tariff Signals on Chinese tech and EU autos are resurfacing. This could:
Push inflation risk higher
Delay Fed’s easing timeline
Add support to USD short term as markets price in geopolitical tension and uncertainty
📌 Trading Strategy Recap :
Monitor wedge support near 97.20
Look for fakeout/sweep and bullish reversal
Target 99–101 zone on rebound
Stay alert to Powell/Fed rhetoric + tariff news
If you find this analysis helpful, Like, Comment, and Follow for more DXY, gold, and macro trades!
GOLD recovers from 2-week low, short-term neutral biasOANDA:XAUUSD hit a two-week low in yesterday's trading session before recovering, currently trading around $3,330/oz, up slightly by about 0.14% on the day.
The main reason was the ceasefire between Iran and Israel, which curbed demand for safe-haven gold. In addition, Federal Reserve Chairman Powell made hawkish comments, which also affected the gold price trend.
Israel and Iran reach ceasefire agreement
A ceasefire came into effect on Tuesday under pressure from US President Donald Trump, raising optimism that the biggest military conflict between the two arch-rivals in the Middle East may be coming to an end.
The easing of tensions in the Middle East has been a major factor in the pressure on gold. Risk sentiment has weakened and the market has entered risk-on mode.
US President Trump announced on Monday evening that Israel and Iran had reached an agreement on a “complete and total ceasefire”. Iran’s state TV officially announced on Tuesday that Iran had ceased fire with Israel.
Israeli Defense Minister Israel Katz announced earlier Tuesday that the Israeli military would launch a new wave of strikes on targets in Tehran in retaliation for Iran's missile launch and "blatant violation" of the ceasefire.
The Israeli government said that Israel would hold off on further strikes on Iran after Prime Minister Benjamin Netanyahu spoke with US President Trump.
Powell sends important signal
Federal Reserve Chairman Powell will testify before the House Financial Services Committee on Tuesday and deliver a report on the Fed’s monetary policy. Powell will also testify before the Senate Banking Committee today (Wednesday).
In congressional testimony on Tuesday, Powell said the Fed needs more time to see whether tariffs are causing inflation to rise further before considering cutting interest rates.
In congressional testimony, Powell said he and most Fed officials expect inflation to rise soon and that the Fed is in no rush to cut rates before then.
“We are now in a very good position to wait and see what the likely path of the economy is before considering whether to adjust the policy stance,” Powell said.
Markets generally believe that the July 29-30 meeting is unlikely to result in a rate cut, with the first rate cut expected in September.
Technical Outlook Analysis OANDA:XAUUSD
With the current technical position, gold has not yet had a complete short-term trend as the price action is still around the EMA21 moving average, and the RSI is operating around the 50 level.
With the current price action showing that the market is still hesitant, gold may enter a sideways accumulation phase.
However, in terms of the long-term trend, gold is still in a long-term uptrend channel with the case for a complete downtrend to occur is the condition that the price action is taken below the raw price point of 3,300 USD. Then the downside target is the 0.50% Fibonacci retracement level in the short term.
During the day, the trend of gold is neutral with the expected operating range between 3,350 – 3,300 USD.
Notable positions will also be listed as follows.
Support: 3,320 – 3,300 USD
Resistance: 3,350 – 3,371 USD
SELL XAUUSD PRICE 3349 - 3347⚡️
↠↠ Stop Loss 3353
→Take Profit 1 3341
↨
→Take Profit 2 3335
BUY XAUUSD PRICE 3301 - 3303⚡️
↠↠ Stop Loss 3297
→Take Profit 1 3309
↨
→Take Profit 2 3315
Dollar - Short term Bullish again (Mainly Bearish)Looks like Dollar wants to come back into the range we broke down from. I am still bearish dollar but no point getting into longer term "bearish" dollar trades yet

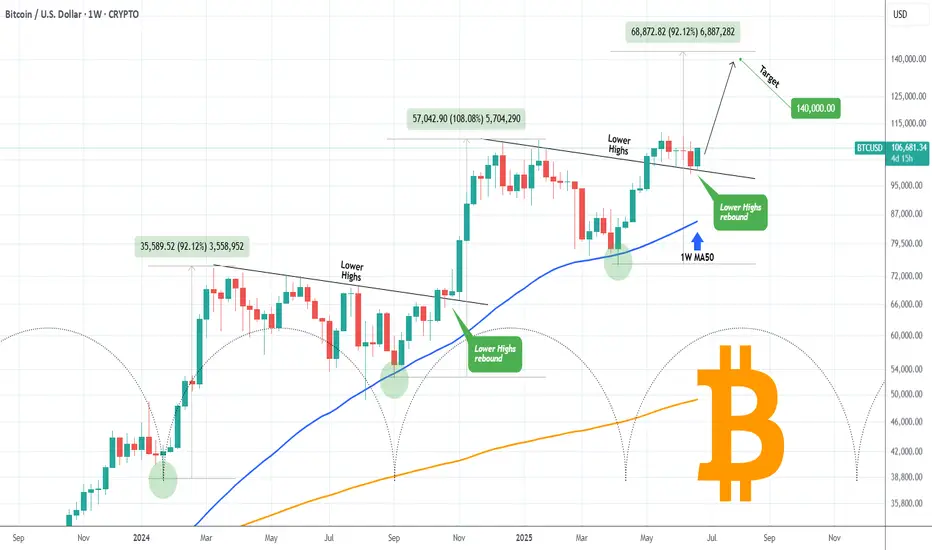
BITCOIN Major Pivot bounce eyes $140000!Bitcoin (BTCUSD) has started off the week with a huge 1W candle bounce on the former Lower Highs trend-line (that started on its All Time High), which has now turned into a Pivot. That trend-line held both last week and 3 weeks ago.
The very same Pivot test took place (October 2024) at the start of the previous Bullish Leg, resulting into a massive rebound that peaked upon a +108.08% rise. That was even higher than the Bullish Leg before it (+92.12%), which also started after a 1.5 month consolidation (Dec 2023 - Jan 2024).
Interestingly enough those Legs show an amazing frequency as the Time Cycles show on their bottoms. Assuming the current Bullish Leg will follow the 'bad case' scenario of +92.12%, we should be expecting to see at least $140000 before the next pull-back/ consolidation.
Do you think such Target is feasible by the end of August? Feel free to let us know in the comments section below!
-------------------------------------------------------------------------------
** Please LIKE 👍, FOLLOW ✅, SHARE 🙌 and COMMENT ✍ if you enjoy this idea! Also share your ideas and charts in the comments section below! This is best way to keep it relevant, support us, keep the content here free and allow the idea to reach as many people as possible. **
-------------------------------------------------------------------------------
💸💸💸💸💸💸
👇 👇 👇 👇 👇 👇
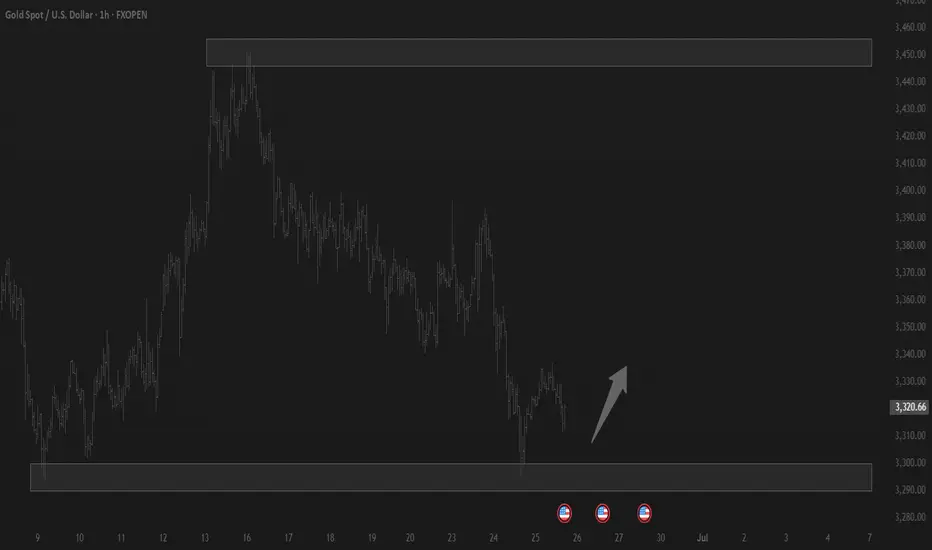
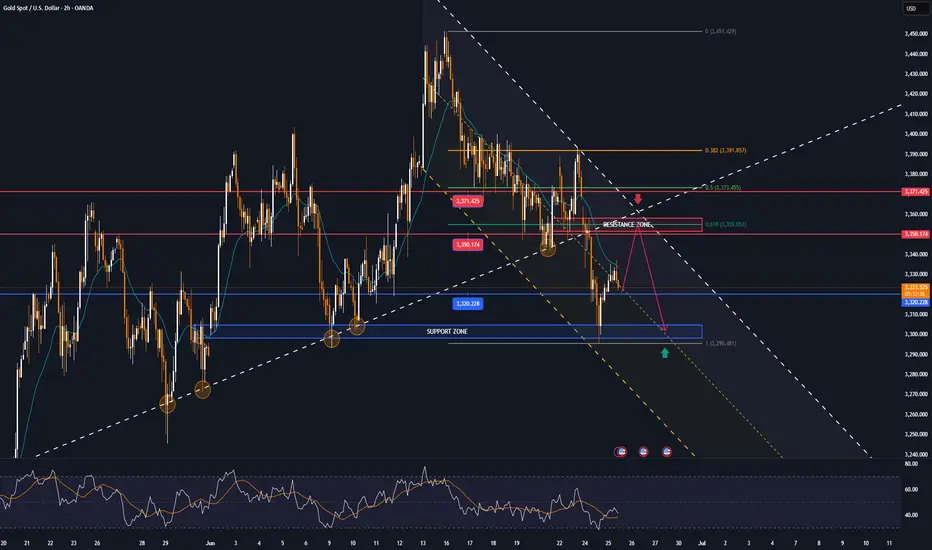
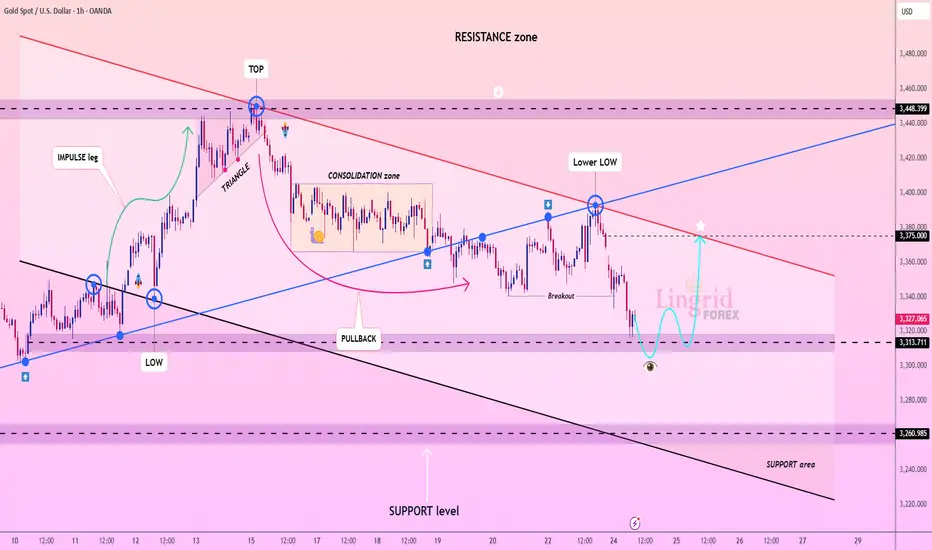
Lingrid | GOLD Retracement Entry Opportunity from Support ZoneOANDA:XAUUSD is attempting to stabilize after breaking below the consolidation zone and forming a new lower low near the 3,313 support. Price action hints at a bullish rebound setup, potentially targeting the 3,375 resistance aligned with the descending red trendline. The structure may shift if price forms a higher low and retests broken support as a springboard.
📈 Key Levels
Buy zone: 3,313 – 3,320
Sell trigger: break below 3,313
Target: 3,375
Buy trigger: higher low and breakout above minor resistance
💡 Risks
Failure to reclaim 3,313 could trigger another sell-off
Resistance trendline near 3,375 remains a rejection risk
Lack of volume confirmation may weaken bullish scenario
If this idea resonates with you or you have your own opinion, traders, hit the comments. I’m excited to read your thoughts!
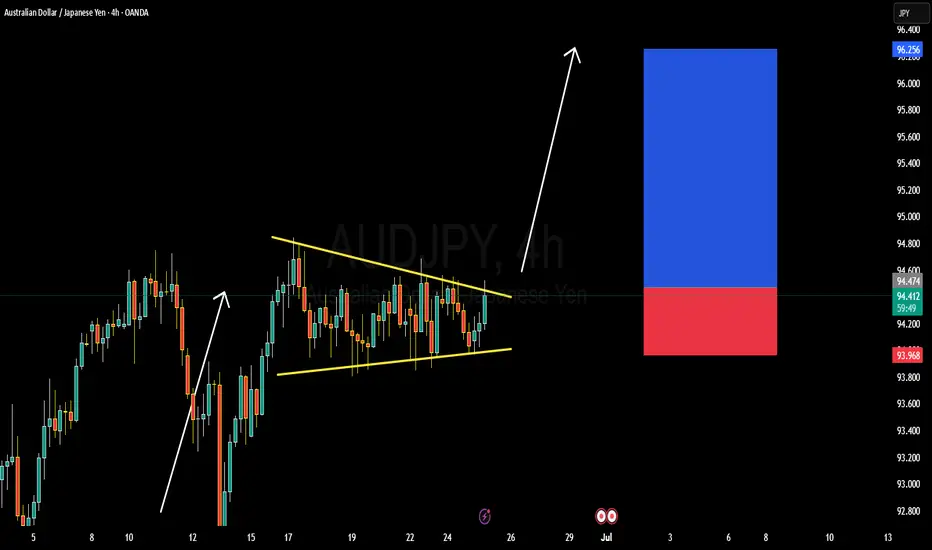
AUDJPY DETAILED ANALYSISAUDJPY has successfully completed a breakout from a bullish pennant structure on the 4H timeframe, signaling the beginning of a strong upward continuation move. After a sustained consolidation below descending resistance, price action has now pierced through the upper trendline with volume and follow-through momentum. The breakout is aligned with the prior bullish leg from mid-June, indicating trend continuation. I’m now targeting 96.500 as the next key price level, with current price holding firm at 94.500.
Fundamentally, the Australian Dollar remains supported by recent hawkish RBA expectations. Traders are now pricing in the possibility of another rate hike following sticky inflation data out of Australia. The latest CPI print showed an annualized rise above 4%, exceeding forecasts, and reinforcing the case for tighter monetary policy. In contrast, the Japanese Yen continues to weaken as the Bank of Japan maintains its dovish tone, with no immediate signs of rate normalization. The ongoing yield divergence continues to fuel bullish flows into AUDJPY.
Today’s market sentiment favors risk-on assets, and AUD typically benefits in such conditions. Global equity strength and higher commodity prices are further backing AUD's upside momentum. Moreover, with carry trade flows increasing as investors seek higher-yielding currencies, AUDJPY is well-positioned to benefit from both fundamental tailwinds and technical breakout confirmation.
This setup is technically clean and fundamentally strong. Pullbacks toward the 94.100–93.900 zone could be retested as new support before the pair extends higher. As long as price holds above the breakout level, I remain bullish with 96.500 as my primary upside target. This pair is offering a high-probability continuation play in alignment with both macro and micro structure.
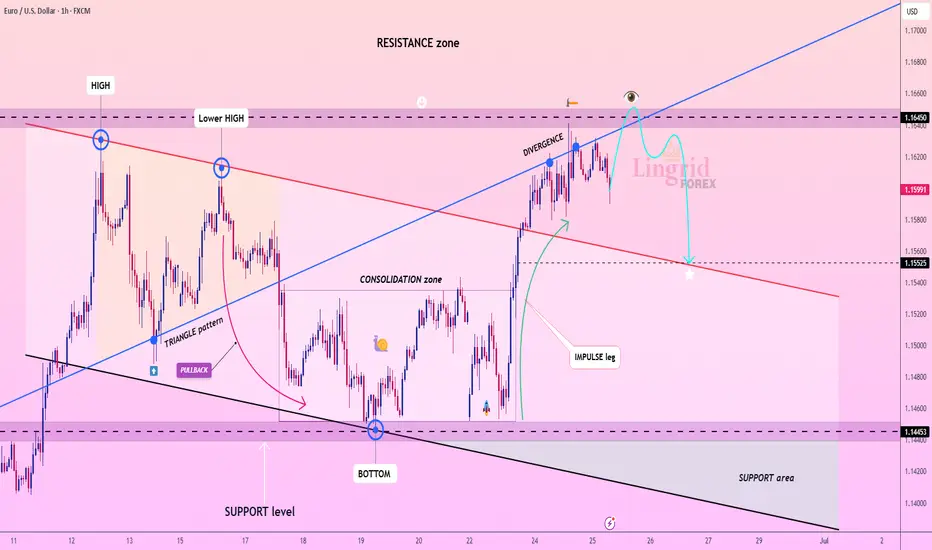
Lingrid | EURUSD Short-Term Correction. Counter Trend SetupThe price perfectly fulfilled my previous idea . FX:EURUSD completed a full impulse move from the bottom, touching the upper resistance line while showing clear bearish divergence at recent highs. Price is now hovering near 1.16450, with early signs of weakness below the ascending blue trendline. A breakdown from this zone could confirm a reversal toward the 1.15585 support and potentially deeper if momentum builds.
📉 Key Levels
Sell zone: 1.1630 – 1.1650
Sell trigger: break below 1.1600
Target: 1.15525
Buy trigger: breakout and hold above 1.1650
⚠️ Risks
Divergence may take time to fully play out
Reclaiming 1.1650 would negate bearish setup
Consolidation near highs may trap early sellers
If this idea resonates with you or you have your own opinion, traders, hit the comments. I’m excited to read your thoughts!