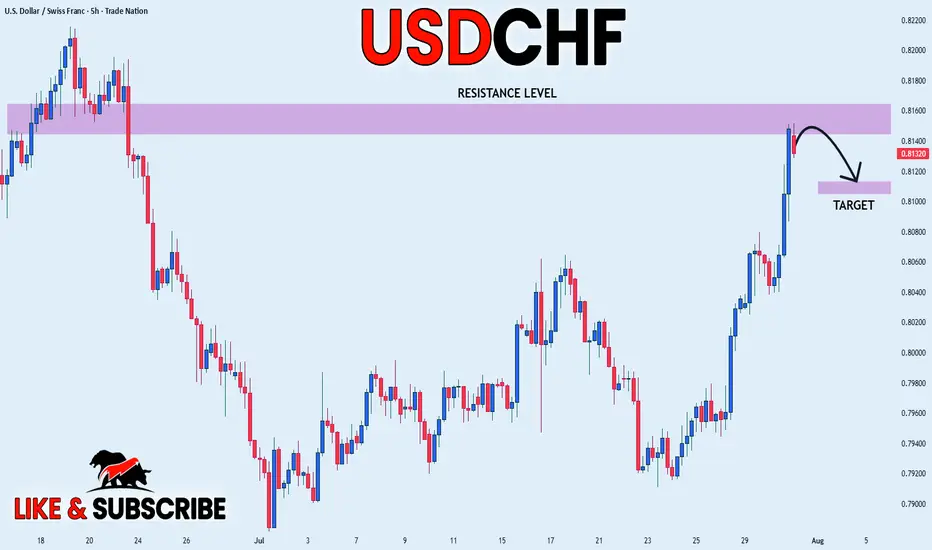
USD_CHF LOCAL SHORT|
✅USD_CHF price went up sharply
But a strong resistance level was hit at 0.8152
Thus, as a pullback is already happening
And a move down towards the
Target of 0.8113 shall follow
SHORT🔥
✅Like and subscribe to never miss a new idea!✅
Disclosure: I am part of Trade Nation's Influencer program and receive a monthly fee for using their TradingView charts in my analysis.
Signals
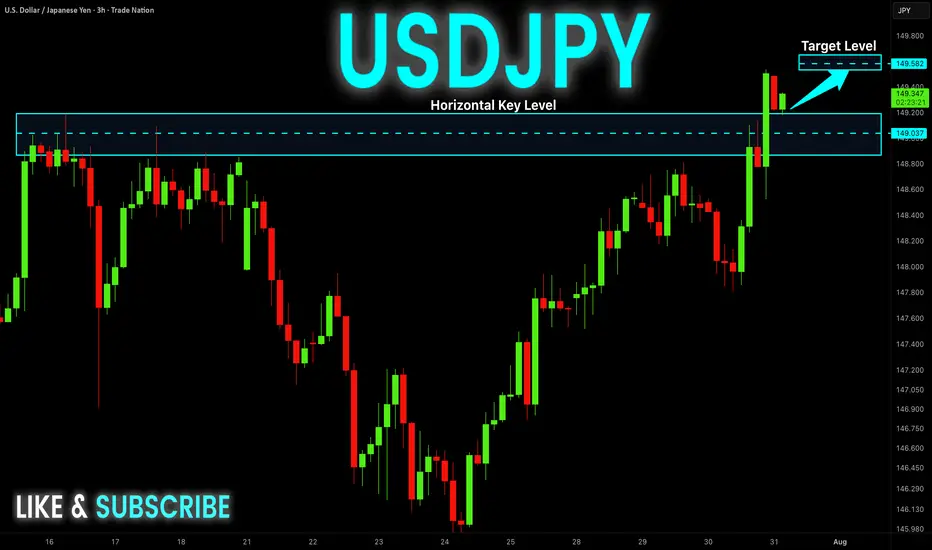
USD-JPY Will Keep Growing! Buy!
Hello,Traders!
USD-JPY keep growing and
The pair made a bullish breakout
Of the key horizontal level
Of 149.181 and the pair is
Already retesting the new
Support and we will be
Expecting a further
Bullish move up
Sell!
Comment and subscribe to help us grow!
Check out other forecasts below too!
Disclosure: I am part of Trade Nation's Influencer program and receive a monthly fee for using their TradingView charts in my analysis.
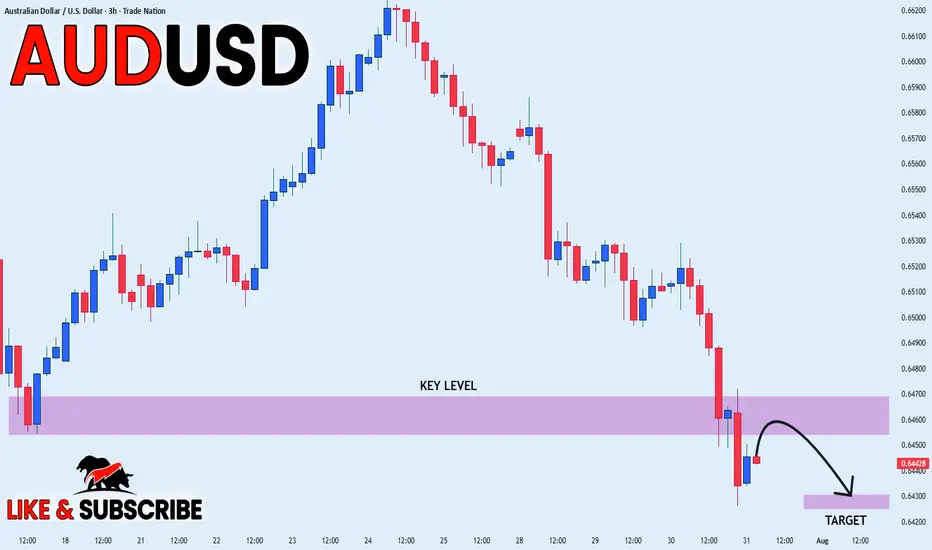
AUD_USD BEARISH BREAKOUT|SHORT|
✅AUD_USD broke the key
Structure level of 0.6460
While trading in an local downtrend
Which makes me bearish
And I think that after the retest of
The broken level is complete
A bearish continuation will follow
SHORT🔥
✅Like and subscribe to never miss a new idea!✅
Disclosure: I am part of Trade Nation's Influencer program and receive a monthly fee for using their TradingView charts in my analysis.
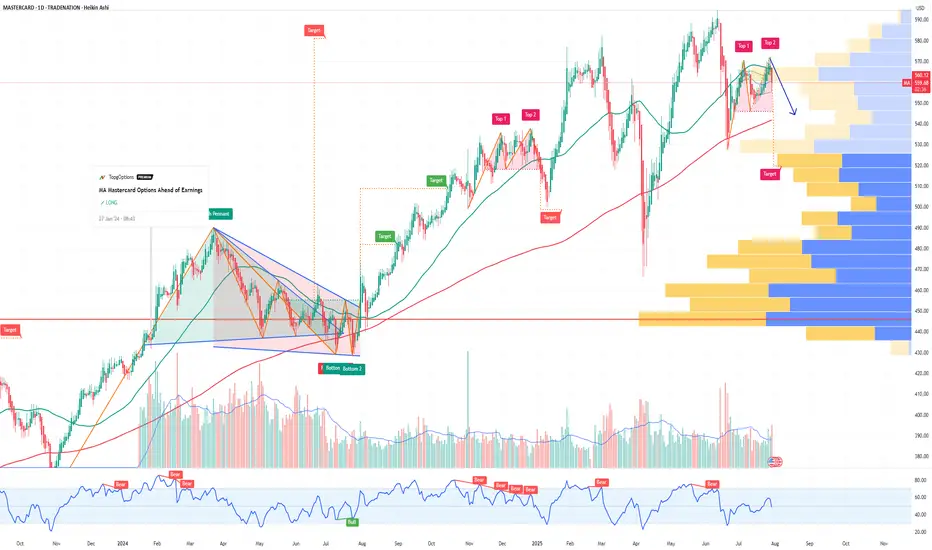
MA Mastercard Incorporated Options Ahead of EarningsIf you haven`t bought MA before the rally:
Now analyzing the options chain and the chart patterns of MA Mastercard Incorporated prior to the earnings report this week,
I would consider purchasing the 545usd strike price Puts with
an expiration date of 2025-8-8,
for a premium of approximately $4.45.
If these options prove to be profitable prior to the earnings release, I would sell at least half of them.
Disclosure: I am part of Trade Nation's Influencer program and receive a monthly fee for using their TradingView charts in my analysis.
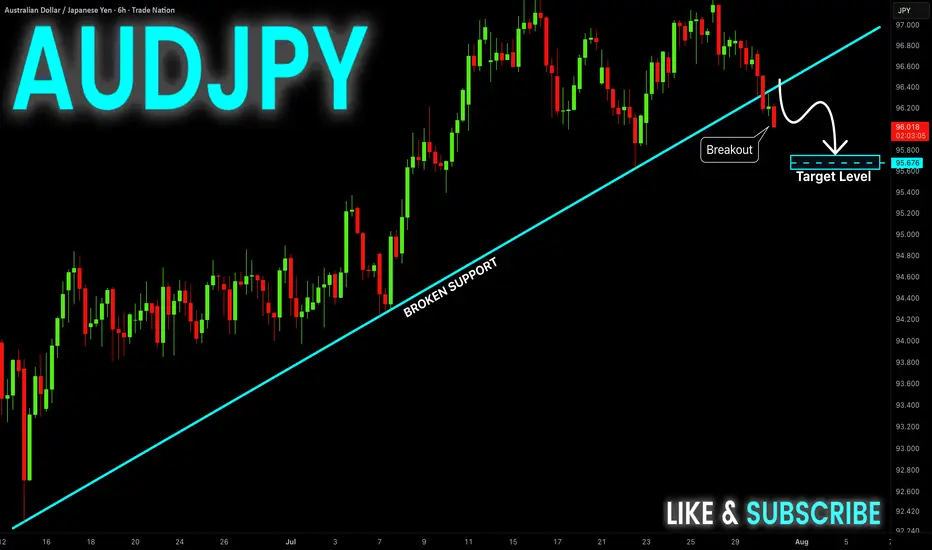
AUD-JPY Bearish Breakout! Sell!
Hello,Traders!
AUD-JPY made a bearish
Breakout of the rising support
Line and we are bearish biased
So we will be expecting a
Further bearish move down
Sell!
Comment and subscribe to help us grow!
Check out other forecasts below too!
Disclosure: I am part of Trade Nation's Influencer program and receive a monthly fee for using their TradingView charts in my analysis.
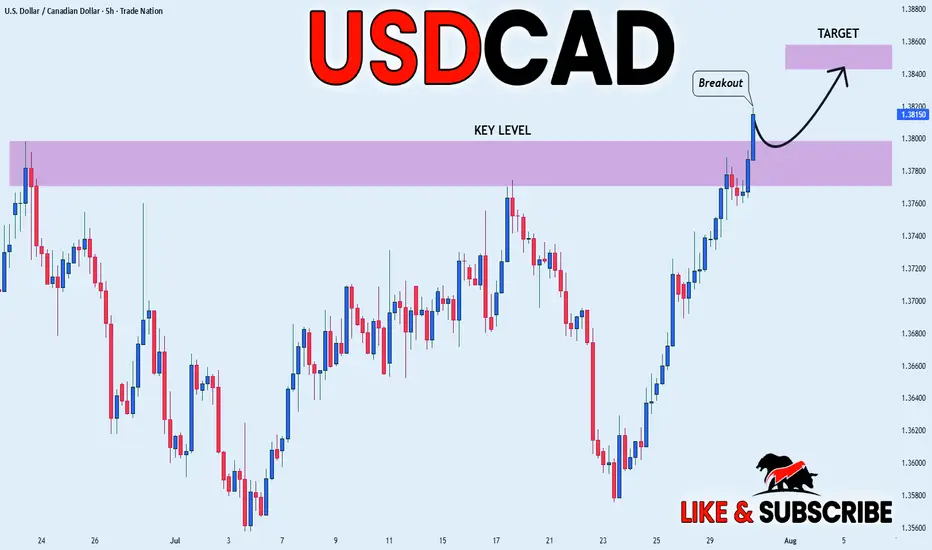
USD_CAD BULLISH BREAKOUT|LONG|
✅USD_CAD is going up
Now and the pair made a bullish
Breakout of the key horizontal
Level of 1.3800 and the breakout
Is confirmed so we are bullish
Biased and we will be expecting
A further bullish move up
LONG🚀
✅Like and subscribe to never miss a new idea!✅
Disclosure: I am part of Trade Nation's Influencer program and receive a monthly fee for using their TradingView charts in my analysis.
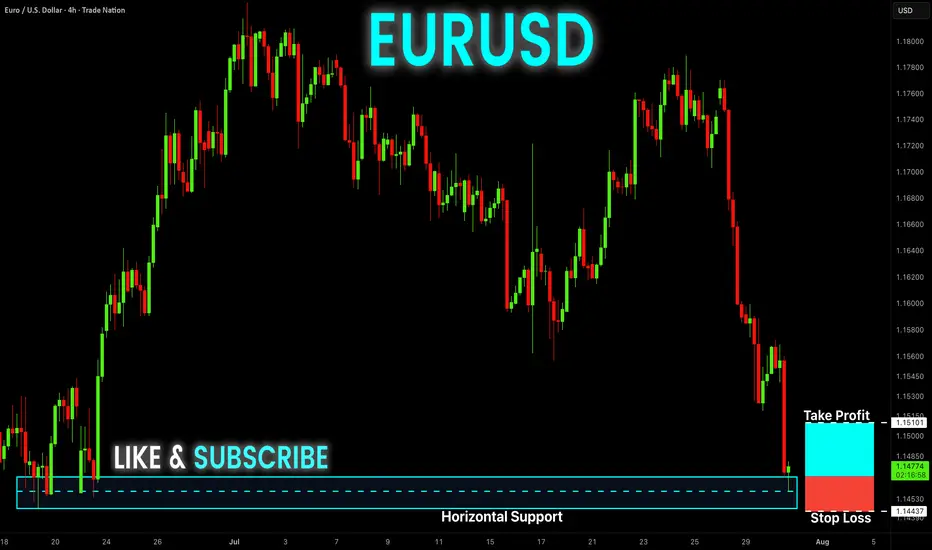
EUR-USD Free Signal! Buy!
Hello,Traders!
EUR-USD keeps falling and
The pair is locally oversold so
As the pair is retesting the
Horizontal support level
Of 1.1468 we can enter a
Long trade with Take Profit
Of 1.1510 and Stop Loss
Of 1.1443
Buy!
Comment and subscribe to help us grow!
Check out other forecasts below too!
Disclosure: I am part of Trade Nation's Influencer program and receive a monthly fee for using their TradingView charts in my analysis.
DXY: Bulls Are Winning! Long!
My dear friends,
Today we will analyse DXY together☺️
The in-trend continuation seems likely as the current long-term trend appears to be strong, and price is holding above a key level of 98.471 So a bullish continuation seems plausible, targeting the next high. We should enter on confirmation, and place a stop-loss beyond the recent swing level.
❤️Sending you lots of Love and Hugs❤️

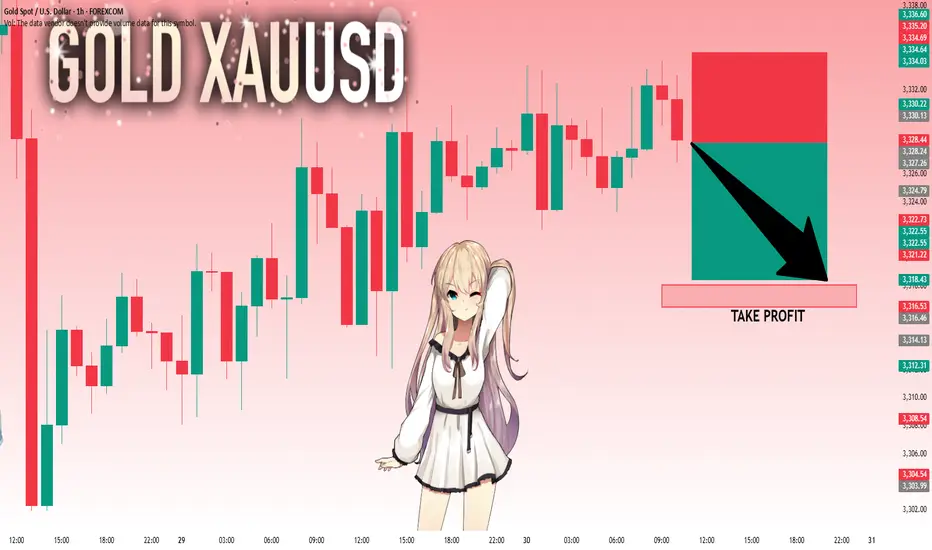
GOLD: Next Move Is Down! Short!
My dear friends,
Today we will analyse GOLD together☺️
The market is at an inflection zone and price has now reached an area around 3,328.24 where previous reversals or breakouts have occurred.And a price reaction that we are seeing on multiple timeframes here could signal the next move down so we can enter on confirmation, and target the next key level of 3,318.05..Stop-loss is recommended beyond the inflection zone.
❤️Sending you lots of Love and Hugs❤️
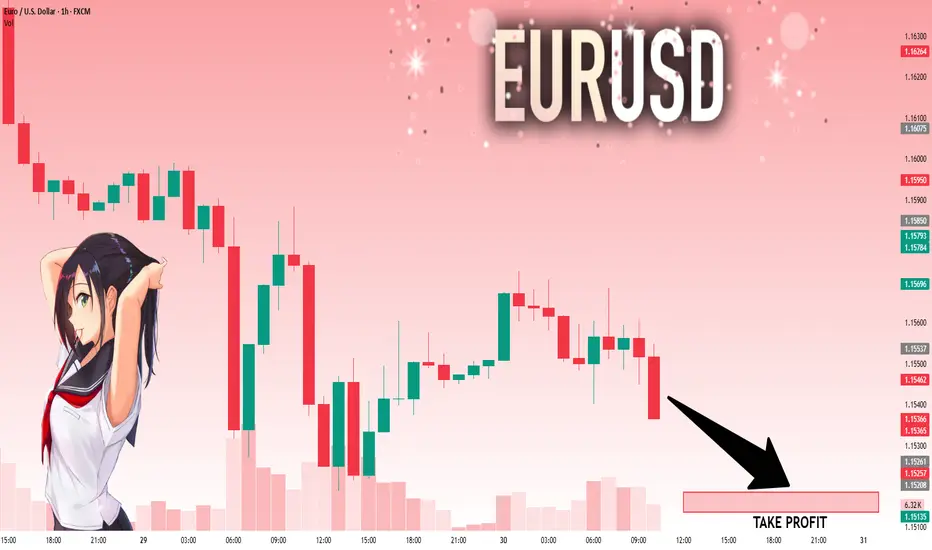
EURUSD: Target Is Down! Short!
My dear friends,
Today we will analyse EURUSD together☺️
The price is near a wide key level
and the pair is approaching a significant decision level of 1.15428 Therefore, a strong bearish reaction here could determine the next move down.We will watch for a confirmation candle, and then target the next key level of 115186..Recommend Stop-loss is beyond the current level.
❤️Sending you lots of Love and Hugs❤️
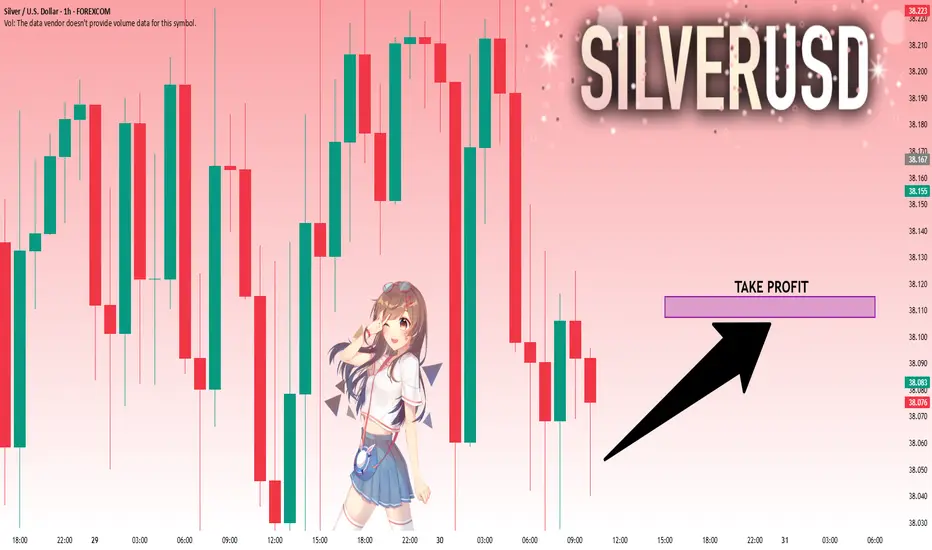
SILVER: Move Up Expected! Long!
My dear friends,
Today we will analyse SILVER together☺️
The recent price action suggests a shift in mid-term momentum. A break above the current local range around 38.054 will confirm the new direction upwards with the target being the next key level of 38.107 and a reconvened placement of a stop-loss beyond the range.
❤️Sending you lots of Love and Hugs❤️
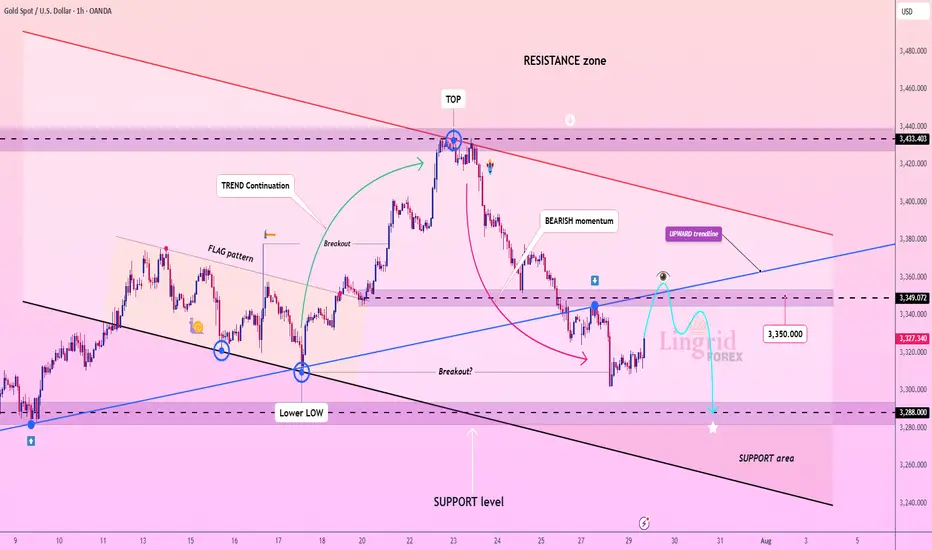
Lingrid | GOLD shorting Opportunity at Confluence ZoneThe price perfectly fulfilled my previous idea . OANDA:XAUUSD broke down sharply after forming a local top at the 3433 resistance zone, with clear bearish momentum dominating recent candles. Price is now consolidating below the broken trendline and previous structure at 3349, setting up for a possible retest and rejection. If price confirms rejection under this resistance, continuation toward the 3288 support area becomes highly likely. A lower high formation below the blue upward trendline would validate the bearish thesis.
📉 Key Levels
Sell trigger: Rejection near 3349–3350
Sell zone: 3345–3355
Target: 3288
Invalidation: Break above 3355 and trendline recovery
💡 Risks
Sudden bullish breakout could reclaim upward trendline
Support near 3288 may create a rebound
Thin liquidity could exaggerate short-term wicks
If this idea resonates with you or you have your own opinion, traders, hit the comments. I’m excited to read your thoughts!
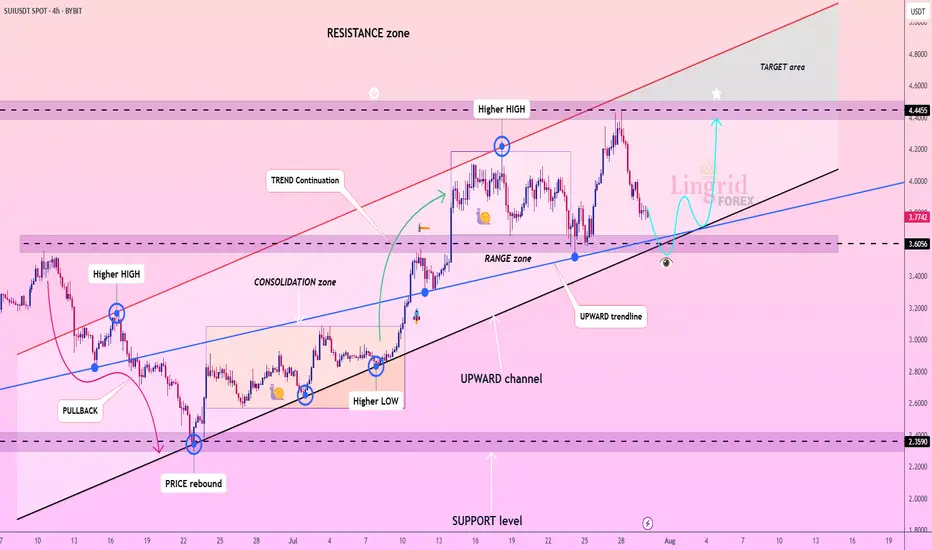
Lingrid | SUIUSDT Approaching Key Level for Potential LongBINANCE:SUIUSDT has pulled back from the 4.44 resistance but remains within a well-defined upward channel, holding above the 3.60 support zone. The structure shows higher lows with price hovering around the blue upward trendline, indicating ongoing bullish momentum. As long as 3.60 holds, buyers may regain control and push price back toward the 4.44 resistance and beyond. Momentum favors continuation as the consolidation phase near support suggests accumulation.
📉 Key Levels
Buy trigger: Break and close above 3.85
Buy zone: 3.60–3.70
Target: 4.44
Invalidation: Drop below 3.26
💡 Risks
Failure to hold above 3.26 could trigger deeper pullback.
Resistance near 4.44 may cause rejection.
Low market volume could delay breakout attempts.
If this idea resonates with you or you have your own opinion, traders, hit the comments. I’m excited to read your thoughts!
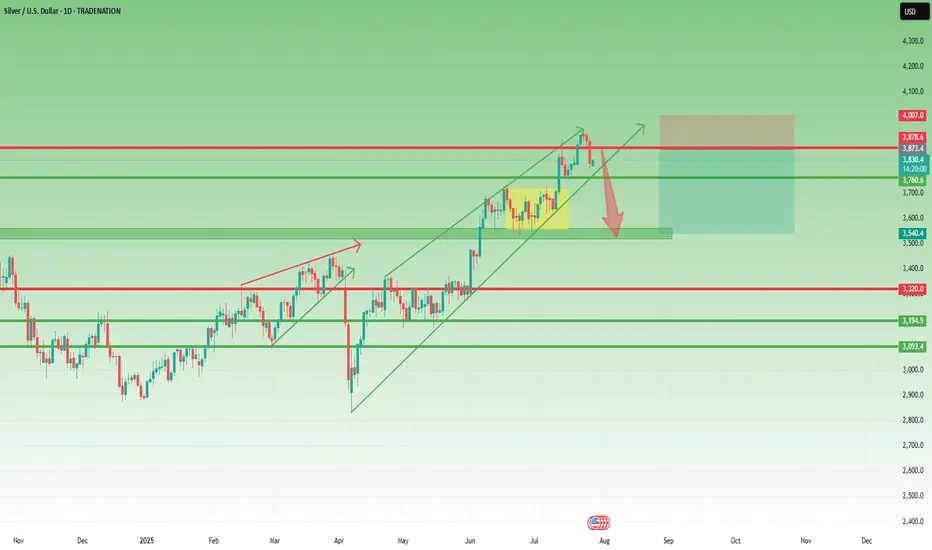
XAGUSD – Reversal Signs After the Run Toward $40Lately, I’ve been a strong advocate for a Silver rally toward $40, and indeed, we got a solid move, with price reaching as high as $39.50, not touching 40 though...
Just like with Gold, the last 3 days of last week turned bearish, and now it looks like we may be entering the early stage of a correction.
📉 Current Setup:
- The rejection from $39.50, right below the psychological $40 level, is significant
- I’ll be monitoring for a possible short entry if we get a rebound into the $38.80–$39.00 zone
- A new high above $39.50 would invalidate this setup
📌 On the downside, if price breaks below the confluence support at $37.70–$38.00, that would confirm the reversal and could lead to an acceleration toward $35.50 support
Conclusion:
The bullish narrative on Silver is pausing here. Until a new high is made, I’m looking to sell the bounce and follow the momentum if the breakdown under support is confirmed.
Let’s see how this plays out this week. 🧭
Disclosure: I am part of TradeNation's Influencer program and receive a monthly fee for using their TradingView charts in my analyses and educational articles.
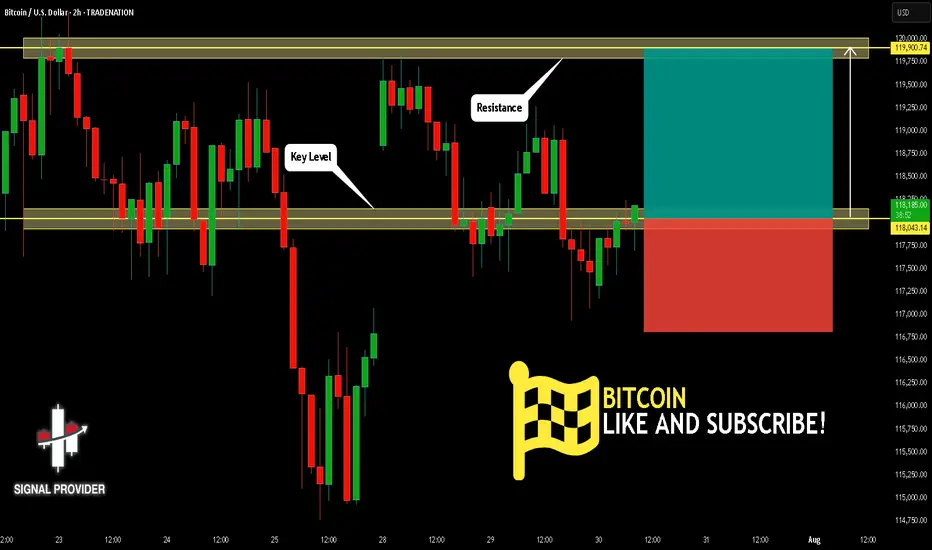
BITCOIN Will Move Higher! Long!
Take a look at our analysis for BITCOIN.
Time Frame: 2h
Current Trend: Bullish
Sentiment: Oversold (based on 7-period RSI)
Forecast: Bullish
The price is testing a key support 118,043.14.
Current market trend & oversold RSI makes me think that buyers will push the price. I will anticipate a bullish movement at least to 119,900.74 level.
P.S
The term oversold refers to a condition where an asset has traded lower in price and has the potential for a price bounce.
Overbought refers to market scenarios where the instrument is traded considerably higher than its fair value. Overvaluation is caused by market sentiments when there is positive news.
Disclosure: I am part of Trade Nation's Influencer program and receive a monthly fee for using their TradingView charts in my analysis.
Like and subscribe and comment my ideas if you enjoy them!
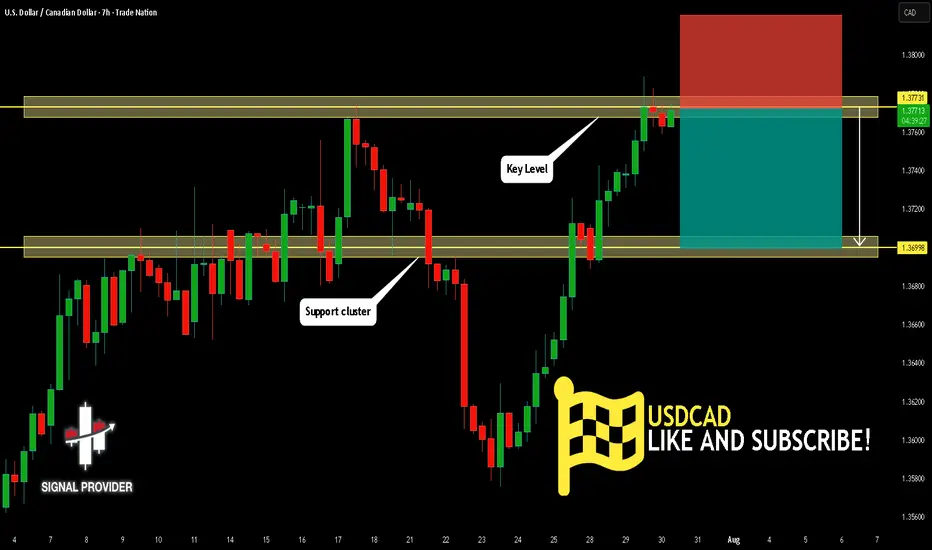
USDCAD Is Bearish! Sell!
Please, check our technical outlook for USDCAD.
Time Frame: 7h
Current Trend: Bearish
Sentiment: Overbought (based on 7-period RSI)
Forecast: Bearish
The market is trading around a solid horizontal structure 1.377.
The above observations make me that the market will inevitably achieve 1.369 level.
P.S
We determine oversold/overbought condition with RSI indicator.
When it drops below 30 - the market is considered to be oversold.
When it bounces above 70 - the market is considered to be overbought.
Disclosure: I am part of Trade Nation's Influencer program and receive a monthly fee for using their TradingView charts in my analysis.
Like and subscribe and comment my ideas if you enjoy them!
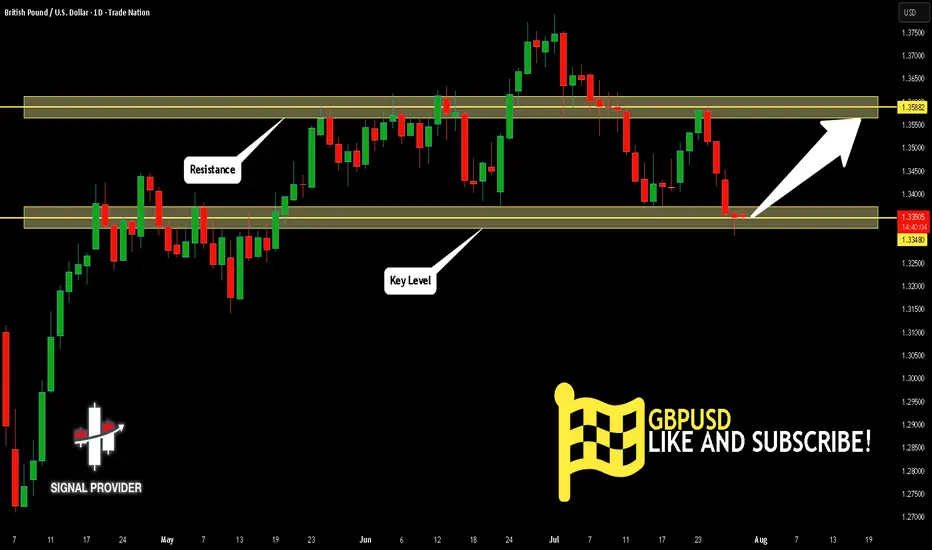
GBPUSD Is Very Bullish! Buy!
Here is our detailed technical review for GBPUSD.
Time Frame: 1D
Current Trend: Bullish
Sentiment: Oversold (based on 7-period RSI)
Forecast: Bullish
The market is testing a major horizontal structure 1.334.
Taking into consideration the structure & trend analysis, I believe that the market will reach 1.358 level soon.
P.S
Overbought describes a period of time where there has been a significant and consistent upward move in price over a period of time without much pullback.
Disclosure: I am part of Trade Nation's Influencer program and receive a monthly fee for using their TradingView charts in my analysis.
Like and subscribe and comment my ideas if you enjoy them!
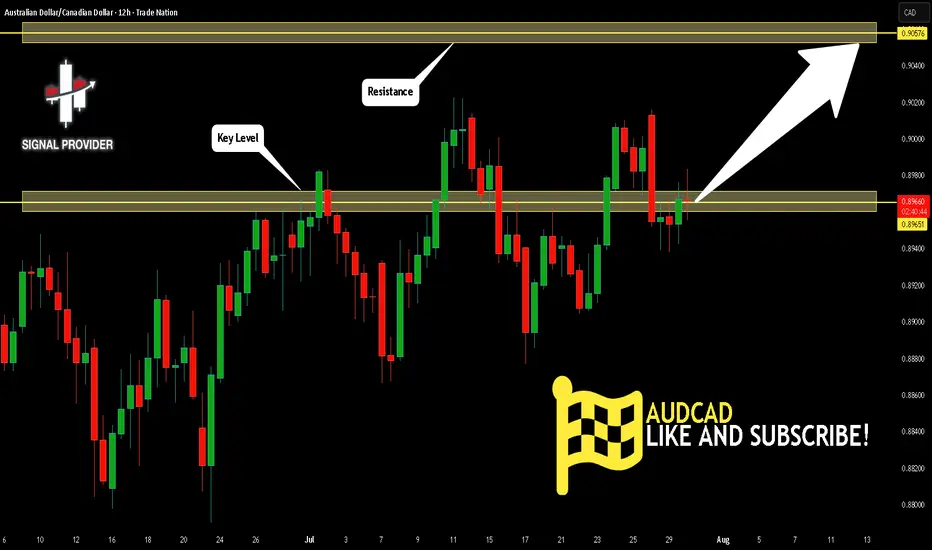
AUDCAD Is Going Up! Long!
Take a look at our analysis for AUDCAD.
Time Frame: 12h
Current Trend: Bullish
Sentiment: Oversold (based on 7-period RSI)
Forecast: Bullish
The market is approaching a key horizontal level 0.896.
Considering the today's price action, probabilities will be high to see a movement to 0.905.
P.S
Please, note that an oversold/overbought condition can last for a long time, and therefore being oversold/overbought doesn't mean a price rally will come soon, or at all.
Disclosure: I am part of Trade Nation's Influencer program and receive a monthly fee for using their TradingView charts in my analysis.
Like and subscribe and comment my ideas if you enjoy them!
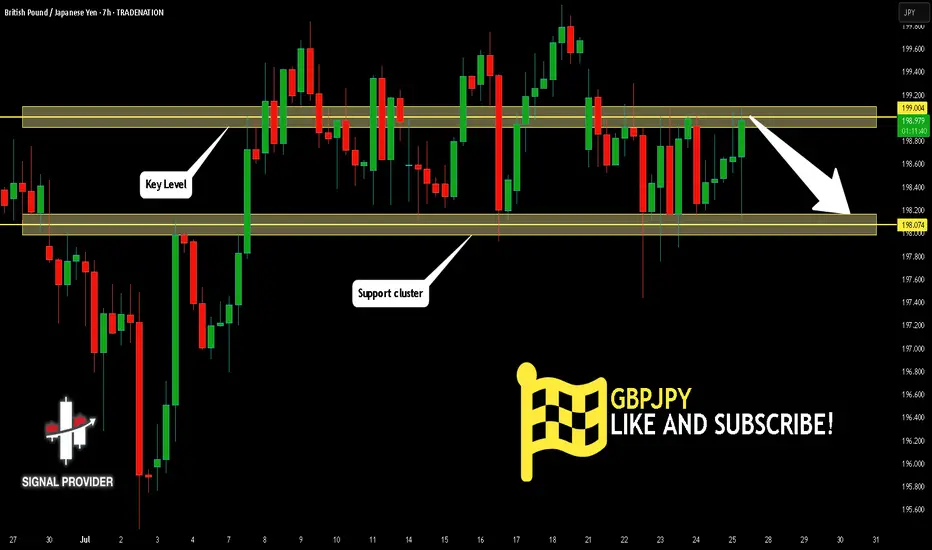
GBPJPY Is Very Bearish! Sell!
Please, check our technical outlook for GBPJPY.
Time Frame: 7h
Current Trend: Bearish
Sentiment: Overbought (based on 7-period RSI)
Forecast: Bearish
The market is trading around a solid horizontal structure 199.004.
The above observations make me that the market will inevitably achieve 198.074 level.
P.S
Please, note that an oversold/overbought condition can last for a long time, and therefore being oversold/overbought doesn't mean a price rally will come soon, or at all.
Disclosure: I am part of Trade Nation's Influencer program and receive a monthly fee for using their TradingView charts in my analysis.
Like and subscribe and comment my ideas if you enjoy them!
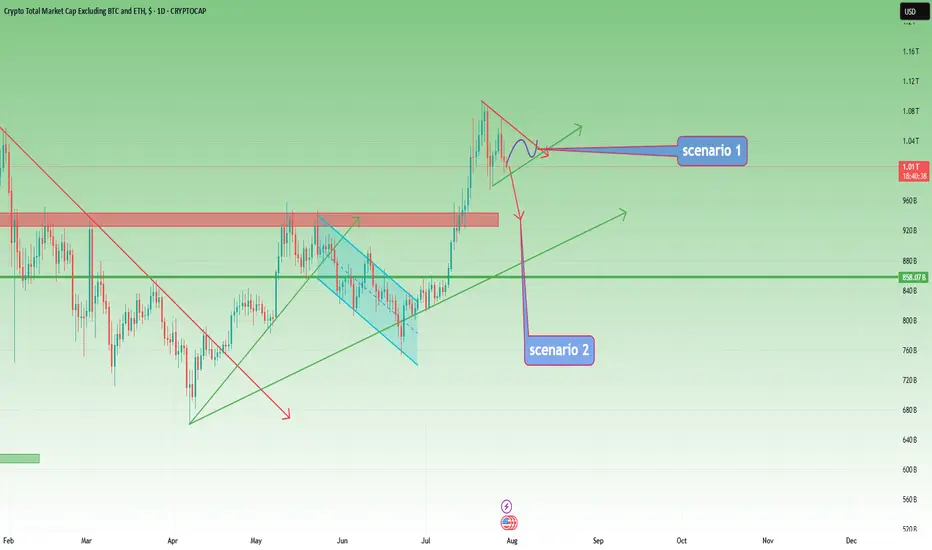
TOTAL3 – Still Bullish, But Waiting for Clarity
In my previous analysis on TOTAL3, I mentioned the high probability of a correction, but also noted that I didn’t expect the 925–940B zone to be reached.
And indeed, price reversed early — finding support around 975B before moving higher.
However, after a push up to 1.07T, the market has started to pull back again.
📊 Current Outlook – Two Scenarios I’m Watching:
Bullish Triangle:
Price may continue to consolidate into a symmetrical triangle, then resume the uptrend from there.
Deeper Pullback into Support:
The market could retest the 925–940B zone, a key support area, before bouncing back up.
⚠️ Bearish Reassessment?
Of course, if price breaks back below 925B and stays there, we’ll have to reconsider the bullish case.
But for now, the trend remains intact, and there’s no technical reason to panic.
📌 My Plan:
I already hold a bag of alts, and I’m not adding for now.
I’ll wait until the pattern becomes clearer — whether it’s a triangle breakout or a dip into support.
Until then, I’m sitting comfortably on what I already hold.
JPY at Key Zone – EURJPY & GBPJPY Could Drop 1k+ PipsExactly one year ago, the JPY Currency Index broke above the falling trendline of a falling wedge, signaling the end of a bearish cycle that had lasted nearly five years.
As is typical after long-term reversals, the reaction was sharp and fast, and the price quickly reached the first resistance target of the pattern.
Since then, the index entered a lateral phase, with clear support forming around the 730 zone.
________________________________________
🔍 Current Price Action
Recently, the price pulled back to test that same support, and at the time of writing it sits at 737, forming a tight consolidation.
This suggests we’re again at an inflection point.
________________________________________
📊 Trade Outlook
From a medium-term perspective, I believe the index is preparing for another leg higher, potentially toward resistance at 780.
➡️ That would mean a 7% rise on the JPY Index – and this move could translate into more than 1,000 pips of downside for pairs like EURJPY and GBPJPY.
________________________________________
🔄 What’s Next?
In the coming sessions, I’ll focus on these two pairs as they offer the clearest setups and have the strongest volatility.
Stay tuned — follow for the next updates. 🚀

XAUUSD – Weak Rebound, Bearish Bias RemainsYesterday was a quiet and choppy day for Gold.
Although price managed to recover a small portion of last week’s 1400 pip drop, the rebound remains anemic — price barely reached the 23% Fibonacci retracement.
To make things worse for the bulls, the recovery from around $3300 is starting to take the shape of a bearish flag, a continuation pattern that typically signals further downside ahead.
📌 Resistance Zones to Watch:
- Initial resistance: $3345–3350
- Stronger resistance: $3370, a level already proven and well-defined
As long as the price is under those levels, I remain firmly bearish.
📈 Trading Plan:
I already have a short position open, and I'm still waiting to add more, preferably on a push into higher resistance, ideally above $3345.
No need to force entries — I’d rather scale in on strength, not weakness.
Once the correction is complete, I’m targeting:
- $3280 as the first support
- $3250 as a realistic downside objective
Conclusion:
The rebound lacks power. The structure favors the bears.
Still watching for better entries to add short, with eyes on 3280 and 3250 as likely targets.
Let’s stay patient and let the setup come to us. 🎯
Disclosure: I am part of TradeNation's Influencer program and receive a monthly fee for using their TradingView charts in my analyses and educational articles.

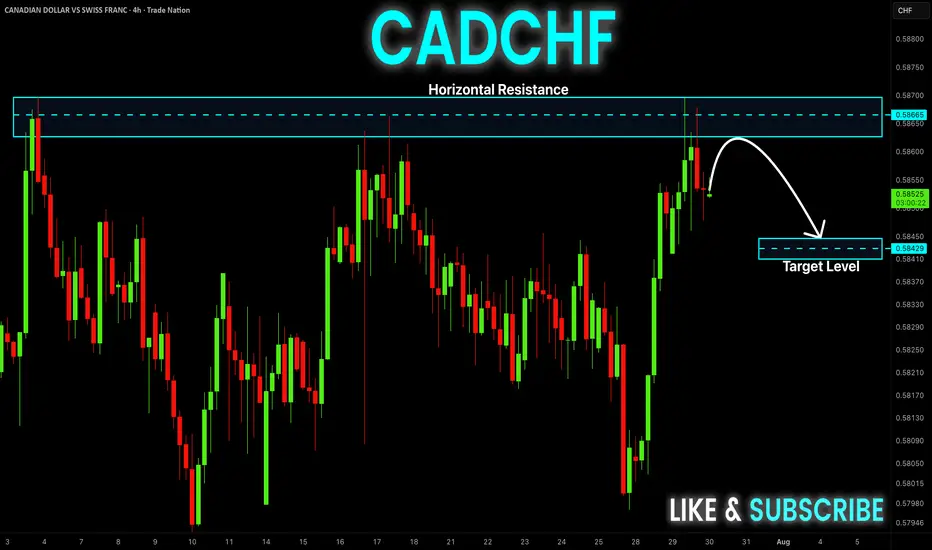
CAD-CHF Local Short! Sell!
Hello,Traders!
CAD-CHF went up and
Made a retest of the
Horizontal resistance
Around 0.5870 and we
Are already seeing a bearish
Pullback so we will be
Expecting a further
Bearish correction
Sell!
Comment and subscribe to help us grow!
Check out other forecasts below too!
Disclosure: I am part of Trade Nation's Influencer program and receive a monthly fee for using their TradingView charts in my analysis.