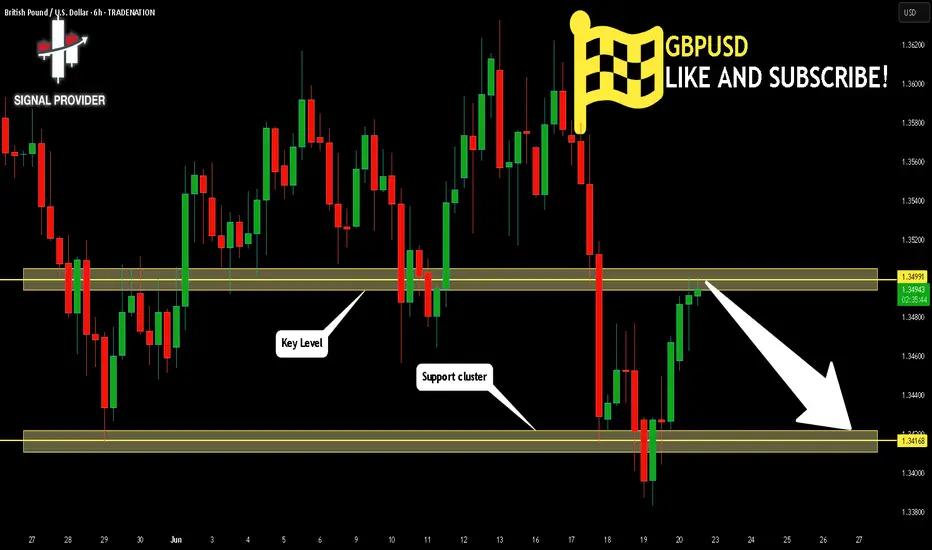
GBPUSD Will Fall! Sell!
Here is our detailed technical review for GBPUSD.
Time Frame: 6h
Current Trend: Bearish
Sentiment: Overbought (based on 7-period RSI)
Forecast: Bearish
The market is approaching a significant resistance area 1.349.
Due to the fact that we see a positive bearish reaction from the underlined area, I strongly believe that sellers will manage to push the price all the way down to 1.341 level.
P.S
The term oversold refers to a condition where an asset has traded lower in price and has the potential for a price bounce.
Overbought refers to market scenarios where the instrument is traded considerably higher than its fair value. Overvaluation is caused by market sentiments when there is positive news.
Disclosure: I am part of Trade Nation's Influencer program and receive a monthly fee for using their TradingView charts in my analysis.
Like and subscribe and comment my ideas if you enjoy them!
Signals
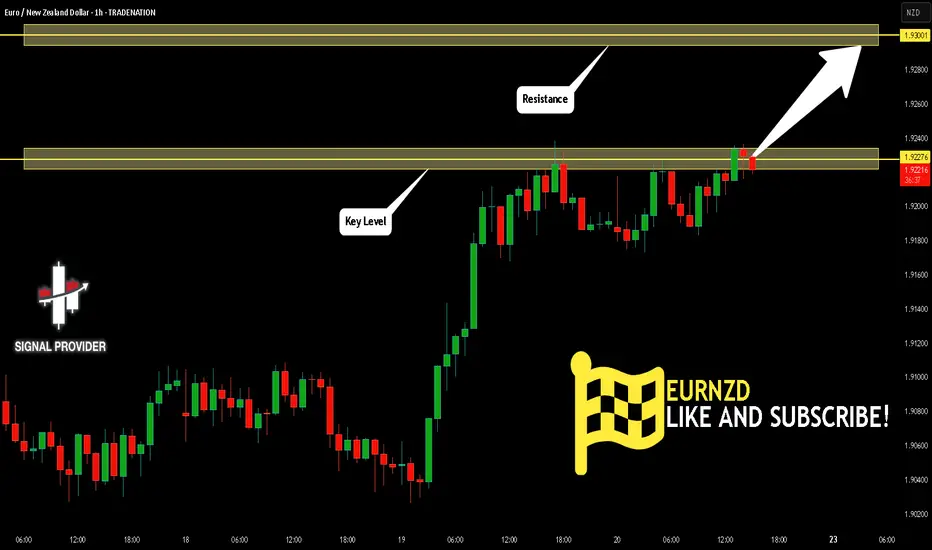
EURNZD Will Go Higher From Support! Buy!
Take a look at our analysis for EURNZD.
Time Frame: 1h
Current Trend: Bullish
Sentiment: Oversold (based on 7-period RSI)
Forecast: Bullish
The market is on a crucial zone of demand 1.922.
The oversold market condition in a combination with key structure gives us a relatively strong bullish signal with goal 1.930 level.
P.S
We determine oversold/overbought condition with RSI indicator.
When it drops below 30 - the market is considered to be oversold.
When it bounces above 70 - the market is considered to be overbought.
Disclosure: I am part of Trade Nation's Influencer program and receive a monthly fee for using their TradingView charts in my analysis.
Like and subscribe and comment my ideas if you enjoy them!
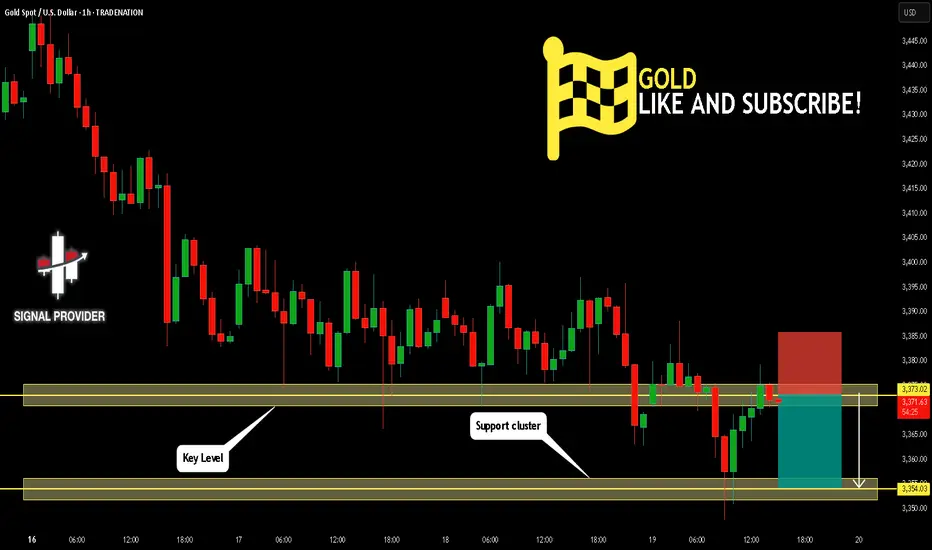
GOLD Will Go Down From Resistance! Short!
Please, check our technical outlook for GOLD.
Time Frame: 1h
Current Trend: Bearish
Sentiment: Overbought (based on 7-period RSI)
Forecast: Bearish
The price is testing a key resistance 3,373.02.
Taking into consideration the current market trend & overbought RSI, chances will be high to see a bearish movement to the downside at least to 3,354.03 level.
P.S
Overbought describes a period of time where there has been a significant and consistent upward move in price over a period of time without much pullback.
Disclosure: I am part of Trade Nation's Influencer program and receive a monthly fee for using their TradingView charts in my analysis.
Like and subscribe and comment my ideas if you enjoy them!
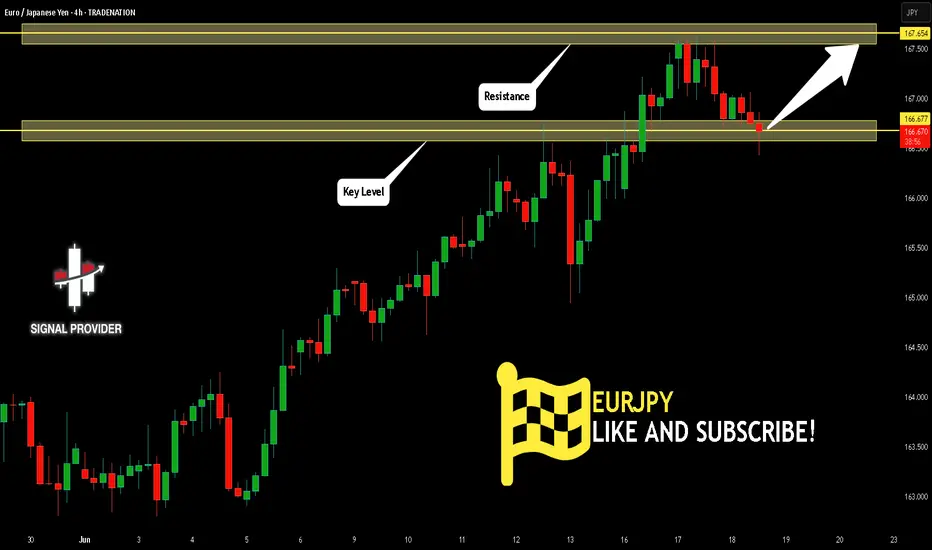
EURJPY Is Going Up! Long!
Please, check our technical outlook for EURJPY.
Time Frame: 4h
Current Trend: Bullish
Sentiment: Oversold (based on 7-period RSI)
Forecast: Bullish
The price is testing a key support 166.677.
Current market trend & oversold RSI makes me think that buyers will push the price. I will anticipate a bullish movement at least to 167.654 level.
P.S
The term oversold refers to a condition where an asset has traded lower in price and has the potential for a price bounce.
Overbought refers to market scenarios where the instrument is traded considerably higher than its fair value. Overvaluation is caused by market sentiments when there is positive news.
Disclosure: I am part of Trade Nation's Influencer program and receive a monthly fee for using their TradingView charts in my analysis.
Like and subscribe and comment my ideas if you enjoy them!
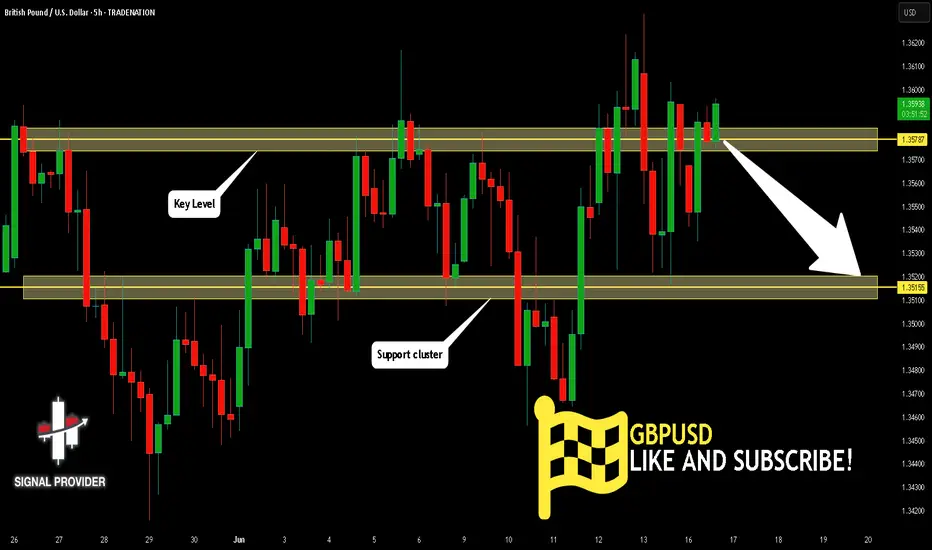
GBPUSD Is Very Bearish! Sell!
Take a look at our analysis for GBPUSD.
Time Frame: 5h
Current Trend: Bearish
Sentiment: Overbought (based on 7-period RSI)
Forecast: Bearish
The market is testing a major horizontal structure 1.357.
Taking into consideration the structure & trend analysis, I believe that the market will reach 1.351 level soon.
P.S
The term oversold refers to a condition where an asset has traded lower in price and has the potential for a price bounce.
Overbought refers to market scenarios where the instrument is traded considerably higher than its fair value. Overvaluation is caused by market sentiments when there is positive news.
Disclosure: I am part of Trade Nation's Influencer program and receive a monthly fee for using their TradingView charts in my analysis.
Like and subscribe and comment my ideas if you enjoy them!
Trading balanceTrading balance The price of the asset has rebounded from the balance zone. With the prospect of growth into the resistance zone.
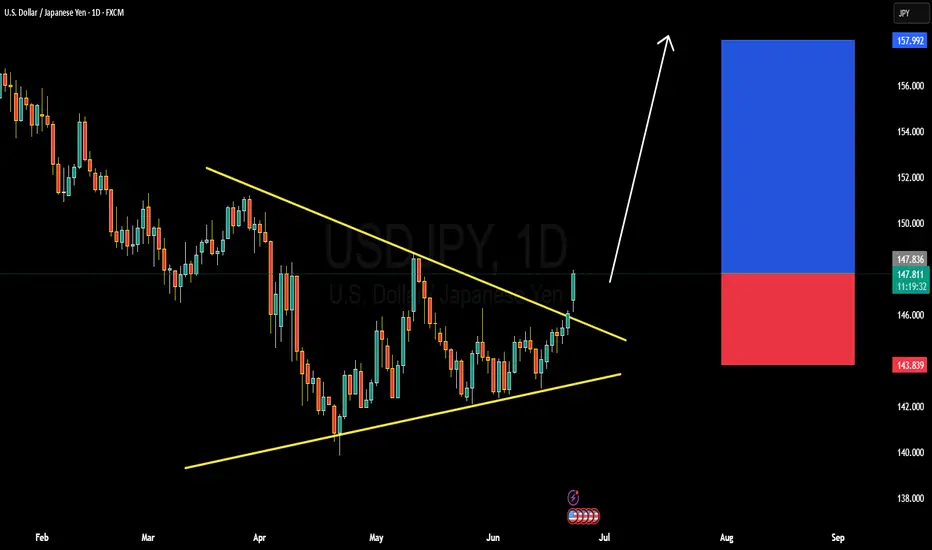
SDJPY BULLISH OR BEARISH DETAILED ANALYSISUSDJPY has successfully broken out of the symmetrical triangle structure that has been forming since early April, with today’s daily candle showing strong bullish momentum above the resistance zone around 147.500. The breakout is clean and backed by volume, which suggests that bulls are in full control. Price action is respecting the trendline structure and has now confirmed a fresh higher high, setting the stage for the next bullish leg. My immediate upside target for this move stands at 157.900.
Fundamentally, the divergence between the Federal Reserve and the Bank of Japan continues to widen. The Fed remains hawkish with inflation still sticky in the US and interest rate cuts being pushed further out. In contrast, the Bank of Japan remains ultra-dovish, with no major policy tightening in sight and continued yield curve control. This policy mismatch is keeping the Yen under consistent selling pressure. Additionally, Japan's core inflation slipped again this week, further reducing the probability of any BOJ rate hike this quarter.
The technical breakout aligns perfectly with the macro narrative. A strong bullish candle breaking structure on the daily suggests momentum will likely continue. With no strong resistance until the 157.900 area, this setup offers a high-conviction long opportunity. Traders should watch for minor pullbacks toward 147.000–146.800 as potential re-entry or add-on zones.
With rising US bond yields, weak Japanese fundamentals, and breakout confirmation on the chart, USDJPY is now well-positioned for a continuation rally. This is a trend-following setup with solid fundamentals and momentum confirmation—ideal conditions for a profitable move in the current forex environment.
U
BITCOIN Is this just a giant Bull Flag??Bitcoin (BTCUSD) saw a strong sell-off yesterday in the aftermath of the U.S. strike in Iran and fears of retaliation, but in later hours recovered some of the lost ground. The recovery is being extended into the Asian and early E.U. hours today and the emerging Channel Down pattern already draws strong similarities with the one in December 17 2024 - January 13 2025.
Both broke below their respective 1D MA50 (blue trend-lines) to form a Lower Low, which in the case of Jan 2025, it initiated a rebound that tested the All Time High (ATH) Resistance. See also how similar their 1D RSI patterns are, testing the same Support level too (41.20).
Given that this time the uptrend has been much shorter since the April 07 2025 Low, this Channel Down may be nothing but a giant Bull Flag in the middle of a standard Bull Cycle Leg. Until confirmed with a 1W candle closing above the ATH Resistance though, the medium-term Target is $111900.
Notice also the formation today of a 1D MA100/200 Bullish Cross, the first since November 13 2024.
So what do you think? Is $111900 your short-term Target? Feel free to let us know in the comments section below!
-------------------------------------------------------------------------------
** Please LIKE 👍, FOLLOW ✅, SHARE 🙌 and COMMENT ✍ if you enjoy this idea! Also share your ideas and charts in the comments section below! This is best way to keep it relevant, support us, keep the content here free and allow the idea to reach as many people as possible. **
-------------------------------------------------------------------------------
💸💸💸💸💸💸
👇 👇 👇 👇 👇 👇

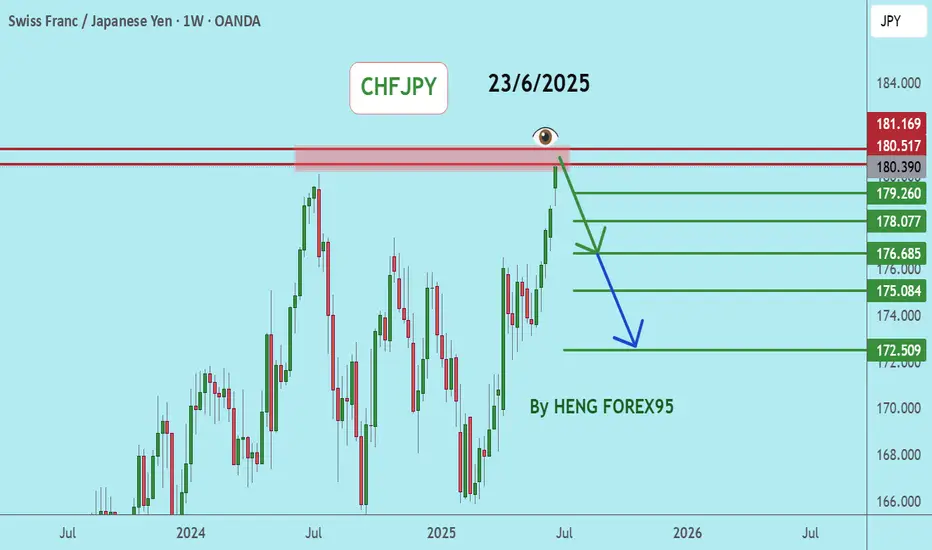
CHFJPYCHFJPY price has a chance to adjust to 180.517-181.169 level. If the price cannot break through 181.169 level, it is expected that the price will drop. Consider selling in the red zone.
🔥Trading futures, forex, CFDs and stocks carries a risk of loss.
Please consider carefully whether such trading is suitable for you.
>>GooD Luck 😊
❤️ Like and subscribe to never miss a new idea!
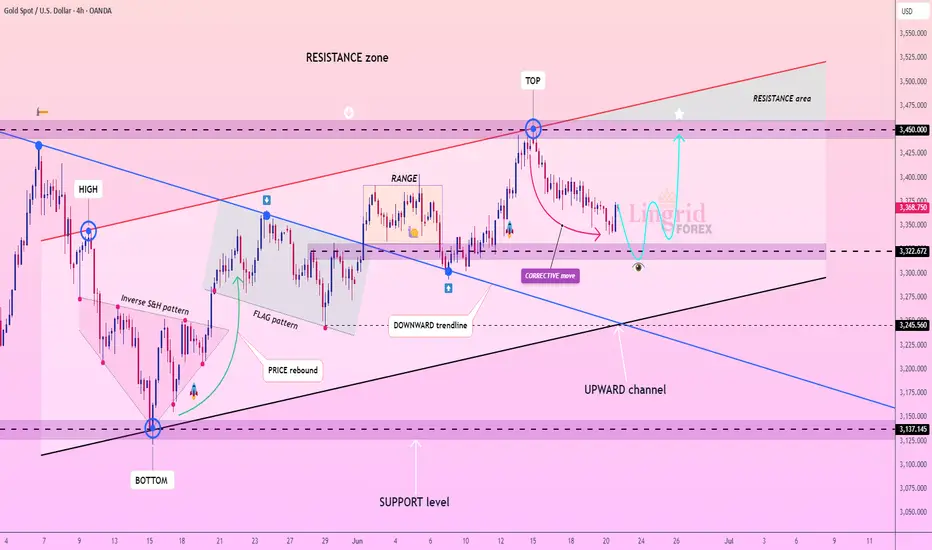
Lingrid | GOLD Weekly Outlook: Corrective Phase Tests SupportOANDA:XAUUSD experienced a notable pullback this week, retreating from the $3,450 resistance zone as profit-taking emerged following the recent geopolitical rally. The market appears to be entering a healthy corrective phase after the strong upward momentum driven by Middle Eastern tensions and safe-haven demand.
The 4H chart reveals gold testing the critical $3,320 support level, which coincides with the lower boundary of the established upward channel. This corrective move was anticipated after the sharp rally to the resistance area marked as "TOP" on the chart. The current price action suggests a natural retracement within the broader bullish structure.
Technically, the downward trendline from the recent high is being respected, indicating the correction may continue toward the $3,240-$3,270 range before finding stronger support. The flag pattern that previously drove the rally now serves as a reference point for this pullback phase.
Key levels to monitor include the $3,320 immediate support and the more substantial $3,200 level below. A decisive break below these supports could extend the correction further, while a bounce from current levels would reinforce the underlying bullish bias. The market remains within the broader upward channel, suggesting this correction is likely temporary before the next leg higher toward the resistance zone above $3,450.
Traders, if you liked this idea or if you have your own opinion about it, write in the comments.
GOLD recovers market overview, key outlookOANDA:XAUUSD is under downward pressure, and ended last week's trading session with a decline. With tensions in the Middle East easing slightly and the Federal Reserve giving a hawkish signal, the safe-haven demand in the gold market tends to weaken, and investors' profit-taking intentions increase, these are the main reasons why gold recorded a significant correction this week.
Gold prices fell last week as safe-haven demand weakened as tensions in the Middle East temporarily eased. President Trump said he would decide on military action against Iran in the next two weeks, a concession that helped ease fears of an escalation. Although Iran continued to launch missiles at Israel, the situation has not spread. However, the Middle East conflict remains risky and is unlikely to end completely.
Gold prices are under pressure due to the Fed's hawkish tone. Although the Fed kept interest rates unchanged, Chairman Powell warned of inflation risks, especially from Trump's new tax policies. At the same time, Mr. Chris Waller's statement showed that the possibility of a July interest rate cut also depends on the inflation situation, causing market expectations to decrease and negatively affecting gold - a non-interest-bearing asset.
Central banks and institutions maintain bullish medium- and long-term expectations
Despite short-term pressures, most institutions maintain positive medium-term expectations for gold. Goldman Sachs reiterated its target of $4,000/oz by 2025, while Citigroup believes gold could fall below $3,000/oz by 2026.
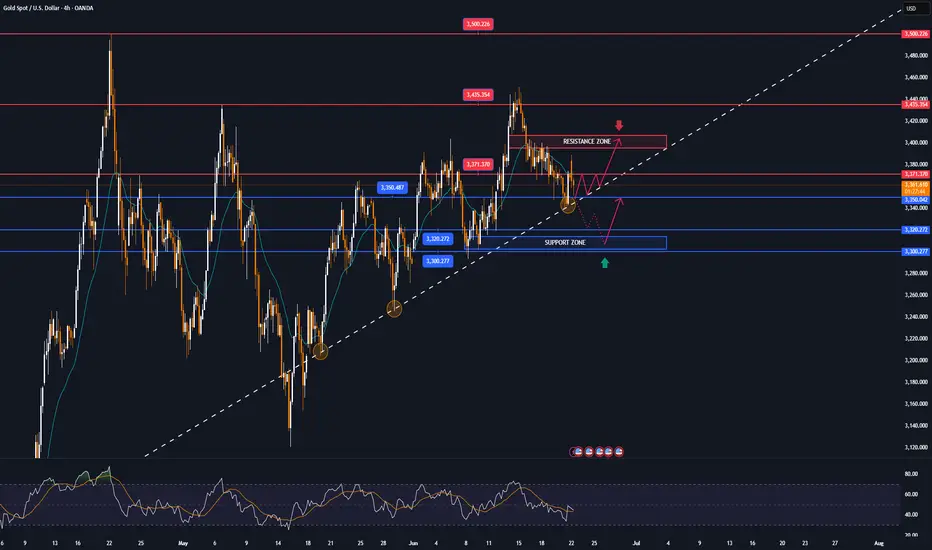
Technical Outlook Analysis OANDA:XAUUSD
Gold has once again bounced from the EMA21 and reached its initial upside target at the 0.236% Fibonacci retracement of $3,371, as noted in previous editions. For now, for gold to qualify for its next upside target at the raw price of $3,400, it needs to sustain price action above the 0.236% Fibonacci level, which means the 0.236% Fibonacci level is also the closest resistance at present.
Once gold breaks above the raw price point of $3,400, it will be in a position to continue its short-term rally with a target of around $3,435, rather than the all-time high of $3,500.
In terms of overall structure, gold still has a bullish outlook with the price channel as the main trend and RSI remaining above 50 and well away from the overbought zone, suggesting that there is still plenty of upside ahead.
In the case of a sell-off, if gold is sold below the EMA21, it could test the $3,320 support in the short term, more so the 0.382% Fibonacci retracement level converging with the lower edge of the price channel. Therefore, early long positions may be considered in terms of volume as well as protection of open positions.
Finally, technically, gold is still trending with an overall bullish outlook, with notable positions listed as follows.
Support: $3,350 – $3,320 – $3,300
Resistance: $3,371 – $3,400 – $3,435 – $3,500
SELL XAUUSD PRICE 3406 - 3404⚡️
↠↠ Stop Loss 3410
→Take Profit 1 3398
↨
→Take Profit 2 3392
BUY XAUUSD PRICE 3312 - 3314⚡️
↠↠ Stop Loss 3308
→Take Profit 1 3320
↨
→Take Profit 2 3326
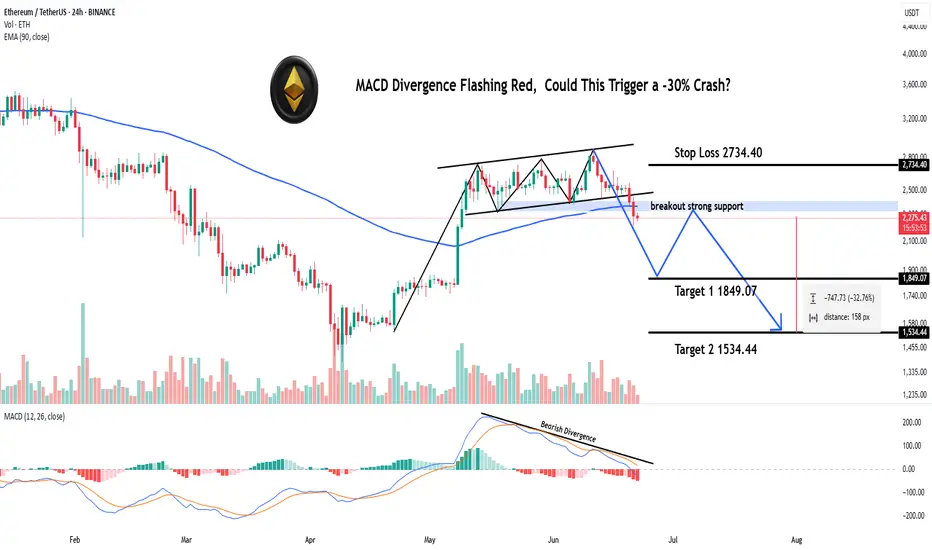
MACD Divergence Flashing Red, Could This Trigger a -30% Crash?Hey Realistic Traders!
Bearish Reversal Signal Flashing on BINANCE:ETHUSDT , Is the Bull Run Over?
Let’s Break It Down..
On the daily timeframe, Solana (SOL) has formed an ascending broadening wedge, which has now broken to the downside through both the lower trendline and a major support zone, indicating a shift in market structure.
Price action has also remained consistently below the 200-day EMA, signaling a potential transition from a bullish to a bearish trend.
A bearish divergence has appeared on the MACD indicator, where price makes higher highs while the MACD forms lower highs. This divergence indicates that buying momentum is weakening, even as the price pushes higher. Such a pattern often precedes a trend reversal and supports the expectation that the price may continue to move lower.
Given these technical signals, the price is likely to continue moving lower toward the first target at 1849.07, with a possible extension to the second target at 1534.44.
This bearish outlook remains valid as long as the price stays below the stop-loss level, currently marked at 2734.40. A move above this level would invalidate the bearish setup.
Support the channel by engaging with the content, using the rocket button, and sharing your opinions in the comments below.
Disclaimer: "Please note that this analysis is solely for educational purposes and should not be considered a recommendation to take a long or short position on ETHUSDT.
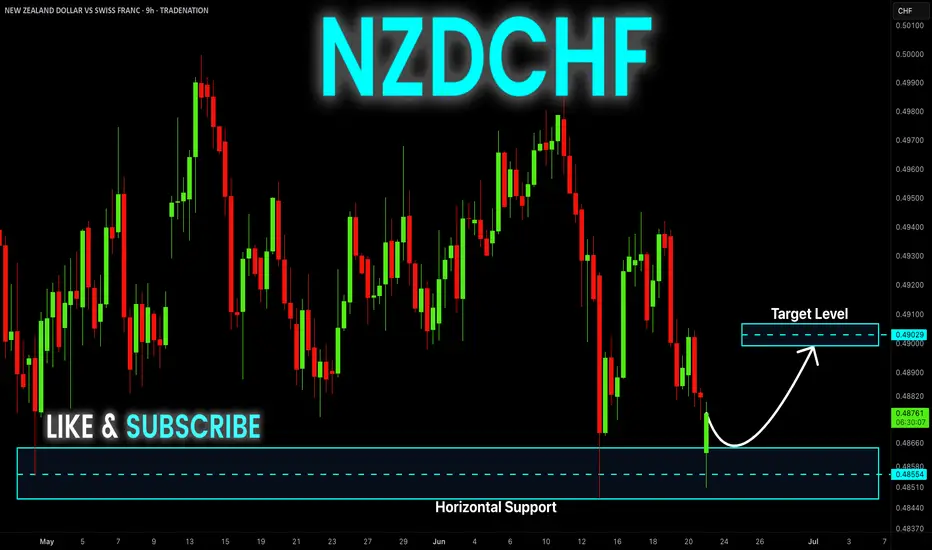
NZD-CHF Rebound Ahead! Buy!
Hello,Traders!
NZD-CHF made a retest
Of the horizontal support
Level of 0.4847 from where
We are already seeing a
Bullish rebound so we are
Locally bullish biased and
We will be expecting a
Further bullish move up
Buy!
Comment and subscribe to help us grow!
Check out other forecasts below too!
Disclosure: I am part of Trade Nation's Influencer program and receive a monthly fee for using their TradingView charts in my analysis.
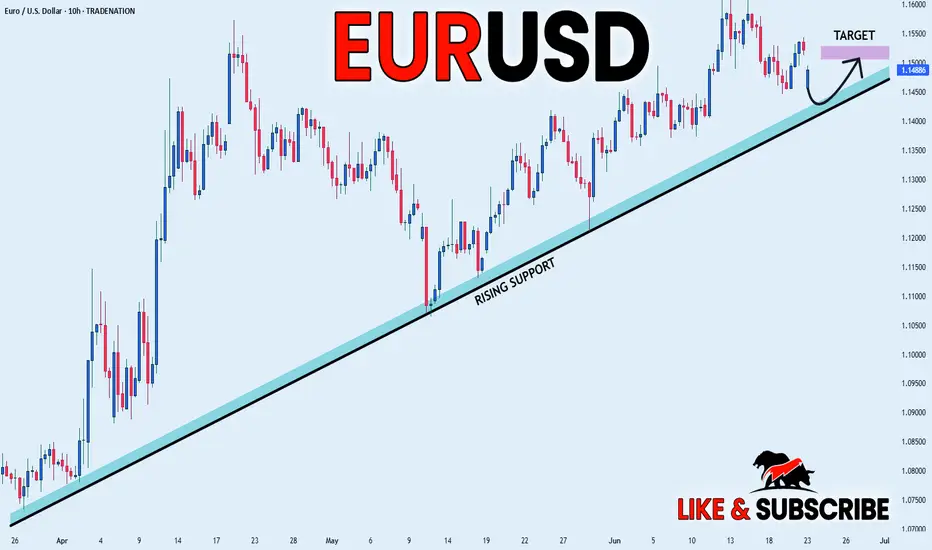
EUR_USD RISING SUPPORT AHEAD|LONG|
✅EUR_USD is trading along the rising support
And as the pair will soon retest it
I am expecting the price to go up
To retest the supply levels above at 1.1511
LONG🚀
✅Like and subscribe to never miss a new idea!✅
Disclosure: I am part of Trade Nation's Influencer program and receive a monthly fee for using their TradingView charts in my analysis.
GBP/JPY in Trouble? Smart Money Rotates Into Yen📊 1. COT Analysis
JPY (Japanese Yen):
Non-Commercial Net Long: +54,615 – showing strong long accumulation since March.
Recent Changes:
Long: -5,319
Short: +1,235
➡️ Mixed signals short-term, but overall net long positioning remains strong. Speculative funds are still heavily favoring the Yen, suggesting potential continued strength.
GBP (British Pound):
Non-Commercial Net Long: +51,634 (111,076 long – 59,442 short)
Recent Changes:
Long: +7,404
Short: -9,015
➡️ Specs are still net long on GBP, but exposure has slightly decreased. The divergence with the Yen is narrowing.
🔎 COT Summary:
Both currencies are being bought by speculators, but the JPY has shown more consistent long-term positioning. Net momentum appears to shift in favor of Yen strength, pointing to potential downside for GBP/JPY.
📅 2. Seasonality – June
Historically, June is a weak month for GBP/JPY, especially over 20y, 15y, 5y, and 2y windows.
Monthly average return is negative across all major historical timeframes (e.g. -1.2415 over 10 years).
➡️ Seasonality reinforces a bearish bias for June.
🧠 3. Retail Sentiment
Short: 52%
Long: 48%
➡️ Retail positioning is balanced, slightly skewed short. Not a strong contrarian signal, but also doesn’t support a bullish breakout scenario.
📉 4. Technical Analysis
Current Structure: Ascending channel from mid-May → currently testing lower boundary.
Key Zone: 195.600–196.520 is a major supply zone with multiple rejections.
Recent Candle Action: Bearish pin bar + engulfing candle → strong rejection from resistance.
Downside Targets:
First: 193.076
Second: 191.439
Break of the channel would further confirm a trend reversal.
➡️ Price action supports a short scenario with high reward-to-risk toward lower zones.

CADJPY Bearish Reversal? Smart Money + Seasonal Confluence🧠 COT Sentiment
Speculators are heavily net short on CAD (–93K), while maintaining a strong net long position on JPY (+144K).
→ This positioning clearly favors JPY strength over CAD weakness.
Commercials are hedging JPY downside, but the dominant flow remains JPY bullish.
📅 Seasonal Patterns
Historically, June is weak for CAD (5Y, 10Y, 15Y averages all negative).
Meanwhile, JPY tends to strengthen in the second half of June.
→ Seasonality supports a bearish outlook on the pair.
📉 Technical Structure
Price has reacted precisely to the Fibonacci 0.705 retracement (106.23) and is showing signs of RSI divergence.
We are trading within a key supply zone between 106.70 and 108.30, which also aligns with a major resistance cluster and harmonic extension.
First target sits at 103.88, with potential extension to 101.20 if breakdown confirms.
🛢 Macro Catalyst
Oil remains under pressure.
CAD retail sales dropped significantly.
Risk-off sentiment (cautious Fed + geopolitical tensions) favors JPY as a safe haven.
📊 Retail Sentiment
62% of retail traders are short, but with an average entry at 108.49.
→ A break below 106 could trigger liquidation, fueling further downside.
🧩 Trade Setup
🔹 Entry zone: 106.70–107.00
🔸 SL: Above 108.40 (invalidates the bearish thesis)
🎯 TP1: 103.88 (S/R retest)
🎯 TP2: 101.20 (extended target on risk aversion)
🧭 Synthesis
Every angle aligns toward a potential bearish reversal on CAD/JPY:
✅ COT positioning
✅ Seasonality
✅ Macro narrative
✅ Technical confluence
✅ Retail sentiment trap

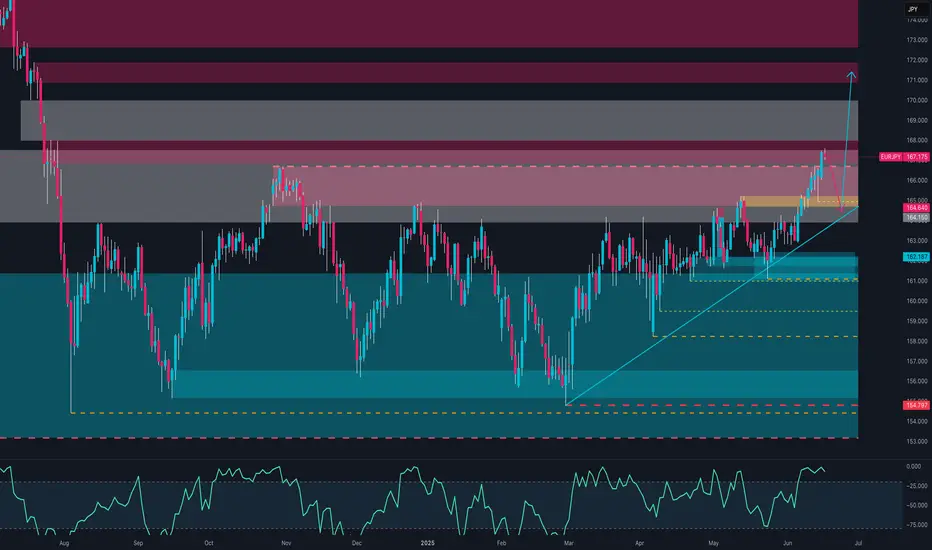
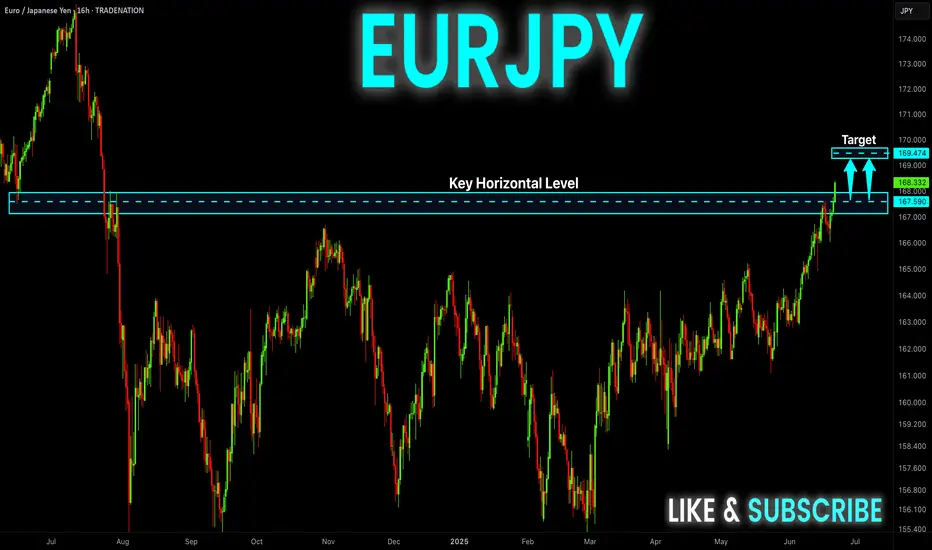
EURJPY Just Broke Out – Is This the Start of a Summer Rally?📊 1. COT Report – Euro & Yen
EUR (Euro FX – CME):
Non-Commercials:
Long: +5,968 | Short: -4,293 → Net Long increasing
Commercials:
Long: +11,480 | Short: +24,451 → Net Short
→ Speculators are clearly bullish on the euro.
JPY (Japanese Yen – CME):
Non-Commercials:
Long: -5,319 | Short: +1,235 → Net Long decreasing
Commercials:
Long: +31,893 | Short: +25,462 → Hedging, but still net short
→ The yen continues to be sold, especially by institutional players.
📌 EUR/JPY COT Summary:
Speculators are buying EUR and selling JPY → strong bullish bias on EUR/JPY.
🧠 2. Retail Sentiment
80% of retail traders are short EUR/JPY, with an average entry at 161.50
Current price is around 167.20 → retail is heavily underwater
✅ Strong contrarian bullish signal
📉 3. Technical Analysis
Price broke out of a long-term range, printing new yearly highs
RSI is overbought but with no active bearish divergence
Price sits inside a major supply zone between 166.50 and 168.00, where previous rejections occurred
A potential pullback to the 164.60–164.15 area aligns with ascending trendline support
🟡 Likely Scenario:
A healthy technical pullback to 164.50–165.00 to cool off RSI,
followed by a continuation higher if supported by momentum and COT positioning
📅 4. Seasonality
June is historically a bullish month for EUR/JPY:
5-year avg: +1.167%
2-year avg: +2.41%
→ Seasonality supports more upside into early July
🌍 5. Macro Context
BoJ remains dovish, no sign of imminent tightening
ECB is steady but relatively less dovish → rate differential still favors the euro
No signs yet of verbal intervention from Japan.
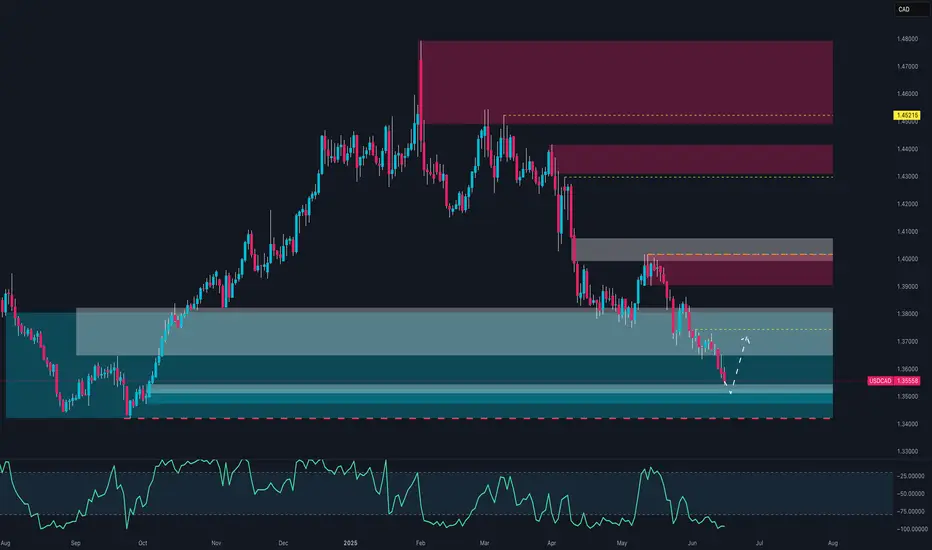
Smart Money Just Flipped Bearish on USD/CAD. Are You Still Long?🧠 1. COT Context & Institutional Flows
🇨🇦 CAD COT Report (CME) – June 10, 2025
Non-Commercials (speculators): net short 93,143 contracts (19,651 long vs. 112,794 short), with a short reduction of -14,319 → early bearish unwinding.
Commercials: net long 91,207 contracts (223,285 long vs. 132,078 short), with strong accumulation (+27,999 longs).
🔄 Net open interest change: +18,436 → renewed institutional interest on the long CAD side.
🇺🇸 USD Index COT Report (ICE) – June 10, 2025
Non-Commercials: net long 1,402 contracts (17,027 long vs. 15,625 short), with a +1,279 increase in longs → modest USD support.
Commercials remain net short -35 contracts, no clear shift.
🔄 Total open interest +2,652 → mild bullish interest in USD.
📌 Implication: Strong institutional support for CAD, USD mildly supported. Net positioning favors downside pressure on USD/CAD.
💹 2. Technical Analysis & Price Action
Primary trend: clearly bearish from the 1.38 zone.
Current price: 1.3552, testing a macro demand zone (1.3470–1.3540).
Daily RSI remains deeply oversold → possible technical bounce, but no reversal structure confirmed.
Recent candles show lower highs and lower lows, with no bullish momentum.
📌 Implication: The bearish trend remains in control. A technical rebound is possible, but bias stays short as long as price trades below 1.3640.
📈 3. Retail Sentiment
77% of retail traders are long USD/CAD, with an average entry at 1.3646.
Only 23% are short, positioned better at 1.3790.
📌 Implication: Retail is heavily long → contrarian bearish signal confirmed.
📊 4. Seasonality
June is historically weak for USD/CAD:
5Y Avg: -0.0118
2Y Avg: -0.0081
The June seasonal curve shows a stronger downside acceleration into the second half of the month.
📌 Implication: Seasonality adds downward pressure into month-end.
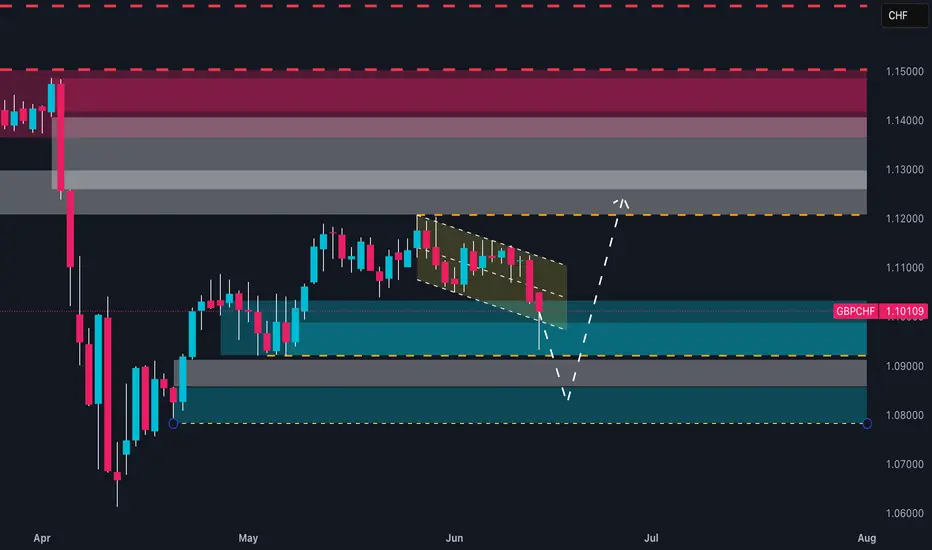
Retail is 86% Long on GBPCHF… But Smart Money Is Setting a Trap📊 1. RETAIL SENTIMENT
Long Positions: 86% – Average Entry: 1.1196
Short Positions: 14% – Average Entry: 1.0999
Current Price: 1.1010
Analysis:
Retail positioning is heavily skewed towards longs, with the average long entry significantly above the current market price. This creates vulnerability to downside pressure through stop-loss hunting or a bearish squeeze. Such extreme retail bias often acts as a contrarian signal: smart money may continue pushing the price lower to flush out retail traders before any meaningful reversal occurs.
🧾 2. COMMITMENTS OF TRADERS – COT REPORT (June 10, 2025)
🔹 British Pound (GBP)
Non-Commercials (Speculators): Net Long increasing by +7.4K → now at +51.6K
Commercials (Hedgers): Net Short decreasing by -13.9K → now at -60.5K
Total Open Interest: Decreased by -19K
Interpretation:
Speculators are maintaining strong long exposure on GBP, while commercials are covering some shorts—potentially signaling a short-term pause in bullish momentum. However, the drop in overall open interest suggests possible consolidation or short-term uncertainty.
🔹 Swiss Franc (CHF)
Non-Commercials: Net Shorts reduced by -2.7K
Commercials: Net Longs increased by +2.5K
Total Open Interest: Increased by +5.6K
Interpretation:
The CHF is gaining strength. Commercial participants are increasing their long exposure while speculators reduce their shorts—this positive divergence supports a bullish outlook on CHF, especially against retail-heavy long pairs like GBP.
📈 3. CHF SEASONALITY – JUNE
Average CHF Performance in June:
20-Year Avg: +0.0099
15-Year Avg: +0.0138
10-Year Avg: +0.0099
5-Year Avg: +0.0039
Analysis:
Historically, June is a seasonally strong month for the Swiss Franc. This seasonal bias aligns with current macro conditions, reinforcing the bullish case for CHF.
📊 4. TECHNICAL ANALYSIS (Daily Chart)
Pattern: Descending channel with a recent false breakdown and re-entry
Key Support Zone: 1.0980–1.1000 → tested and defended with a bullish wick
Target Resistance: 1.1170–1.1200 → prior retail cluster, supply zone, and average long entry
Scenario: A confirmed breakout of the channel could trigger a short squeeze toward 1.1170–1.1200
📌 STRATEGIC OUTLOOK
The current GBP/CHF setup is technically and sentimentally delicate. The price sits on a major daily demand zone, while sentiment and macro flows suggest downside pressure remains in play—but also allow room for a potential contrarian rally (short squeeze).
👉 Action Plan:
Wait for intraday/daily confirmation:
Go long above 1.1045 (breakout confirmation) → target 1.1170
Go short below 1.0980 (bearish continuation) → target 1.0860
EUR-JPY Bullish Breakout! Buy!
Hello,Traders!
EUR-JPY is trading in an
Uptrend and the pair made
A strong bullish breakout
Of the key horizontal level
Of 168.000 and the breakout
Is confirmed so we will be
Expecting a further bullish
Move up on Monday
Buy!
Comment and subscribe to help us grow!
Check out other forecasts below too!
Disclosure: I am part of Trade Nation's Influencer program and receive a monthly fee for using their TradingView charts in my analysis.
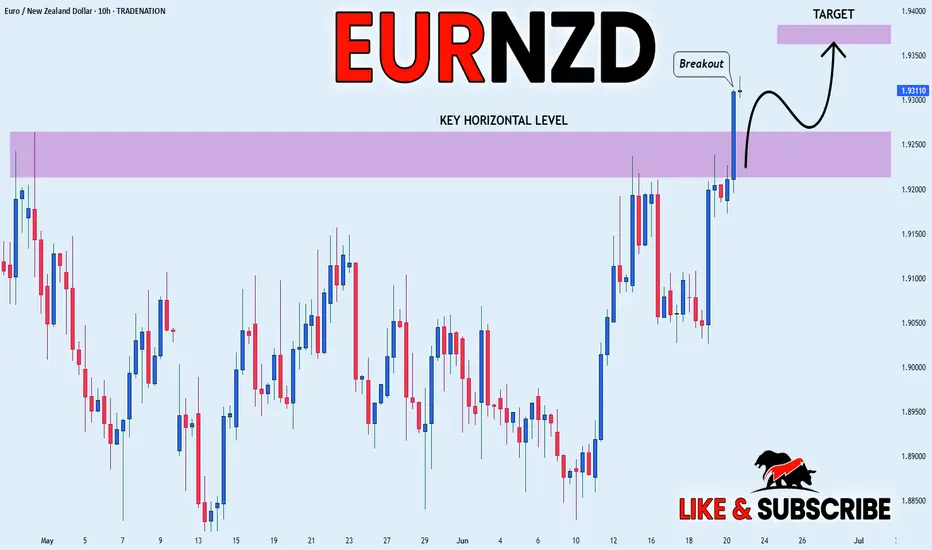
EUR_NZD WILL KEEP GROWING|LONG|
✅EUR_NZD is going up
Now and the pair made a bullish
Breakout of the key horizontal
Level of 1.9250 and the breakout
Is confirmed so we are bullish
Biased and we will be expecting
A further bullish move up on Monday
LONG🚀
✅Like and subscribe to never miss a new idea!✅
Disclosure: I am part of Trade Nation's Influencer program and receive a monthly fee for using their TradingView charts in my analysis.
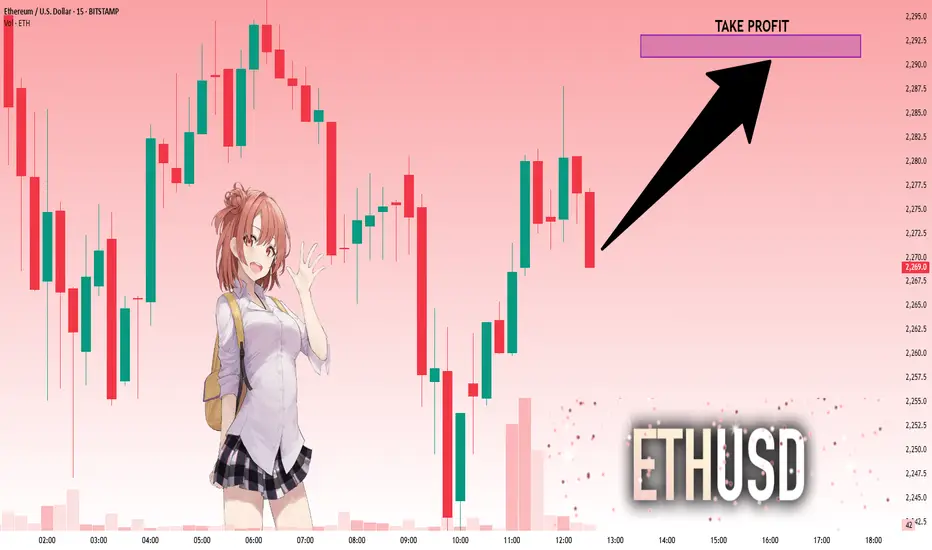
ETHUSD: Will Go Up! Long!
My dear friends,
Today we will analyse ETHUSD together☺️
The price is near a wide key level
and the pair is approaching a significant decision level of 2,270.9 Therefore, a strong bullish reaction here could determine the next move up.We will watch for a confirmation candle, and then target the next key level of 2,290.8.Recommend Stop-loss is beyond the current level.
❤️Sending you lots of Love and Hugs❤️
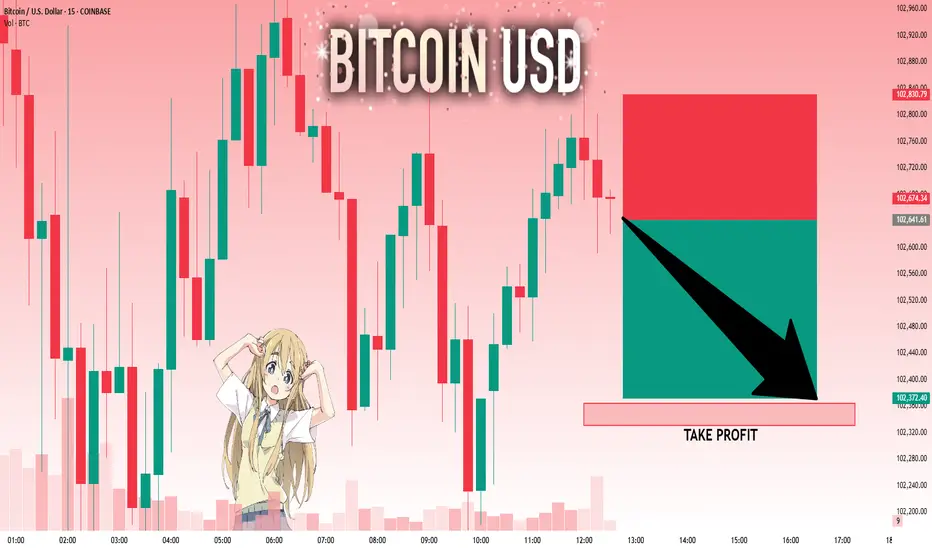
BTCUSD: The Market Is Looking Down! Short!
My dear friends,
Today we will analyse BTCUSD together☺️
The recent price action suggests a shift in mid-term momentum. A break below the current local range around 102,641.61 will confirm the new direction downwards with the target being the next key level of 102,364.09.and a reconvened placement of a stop-loss beyond the range.
❤️Sending you lots of Love and Hugs❤️