GBPUSD hit its 1D MA50. Perfect buy signal.The GBPUSD pair has been trading within a Channel Up pattern since the January 13 2025 market bottom. Yesterday it hit its 1D MA50 (blue trend-line) for the first time since April 08.
This is the most efficient buy entry as the 1D MA50 has been supporting since the February 13 break-out. Even the 1D CCI turned oversold and rebounded, which is consistent with all bottom buys inside the Channel Up.
The Bullish Leg can extend to as high as +5.05% but due to the presence of the Inner Higher Highs trend-line, we first target 1.3850 (+3.43% rise).
-------------------------------------------------------------------------------
** Please LIKE 👍, FOLLOW ✅, SHARE 🙌 and COMMENT ✍ if you enjoy this idea! Also share your ideas and charts in the comments section below! This is best way to keep it relevant, support us, keep the content here free and allow the idea to reach as many people as possible. **
-------------------------------------------------------------------------------
💸💸💸💸💸💸
👇 👇 👇 👇 👇 👇
Signals

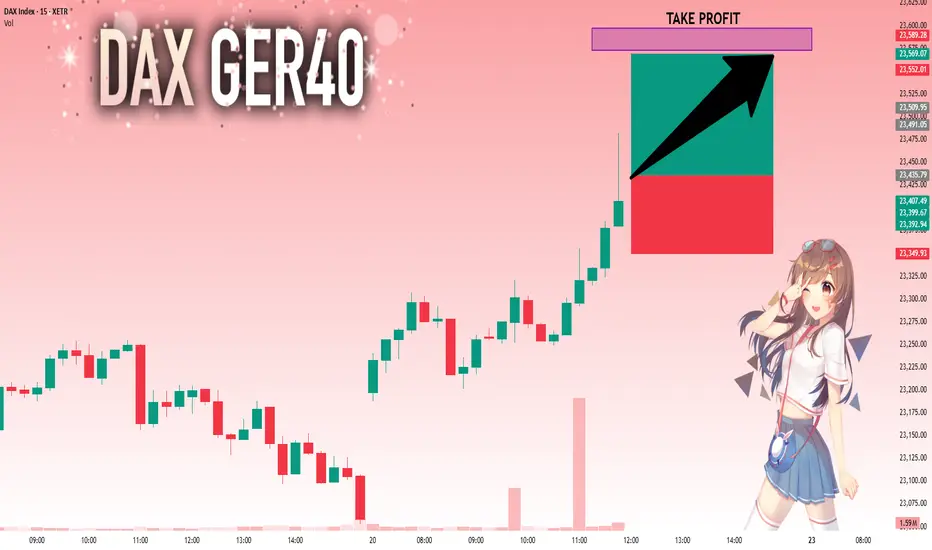
DAX: Target Is Up! Long!
My dear friends,
Today we will analyse DAX together☺️
The recent price action suggests a shift in mid-term momentum. A break above the current local range around 23,435.79 will confirm the new direction upwards with the target being the next key level of 23,572.93 and a reconvened placement of a stop-loss beyond the range.
❤️Sending you lots of Love and Hugs❤️
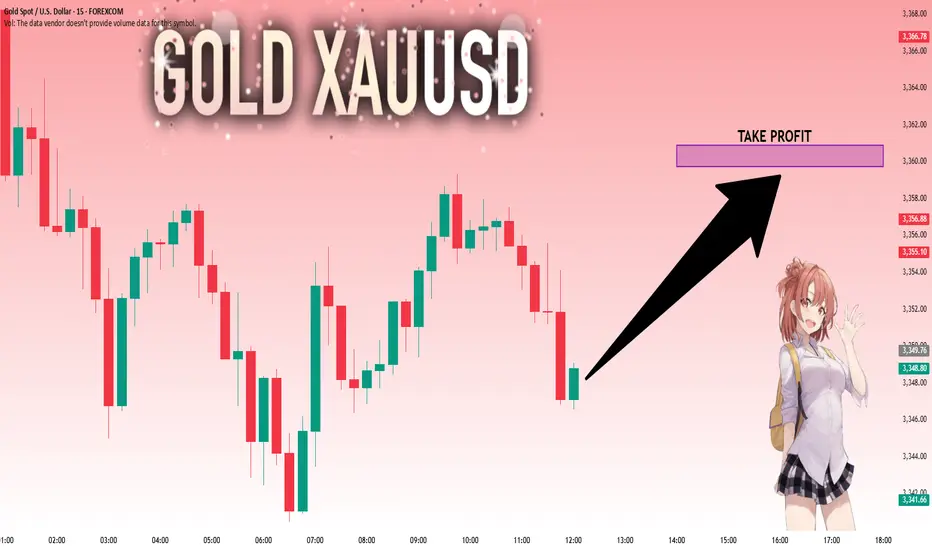
GOLD: Move Up Expected! Long!
My dear friends,
Today we will analyse GOLD together☺️
The in-trend continuation seems likely as the current long-term trend appears to be strong, and price is holding above a key level of 3,348.30 So a bullish continuation seems plausible, targeting the next high. We should enter on confirmation, and place a stop-loss beyond the recent swing level.
❤️Sending you lots of Love and Hugs❤️
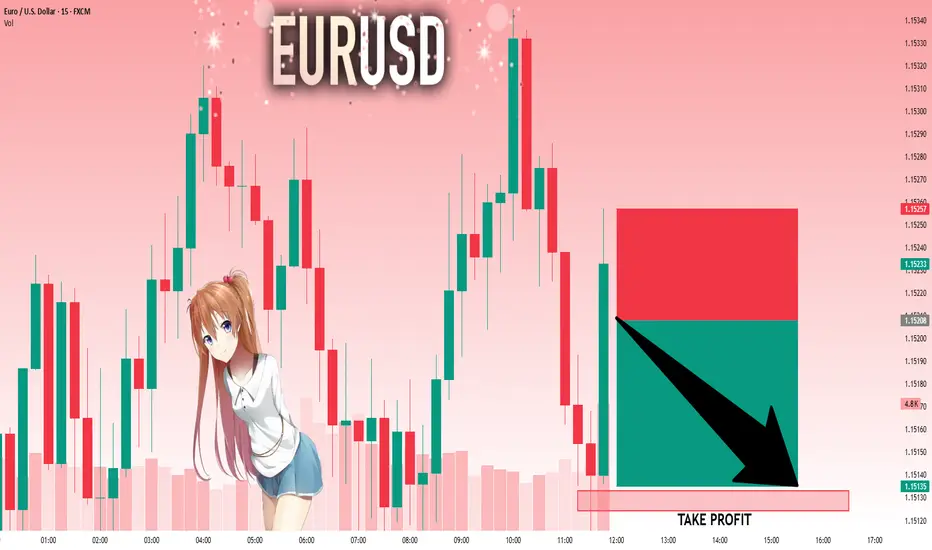
EURUSD: Move Down Expected! Short!
My dear friends,
Today we will analyse EURUSD together☺️
The market is at an inflection zone and price has now reached an area around 1.15208 where previous reversals or breakouts have occurred.And a price reaction that we are seeing on multiple timeframes here could signal the next move down so we can enter on confirmation, and target the next key level of 1.15133..Stop-loss is recommended beyond the inflection zone.
❤️Sending you lots of Love and Hugs❤️
SILVER: Local Bearish Bias! Short!
My dear friends,
Today we will analyse SILVER together☺️
The price is near a wide key level
and the pair is approaching a significant decision level of 36.067 Therefore, a strong bearish reaction here could determine the next move down.We will watch for a confirmation candle, and then target the next key level of 35.716..Recommend Stop-loss is beyond the current level.
❤️Sending you lots of Love and Hugs❤️

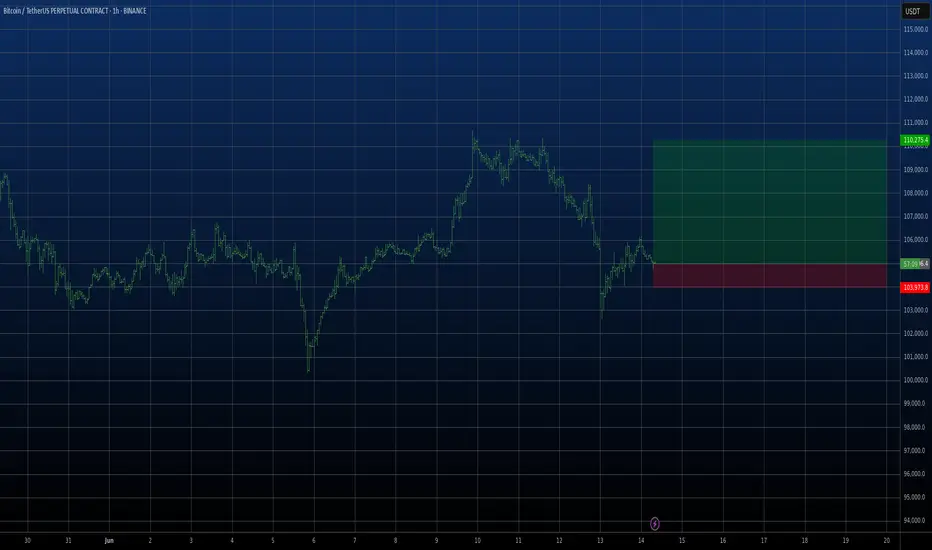
Good moment for try to Buy BTCGood moment for try to Buy BTC. Very good down movement and now we make small step of the up. This point can be point for start to move new up trend with update local highest high. Stop to previous local low bar. Will see...
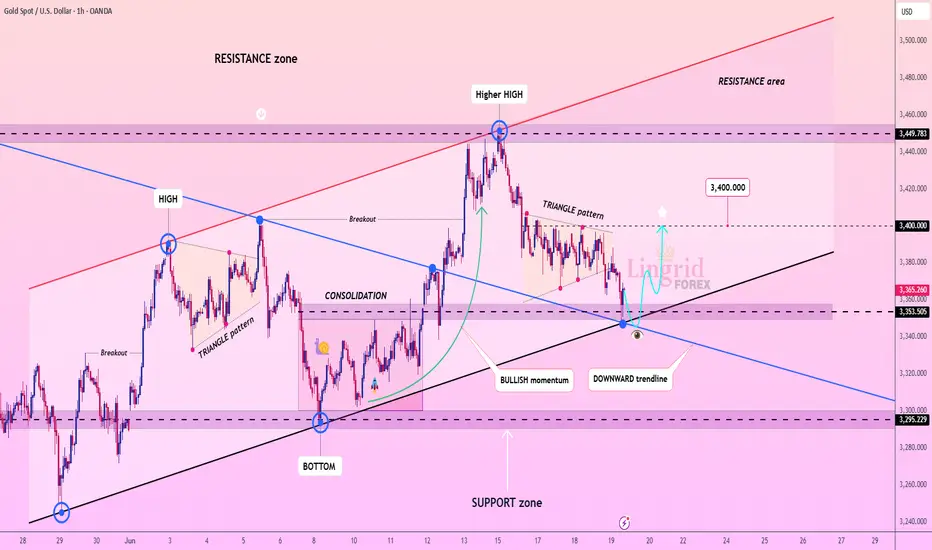
Lingrid | GOLD Post-FOMC Price Creates Trading OpportunityOANDA:XAUUSD is pulling back into the confluence zone between the black trendline and the 3,353–3,355 support, aligning with the breakout zone of a previous triangle pattern. Despite the drop, the overall structure remains bullish, especially if this retest holds. A bounce here would confirm the upward channel continuation toward the 3,400 key level.
📈 Key Levels
Buy zone: 3,350–3,355
Sell trigger: breakdown below 3,353
Target: 3,400
Buy trigger: clear bullish reversal from trendline support
💡 Risks
Break below 3,353 may shift bias to neutral or bearish
Sharp dollar strength could weigh on gold's recovery
Failure to break above the triangle again may trap early buyers
Traders, if you liked this idea or if you have your own opinion about it, write in the comments. I will be glad 👩💻
BITCOIN This is the long-term picture. Don't get distracted.Bitcoin (BTCUSD) has been consolidating lately after making a new All Time High (ATH) last month and this is already making part of the market nervous over whether that's the Cycle Top or not.
This is one of those times when it would be best to ignore the short-term noise/ volatility and stick to the long-term picture. And that's exactly what's shown on this chart, with BTC on the 1M time-frame showing the incredible symmetry among its 4-year Cycles, with Bear Markets lasting 12 - 13 months and Bull Markets 35.
Based on that, this Cycle's Top is expected to be priced by October (2025). This also matches the Sine Waves as implied by the 1M RSI, which as been trading within a Channel Down (diminishing returns) since Bitcoin's inception.
So do you also think that we have around 4 months before the market tops? Feel free to let us know in the comments section below!
-------------------------------------------------------------------------------
** Please LIKE 👍, FOLLOW ✅, SHARE 🙌 and COMMENT ✍ if you enjoy this idea! Also share your ideas and charts in the comments section below! This is best way to keep it relevant, support us, keep the content here free and allow the idea to reach as many people as possible. **
-------------------------------------------------------------------------------
💸💸💸💸💸💸
👇 👇 👇 👇 👇 👇

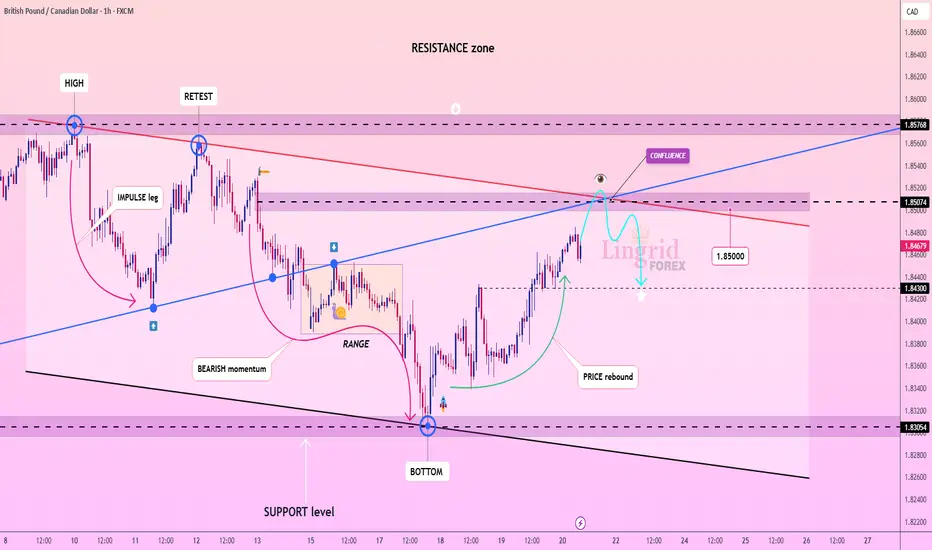
Lingrid | GBPCAD Bearish Opportunity at Confluence ZoneFX:GBPCAD is rebounding from the bottom of its support zone, forming a rounded recovery toward a confluence of resistance levels near 1.8507. Price is nearing the intersection of a downtrend line and a horizontal key level, creating a high-risk rejection zone. A failure to break above this confluence could initiate a bearish swing toward 1.8430 or lower.
📈 Key Levels
Buy zone: 1.8430–1.8460
Sell trigger: bearish rejection at 1.8507
Target: 1.8305
Buy trigger: strong close above 1.8576
💡 Risks
Breaking 1.8507 could lead to extended upside
Economic news or CAD volatility may disrupt pattern
Price may stall in the resistance cluster before choosing direction
Traders, if you liked this idea or if you have your own opinion about it, write in the comments. I will be glad 👩💻
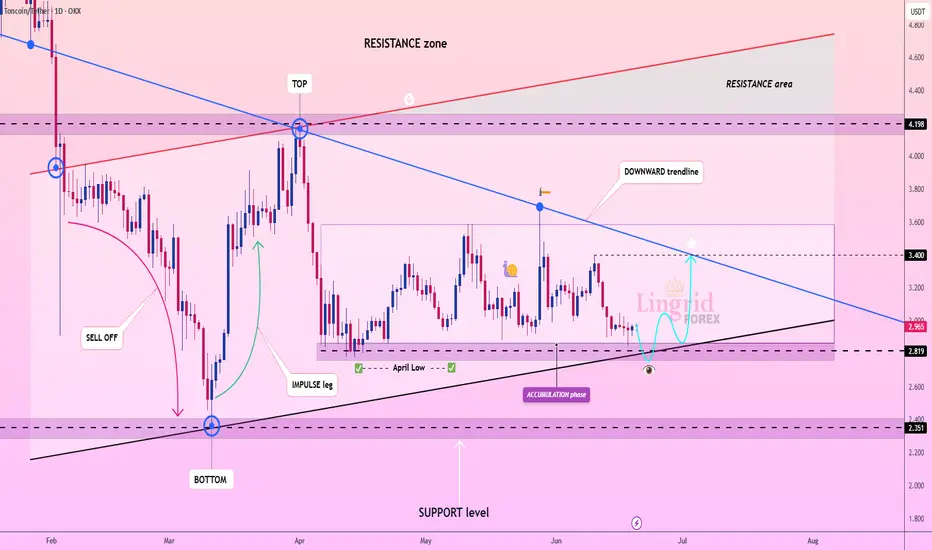
Lingrid | TONUSDT Mid-Term Market Structure AnalysisOKX:TONUSDT is holding just above the 2.82 support level while compressing into the apex of the downtrend and ascending support. Price action remains locked within a long accumulation range, but the bullish reaction near the black trendline hints at a potential reversal. A breakout above the downward trendline would expose 3.40 as the next resistance target.
📈 Key Levels
Buy zone: 2.80–2.83
Sell trigger: close below 2.81
Target: 3.40
Buy trigger: bullish breakout from descending trendline
💡 Risks
Rejection from the trendline may trigger a new test of 2.35
Market-wide weakness could delay breakout
Sideways range may persist if momentum fails to build
Traders, if you liked this idea or if you have your own opinion about it, write in the comments. I will be glad 👩💻
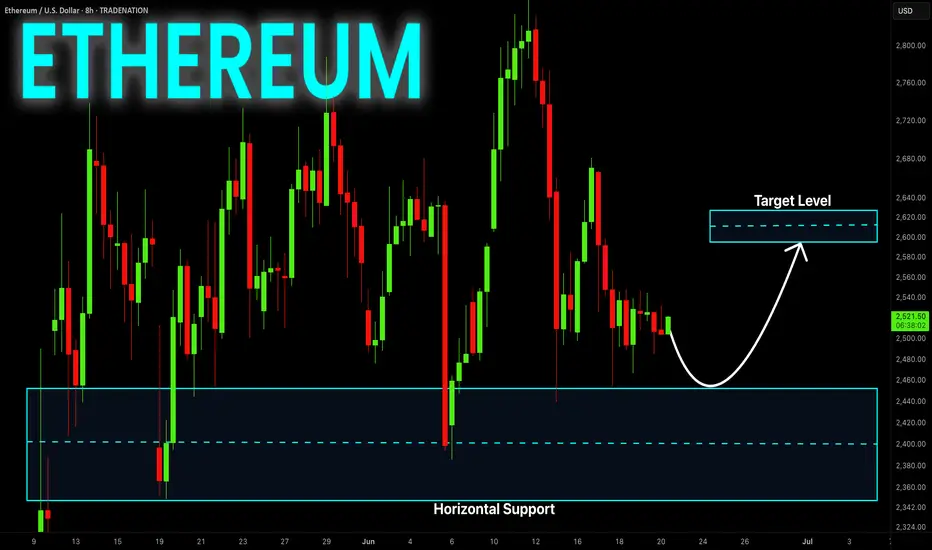
ETHEREUM Risky Long! Buy!
Hello,Traders!
ETHEREUM is consolidating
Above the horizontal support
Area around 2360$ and we
Are already seeing a local
Rebound from the level
So as we are bullish biased
A further price growth
Is to be expected
Buy!
Comment and subscribe to help us grow!
Check out other forecasts below too!
Disclosure: I am part of Trade Nation's Influencer program and receive a monthly fee for using their TradingView charts in my analysis.
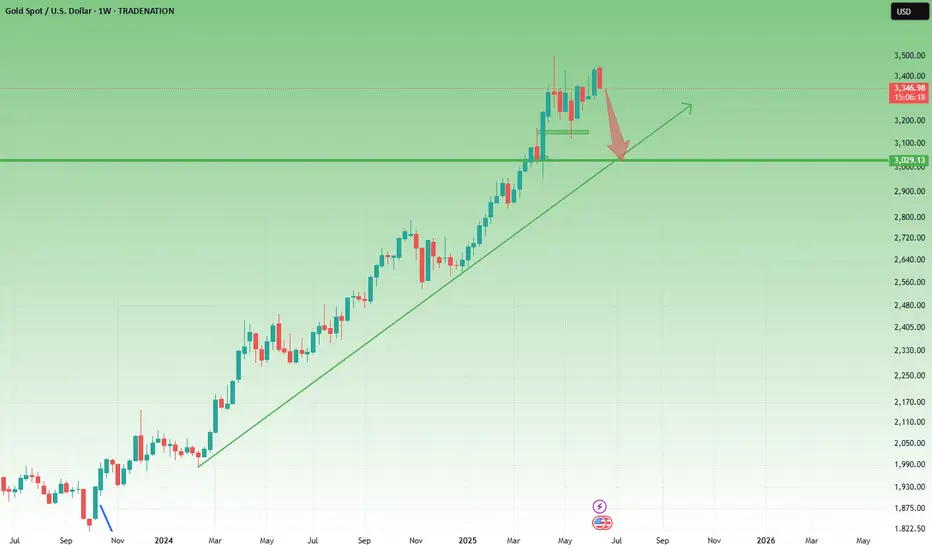
Choppy Gold Action Hides a Bigger Drop on Weekly Chart?After Monday’s correction, Gold continued lower – but the drop has been extremely choppy, making swing trading nearly impossible in this environment.
🔄 Short-term vs. Weekly Picture
On the 1H chart, price action is messy and directionless. However, the weekly chart tells a clearer story – which is not bullish at this moment.
❗ Let’s not rush into the “new ATH” narrative
Last week, I pointed out around the 3360 zone that we may get a rise above 3400. That move happened – but it seems more driven by Middle East tensions than by any structural strength in Gold itself.
📉 Why I’m leaning bearish on higher timeframes at this moment:
• This week’s price action almost fully negates last week’s strong green candle
• A close near the bottom of the range could form a Dark Cloud Cover pattern – a strong bearish signal
• Unless we see a reversal above 3400, downside remains the higher probability
📌 Next Target?
If the weekly close confirms this bearish setup, a drop to 3150 is not only possible – it’s becoming likely.
Disclosure: I am part of TradeNation's Influencer program and receive a monthly fee for using their TradingView charts in my analyses and educational articles.
NATGAS STRONG RESISTANCE AHEAD|SHORT|
✅NATGAS has been growing recently
And Gas seems locally overbought
So as the pair is approaching
A horizontal resistance of 4.256$
Price decline is to be expected
SHORT🔥
✅Like and subscribe to never miss a new idea!✅
Disclosure: I am part of Trade Nation's Influencer program and receive a monthly fee for using their TradingView charts in my analysis.

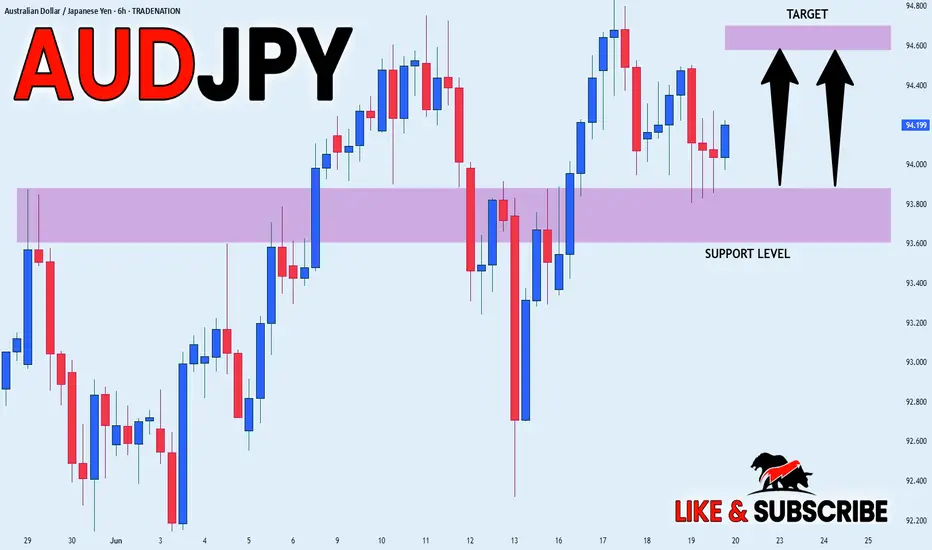
AUD_JPY GROWTH AHEAD|LONG|
✅AUD_JPY has retested a key support level of 93.800
And as the pair is already making a bullish rebound
A move up to retest the supply level above at 94.600 is likely
LONG🚀
✅Like and subscribe to never miss a new idea!✅
Disclosure: I am part of Trade Nation's Influencer program and receive a monthly fee for using their TradingView charts in my analysis.
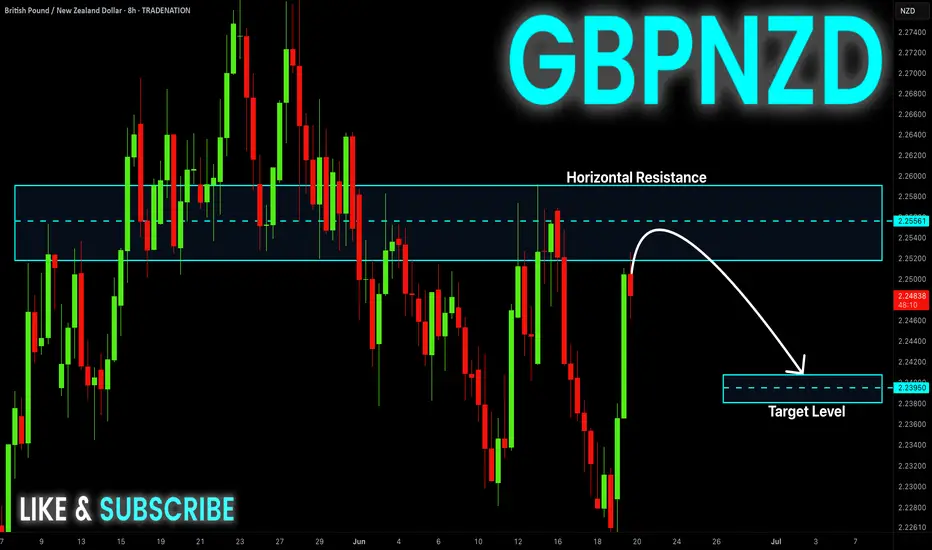
GBP-NZD Will Go Down! Sell!
Hello,Traders!
GBP-NZD will soon hit
A horizontal resistance
Of 2.2556 and as its a
Strong key level we will
Be expecting a local
Pullback and a move down
Sell!
Comment and subscribe to help us grow!
Check out other forecasts below too!
Disclosure: I am part of Trade Nation's Influencer program and receive a monthly fee for using their TradingView charts in my analysis.
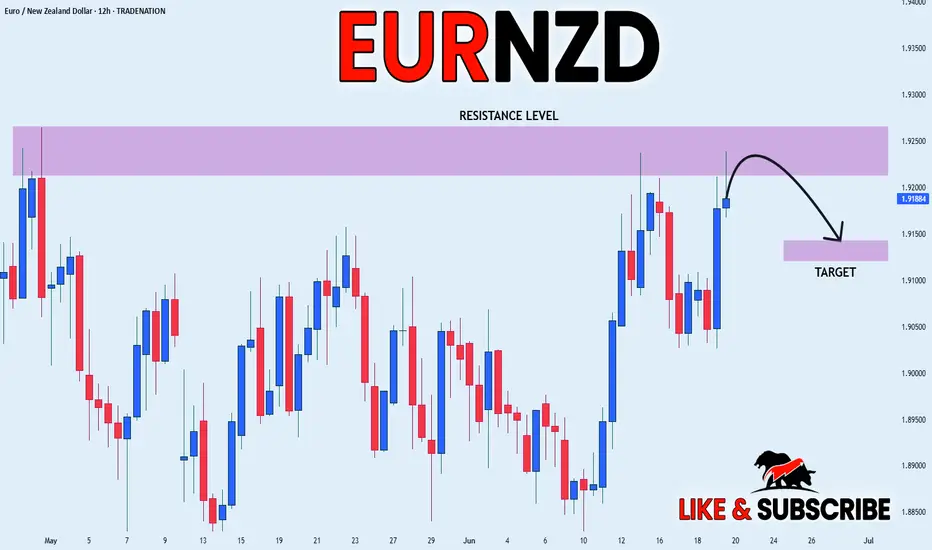
EUR_NZD SHORT FROM RESISTANCE|
✅EUR_NZD is going up now
But a strong resistance level is ahead at 1.9266
Thus I am expecting a pullback
And a move down towards the target of 1.9150
SHORT🔥
✅Like and subscribe to never miss a new idea!✅
Disclosure: I am part of Trade Nation's Influencer program and receive a monthly fee for using their TradingView charts in my analysis.