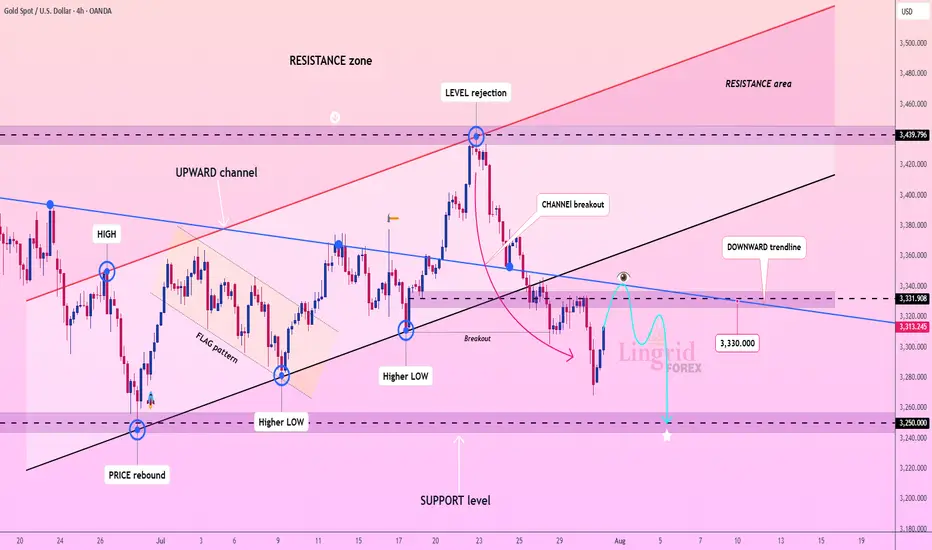
Lingrid | GOLD Possible Retest of the Major Support ZoneThe price perfectly fulfilled my previous idea . OANDA:XAUUSD is bouncing from recent lows but remains under pressure below the key resistance at 3,331.90 and the downward trendline. The prior rejection near 3,440 led to a steep selloff with a clean break below the upward channel. Current action shows a potential lower high forming near the broken trendline. A rejection there could send gold tumbling toward the 3,250.00 support zone.
📌 Key Levels
Sell trigger: Failure to reclaim 3,331.90
Sell zone: 3,330 – 3,340
Target: 3,250.00
Invalidation: Strong bullish breakout above 3,340 and descending trendline
💡 Risks
Bullish reversal breaking above downward trendline
Dovish Fed news boosting gold
Unexpected macroeconomic shocks increasing safe-haven demand
If this idea resonates with you or you have your own opinion, traders, hit the comments. I’m excited to read your thoughts!
Signalservice
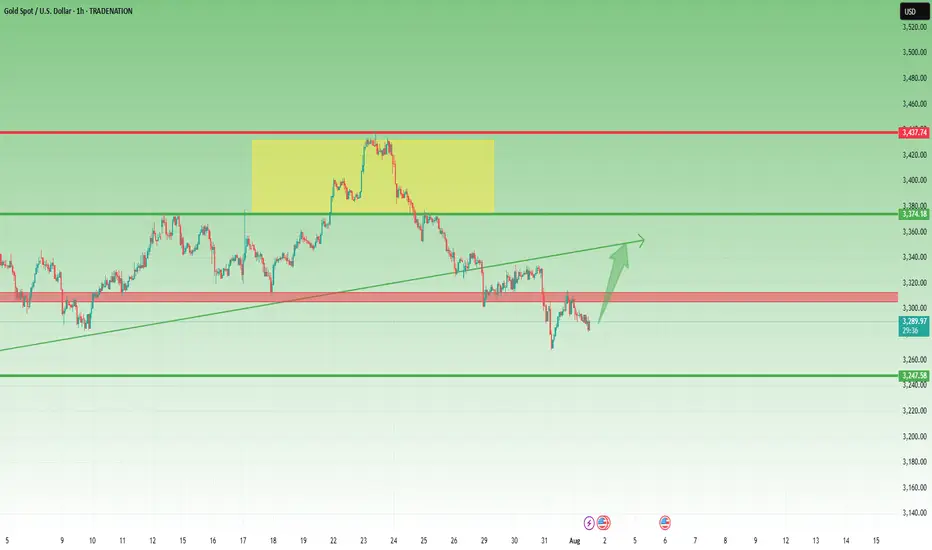
Gold Rejected at 3315 – But Bulls Might Not Be Done Yet📌 What happened yesterday?
During the Asian session, Gold printed a fresh local low at 3268, continuing the downtrend that already dropped over 1700 pips in just one week. However, that move quickly reversed, and we saw a natural corrective bounce.
📈 Resistance holds firm
The correction took price back up into the 3310 zone, which acted as confluence resistance. After two taps into that area, price failed to sustain above 3300, indicating sellers are still active there.
❓ Is the upside correction over?
I don't think so. The recent drop has been choppy, lacking the strong momentum of previous legs. This type of price action often signals that we are still within a correction, not in a clean continuation.
📊 What am I watching?
I’m actively monitoring for:
• Exhaustion signs on the downside
• Upside reversal signals
My plan is to open long trades only when I see confirmation, aiming for a move back toward the 3330 zone, which could act as resistance.
Disclosure: I am part of TradeNation's Influencer program and receive a monthly fee for using their TradingView charts in my analyses and educational articles.
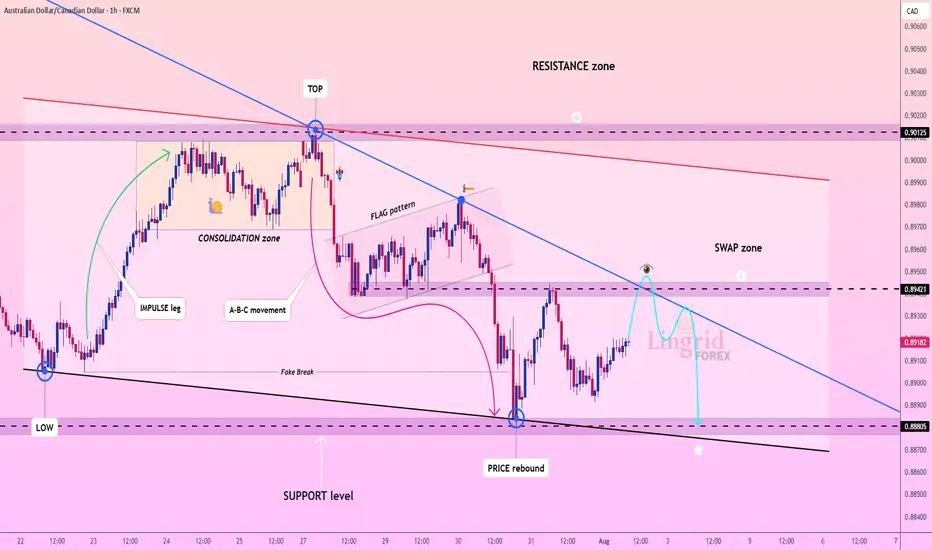
Lingrid | AUDCAD Swap Zone. Potential Selling OpportunityThe price perfectly fulfilled my last idea . FX:AUDCAD is rebounding from a strong support area after a fake break below 0.88805 and is now moving toward the descending trendline. The price is expected to test the swap zone near 0.89421, where prior support may flip to resistance. This setup favors a SELL scenario from the lower high structure within the flag and downtrend. A rejection from the trendline could resume the bearish continuation back toward support.
📌 Key Levels
Sell zone: 0.89421 – 0.89500
Buy zone: 0.88805 – 0.88600
Target: 0.88805
Invalidation: Break and close above 0.89550
💡 Risks
Bullish breakout through the descending trendline
Sharp reversal from macroeconomic news
Short-term consolidation above 0.89100 weakening momentum
If this idea resonates with you or you have your own opinion, traders, hit the comments. I’m excited to read your thoughts!
Top in Place? NASDAQ100 Signals Exhaustion After Incredible Run📈 The crazy run since April
NASDAQ100 has had a spectacular run since early April, when the index dipped to 16,300 amid rising tensions caused by Trump’s tax war. From that low, we’ve seen a mind-blowing rally of over 7,000 points, which translates to a 40% gain in just 4 months.
Such a rise is not just impressive— it’s overextended , especially by historical standards. Markets don’t move in straight lines forever, and this one might be showing signs of fatigue.
🕯️ Bearish signal at the top
Fast forward to this week: yesterday, the index marked a new all-time high at 23,700, but closed the day with a strong bearish engulfing candle — one that wipes out the gains of the previous 4 trading sessions.
This is not a small technical detail. Such candles, when appearing after an extended rally, often signal exhaustion and a potential shift in momentum.
❗ Top in place?
In my opinion, there's a high probability that a top has been set, at least temporarily. We might be looking at the beginning of a healthy correction, or even something more meaningful, depending on follow-through in the next sessions.
📉 Where to next?
The first major support to watch is the 22,200 level.
I expect that zone to be tested soon — and honestly, considering how much the index has gone up, this shouldn’t surprise anyone. It’s nothing more than a minor pullback, all things considered.
🧠 Stay smart!
When markets go vertical, it pays to stay disciplined and realistic. Tops rarely announce themselves, but when signals like this appear, it’s wise to listen.
Disclosure: I am part of TradeNation's Influencer program and receive a monthly fee for using their TradingView charts in my analyses and educational articles.

XAUUSD Update – Down Continuation to 3250?1. What Happened Yesterday
After an anemic correction that formed a bearish flag, Gold finally broke below 3300 and even dipped under the 3280 support zone — which was my primary downside target. While the move during the day didn’t have enough momentum to reach my second sell limit, I was already in a low-volume short position, so I didn’t miss the move entirely.
2. The Key Question
Has the drop ended, or are we looking at further downside?
3. Why I Expect More Downside
• The overall structure remains bearish.
• The newly formed resistance (previous support) is now the new sell zone.
• If the price drops towards 3280 again, continuation to 3250 becomes very probable.
4. Trading Plan
Selling rallies remains the preferred strategy, especially on spikes into resistance. As long as the price stays below 3335-3340 zone, the bearish outlook remains intact.
5. Conclusion
Sell the rallies. The technical picture still favors downside continuation — no need to overcomplicate it. 🚀
Disclosure: I am part of TradeNation's Influencer program and receive a monthly fee for using their TradingView charts in my analyses and educational articles.
Lingrid | TONUSDT Potential Long From the KEY ZoneThe price perfectly fulfilled my last idea . OKX:TONUSDT is pulling back from a fake breakout above 3.590 but holding within the boundaries of an upward channel. The price is approaching strong confluence support near 3.250, where both the trendline and horizontal zone align. A rebound from this level could launch a new bullish leg toward the resistance zone. Buyers will look for confirmation at the bounce area to aim for 3.590 and beyond.
📌 Key Levels
Buy zone: 3.250 – 3.300
Sell trigger: Break below 3.250
Target: 3.590 – 3.700
Buy trigger: Bullish engulfing or breakout from local consolidation near 3.300
💡 Risks
Loss of support at 3.250 trendline
Bearish pressure from broader market sentiment
Another fakeout or choppy move around 3.300–3.400 zone
If this idea resonates with you or you have your own opinion, traders, hit the comments. I’m excited to read your thoughts!

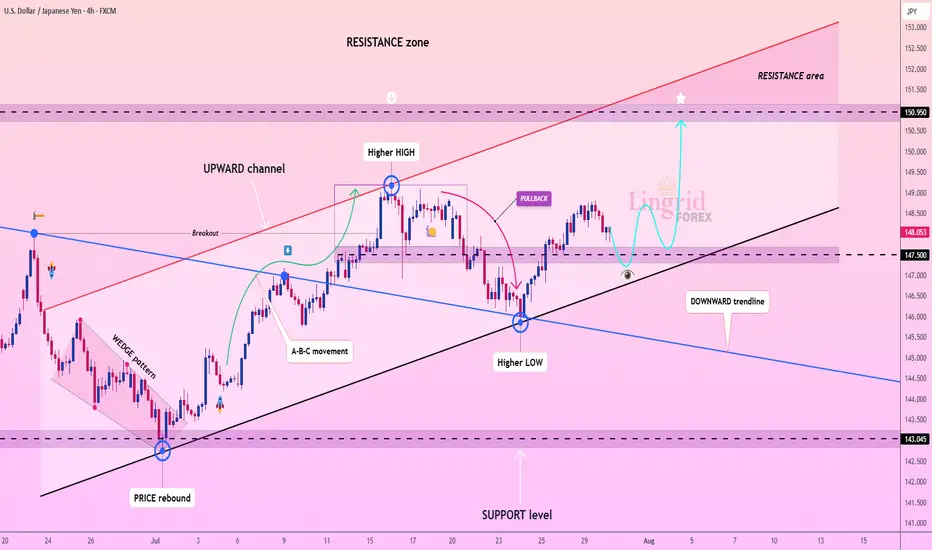
Lingrid | USDJPY Possible Strong Bullish RallyThe price perfectly fulfilled my previous idea . FX:USDJPY is trading within an upward channel after forming a higher low near the 147.50 zone, bouncing from the support trendline. Price action suggests a bullish structure continuation toward the 150.95 resistance, especially if the recent consolidation breaks higher. The overall formation aligns with a healthy correction phase before a potential push into the resistance area. Confirmation above 148.60 would likely accelerate the bullish move.
📌 Key Levels Buy zone: 147.50–147.25
Sell trigger: Below 147.00
Target: 150.95
Buy trigger: Break above 148.80
⚠️ Risks
Break below 147.50 may shift sentiment bearish
Strong resistance awaits near 150.00
Broader market volatility could invalidate pattern
If this idea resonates with you or you have your own opinion, traders, hit the comments. I’m excited to read your thoughts!
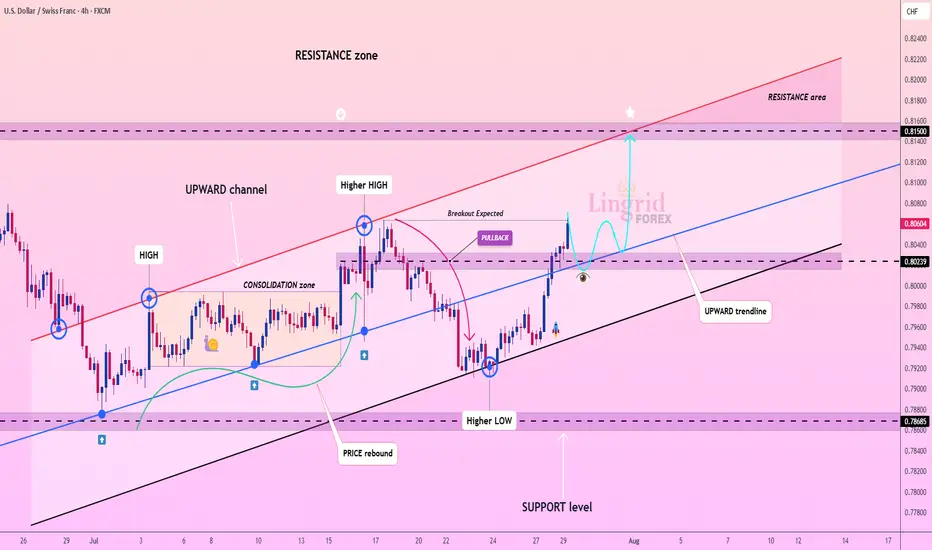
Lingrid | USDCHF Potential Bullish Move Following Level BreakoutFX:USDCHF surged from a higher low and is now retesting the broken structure near 0.802, maintaining its position within the broader upward channel. A clean bounce from this zone would confirm the bullish structure, targeting the upper channel resistance near 0.815. Pullback and higher low structure support continued upside movement with short-term consolidation possible. A breakout from the consolidation box could accelerate momentum toward the resistance area.
📈 Key Levels
Buy zone: 0.802 – 0.805
Buy trigger: Bullish confirmation above 0.805
Target: 0.815
Invalidation: Drop below 0.796
💡 Risks
False breakout near 0.805 may lead to rejection
Failure to form higher high would invalidate bullish sequence
Momentum divergence could slow rally near resistance
If this idea resonates with you or you have your own opinion, traders, hit the comments. I’m excited to read your thoughts!
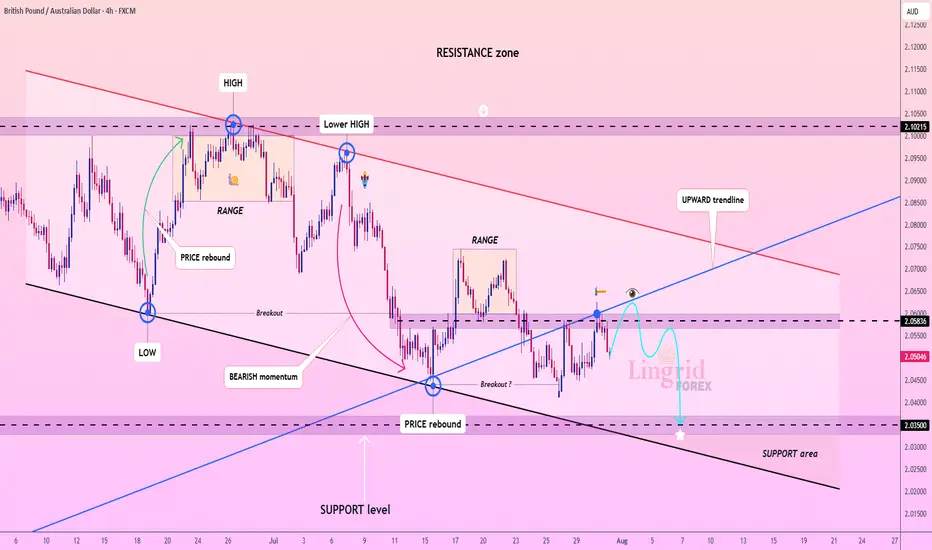
Lingrid | GBPAUD Bearish Pressure. Potential ShortThe price perfectly fulfilled my previous idea . FX:GBPAUD rebounded from support and has climbed into a tight resistance zone near 2.05836, but momentum remains weak near the downward trendline. The price structure shows a sequence of lower highs and a tight range below resistance, suggesting sellers are still in control. A rejection at this level would confirm another failed breakout attempt. If confirmed, the pair could revisit the 2.03500 support area with bearish continuation pressure.
📌 Key Levels
Sell trigger: Rejection at 2.05836 and break of 2.05000
Sell zone: 2.05800–2.06000
Target: 2.03500
Invalidation: Strong break and close above 2.06000
💡 Risks
Bullish breakout above trendline resistance
Fundamental surprise (UK/AU economic data)
Shift in broader risk sentiment or AUD weakness
If this idea resonates with you or you have your own opinion, traders, hit the comments. I’m excited to read your thoughts!
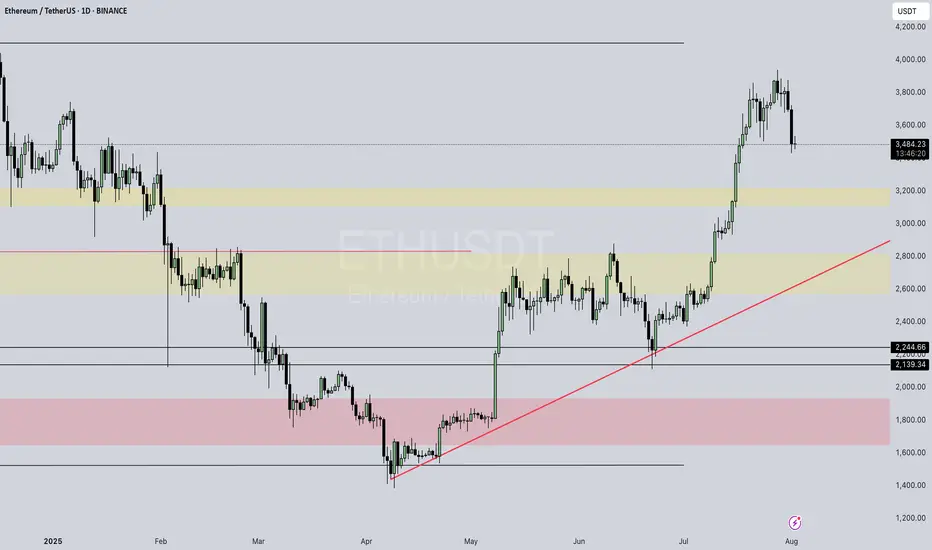
Eth / UsdtBINANCE:ETHUSDT
### 📈 **Ethereum (ETH/USDT) Update – Technical Snapshot**
💵 **Current Price:** \~\$3,490
🔺 **Intraday High:** \$3,670 | 🔻 Low: \$3,453
---
### 🧱 **Support Zones**
✅ **\$3,500–\$3,600** → Key short-term demand zone
✅ **\$3,000–\$3,200** → Strong mid-term cushion
✅ **\$2,000–\$2,500** → Long-term on-chain investor base
⚠️ **\$2,120** → If broken, risk accelerates toward \$2,000
---
### 📉 **Resistance Zones**
🚫 **\$3,860–\$3,900** → Breakout zone = Bullish confirmation
🚫 **\$4,100–\$4,500** → Major zone with historic pressure
🚀 **\$5,000–\$5,300+** → ATH targets if macro + ETF narrative holds
---
### 📊 **Strategy Overview:**
| 🧭 Scenario | 📌 Strategy |
| ------------------------ | --------------------------------------------------------------- |
| ✅ **Bullish Bias** | Hold above \$3,600 → eyes on \$3,900–\$4,000 next |
| 💥 **Breakout Play** | Clean break above \$4,500 = open skies toward \$5,000–\$5,300+ |
| 🧯 **Bearish Risk** | Below \$3,500 could revisit \$3,000 or \$2,500 support bands |
| ⛔ **Critical Breakdown** | Breach under \$2,120 = watch for strong downside toward \$2,000 |
---
### 🧠 **Final Thoughts**
ETH is in **consolidation near highs**.
• Volume & ETF inflows are key catalysts
• Indicators like **RSI, MACD, Fib zones** can help confirm setups
---
⚠️ **Disclaimer:** Not financial advice. Always **DYOR** and manage your risk wisely. 🧠📉
Lingrid | DOGEUSDT Pullback and Continuation OpportunityBINANCE:DOGEUSDT is currently testing the intersection of its upward channel support and a critical horizontal zone near 0.21378, after a steep corrective decline from the 0.28628 resistance area. The recent price action formed a rounded pullback, suggesting potential accumulation near trendline confluence. A bullish bounce here could trigger a strong rally toward 0.26350 as shown by the projected upward path. Failure to hold the 0.21000 area would expose the pair to deeper downside toward the 0.15706 support.
📌 Key Levels
Buy zone: 0.21000–0.21700
Buy trigger: Break and close above 0.23000
Target: 0.26350
Invalidation: Break below 0.21000
⚠️ Risks
Breakdown of ascending trendline support
Weak volume on upward breakout
Broader market weakness impacting altcoins
If this idea resonates with you or you have your own opinion, traders, hit the comments. I’m excited to read your thoughts!

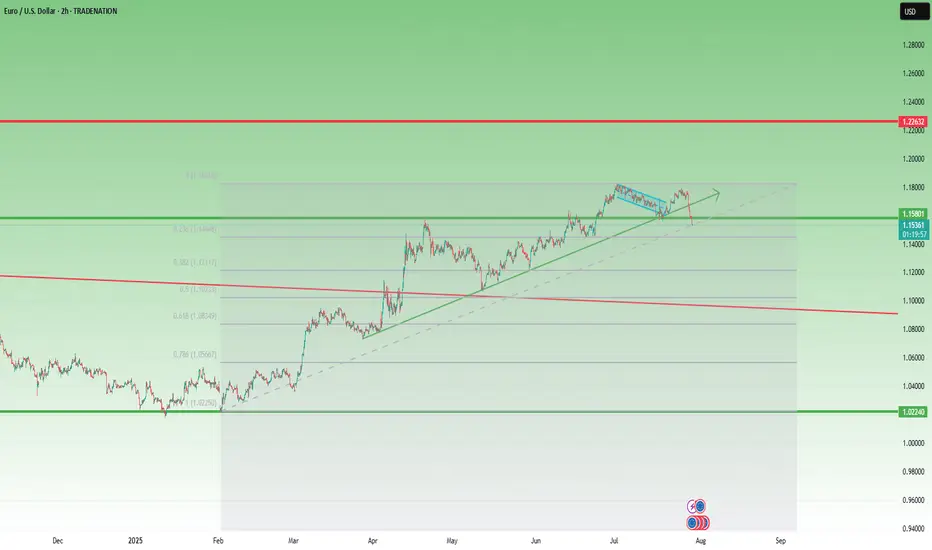
Closed Longs, Now Selling Rallies on EURUSD ReversalAs mentioned in my previous posts, I’m been bullish on EURUSD in the medium term, targeting 1.20 and even beyond.
But no pair—especially not EURUSD, which tends to move more steadily and rationally—goes up in a straight line.
________________________________________
🔹 Last week, the pair stalled just below 1.18, and I decided to close my long trade with a +150 pip gain. That proved to be a wise call, as price dropped hard shortly after.
________________________________________
📉 What’s happening now?
• EURUSD has broken below the rising trendline
• More importantly, it’s broken below the neckline of a double top pattern
• Now trading around 1.1535
This opens the door for a deeper correction, and I expect we could see a test of the 1.1150–1.1100 zone by the end of summer.
________________________________________
📌 Trading Plan:
• I’m now in sell-the-rally mode
• Ideal short entry: around 1.1650, where we also get a favorable 1:3+ risk-reward
• Watch also for interim support around 1.1400
________________________________________
Conclusion:
The bigger picture remains bullish— but this correction looks healthy and isn’t done yet.
Selling rallies makes more sense now, until the structure tells us otherwise.
Disclosure: I am part of TradeNation's Influencer program and receive a monthly fee for using their TradingView charts in my analyses and educational articles.
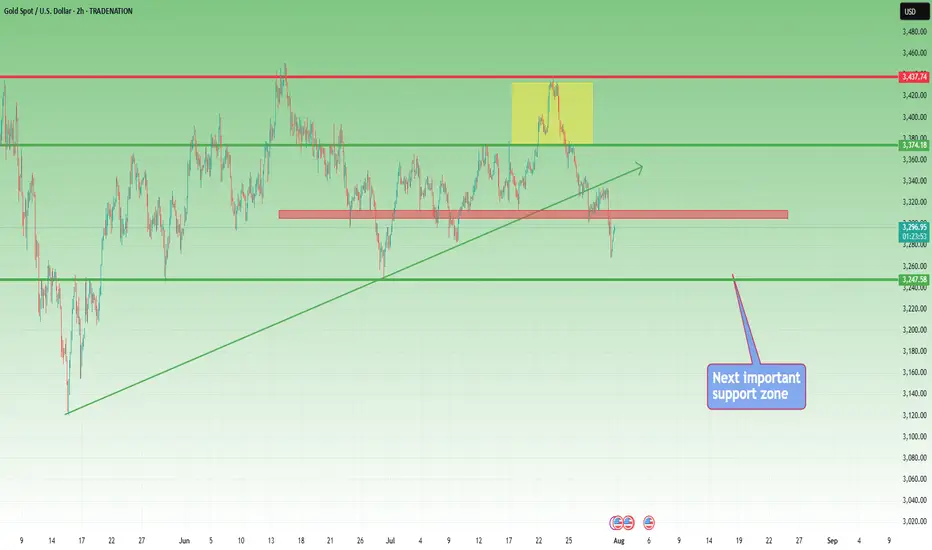
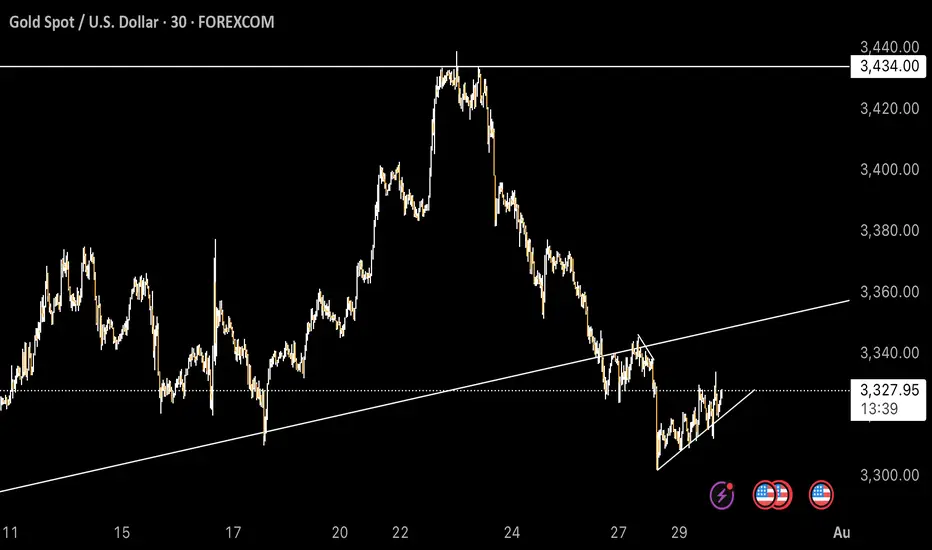
Gold next move (Read Description). Hello, Traders.
As we achieved more than 400 pips on last trade, Now I’m back with new idea for next move.
As you can see the gold is dropping since last few days.
Now the trend is bearish according Higher Time Frames and Bullish trend in Lower Time Frames, We will have to follow the Higher Time Frames to find the next move.
The market is creating the trend line buy according to H1,M30 and also respecting the trend line.
Keep in mind the trend is bearish, the gold will drop.
If the price doesn't breaks the 3347, then next move will be around 3284. If the price breaks the 3347 then gold will fly, trend will be change.
Kindly share your ideas and drop positive comments, Thanks.
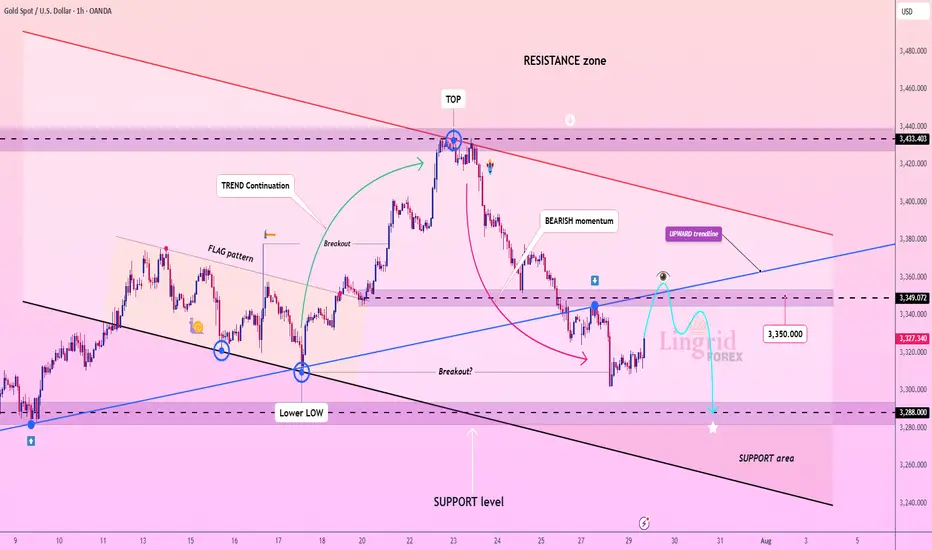
Lingrid | GOLD shorting Opportunity at Confluence ZoneThe price perfectly fulfilled my previous idea . OANDA:XAUUSD broke down sharply after forming a local top at the 3433 resistance zone, with clear bearish momentum dominating recent candles. Price is now consolidating below the broken trendline and previous structure at 3349, setting up for a possible retest and rejection. If price confirms rejection under this resistance, continuation toward the 3288 support area becomes highly likely. A lower high formation below the blue upward trendline would validate the bearish thesis.
📉 Key Levels
Sell trigger: Rejection near 3349–3350
Sell zone: 3345–3355
Target: 3288
Invalidation: Break above 3355 and trendline recovery
💡 Risks
Sudden bullish breakout could reclaim upward trendline
Support near 3288 may create a rebound
Thin liquidity could exaggerate short-term wicks
If this idea resonates with you or you have your own opinion, traders, hit the comments. I’m excited to read your thoughts!
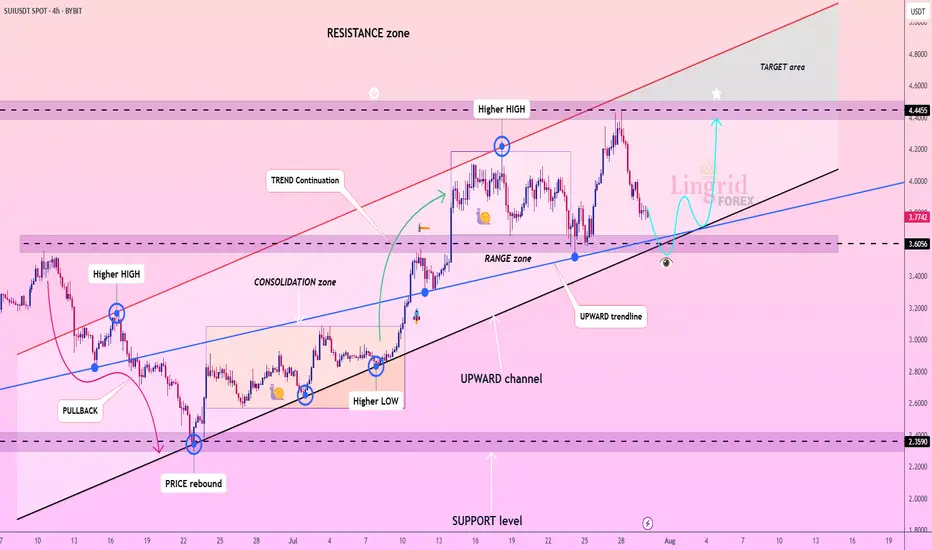
Lingrid | SUIUSDT Approaching Key Level for Potential LongBINANCE:SUIUSDT has pulled back from the 4.44 resistance but remains within a well-defined upward channel, holding above the 3.60 support zone. The structure shows higher lows with price hovering around the blue upward trendline, indicating ongoing bullish momentum. As long as 3.60 holds, buyers may regain control and push price back toward the 4.44 resistance and beyond. Momentum favors continuation as the consolidation phase near support suggests accumulation.
📉 Key Levels
Buy trigger: Break and close above 3.85
Buy zone: 3.60–3.70
Target: 4.44
Invalidation: Drop below 3.26
💡 Risks
Failure to hold above 3.26 could trigger deeper pullback.
Resistance near 4.44 may cause rejection.
Low market volume could delay breakout attempts.
If this idea resonates with you or you have your own opinion, traders, hit the comments. I’m excited to read your thoughts!
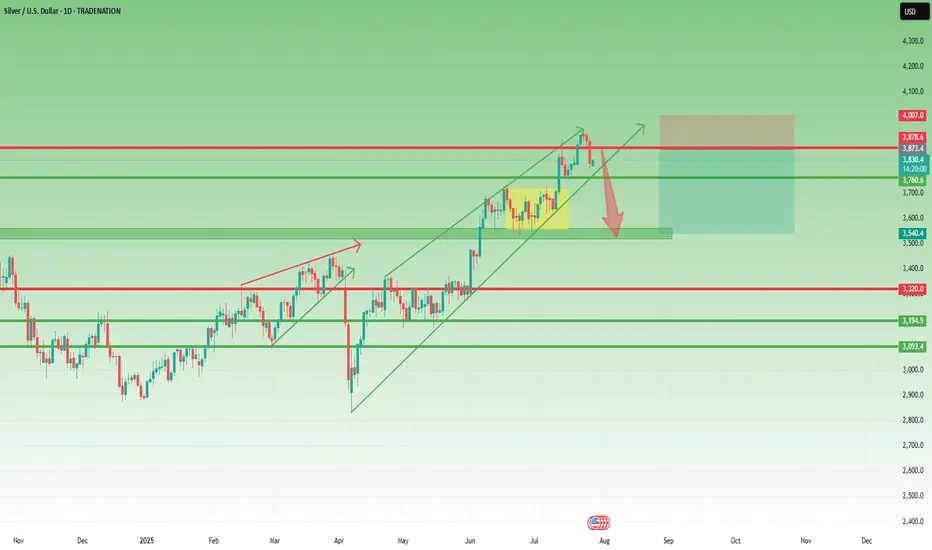
XAGUSD – Reversal Signs After the Run Toward $40Lately, I’ve been a strong advocate for a Silver rally toward $40, and indeed, we got a solid move, with price reaching as high as $39.50, not touching 40 though...
Just like with Gold, the last 3 days of last week turned bearish, and now it looks like we may be entering the early stage of a correction.
📉 Current Setup:
- The rejection from $39.50, right below the psychological $40 level, is significant
- I’ll be monitoring for a possible short entry if we get a rebound into the $38.80–$39.00 zone
- A new high above $39.50 would invalidate this setup
📌 On the downside, if price breaks below the confluence support at $37.70–$38.00, that would confirm the reversal and could lead to an acceleration toward $35.50 support
Conclusion:
The bullish narrative on Silver is pausing here. Until a new high is made, I’m looking to sell the bounce and follow the momentum if the breakdown under support is confirmed.
Let’s see how this plays out this week. 🧭
Disclosure: I am part of TradeNation's Influencer program and receive a monthly fee for using their TradingView charts in my analyses and educational articles.
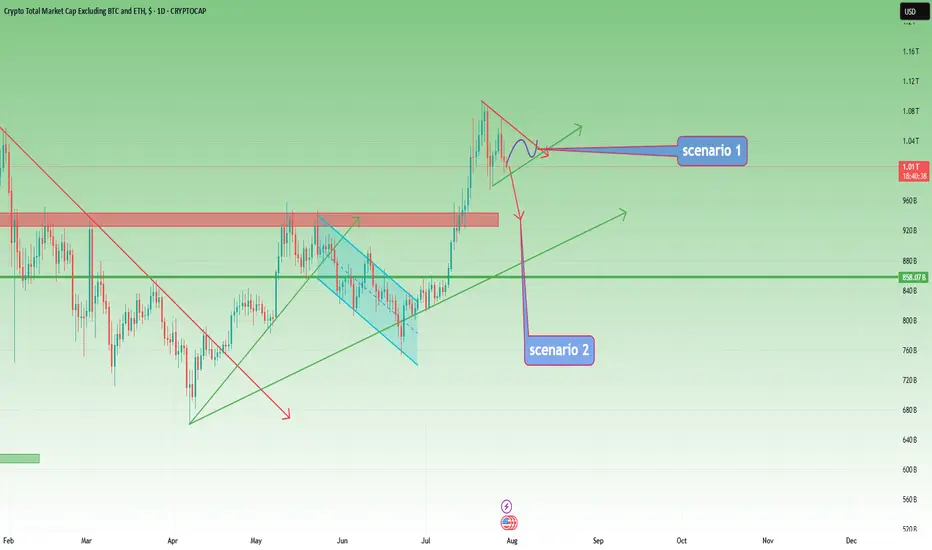
TOTAL3 – Still Bullish, But Waiting for Clarity
In my previous analysis on TOTAL3, I mentioned the high probability of a correction, but also noted that I didn’t expect the 925–940B zone to be reached.
And indeed, price reversed early — finding support around 975B before moving higher.
However, after a push up to 1.07T, the market has started to pull back again.
📊 Current Outlook – Two Scenarios I’m Watching:
Bullish Triangle:
Price may continue to consolidate into a symmetrical triangle, then resume the uptrend from there.
Deeper Pullback into Support:
The market could retest the 925–940B zone, a key support area, before bouncing back up.
⚠️ Bearish Reassessment?
Of course, if price breaks back below 925B and stays there, we’ll have to reconsider the bullish case.
But for now, the trend remains intact, and there’s no technical reason to panic.
📌 My Plan:
I already hold a bag of alts, and I’m not adding for now.
I’ll wait until the pattern becomes clearer — whether it’s a triangle breakout or a dip into support.
Until then, I’m sitting comfortably on what I already hold.
JPY at Key Zone – EURJPY & GBPJPY Could Drop 1k+ PipsExactly one year ago, the JPY Currency Index broke above the falling trendline of a falling wedge, signaling the end of a bearish cycle that had lasted nearly five years.
As is typical after long-term reversals, the reaction was sharp and fast, and the price quickly reached the first resistance target of the pattern.
Since then, the index entered a lateral phase, with clear support forming around the 730 zone.
________________________________________
🔍 Current Price Action
Recently, the price pulled back to test that same support, and at the time of writing it sits at 737, forming a tight consolidation.
This suggests we’re again at an inflection point.
________________________________________
📊 Trade Outlook
From a medium-term perspective, I believe the index is preparing for another leg higher, potentially toward resistance at 780.
➡️ That would mean a 7% rise on the JPY Index – and this move could translate into more than 1,000 pips of downside for pairs like EURJPY and GBPJPY.
________________________________________
🔄 What’s Next?
In the coming sessions, I’ll focus on these two pairs as they offer the clearest setups and have the strongest volatility.
Stay tuned — follow for the next updates. 🚀

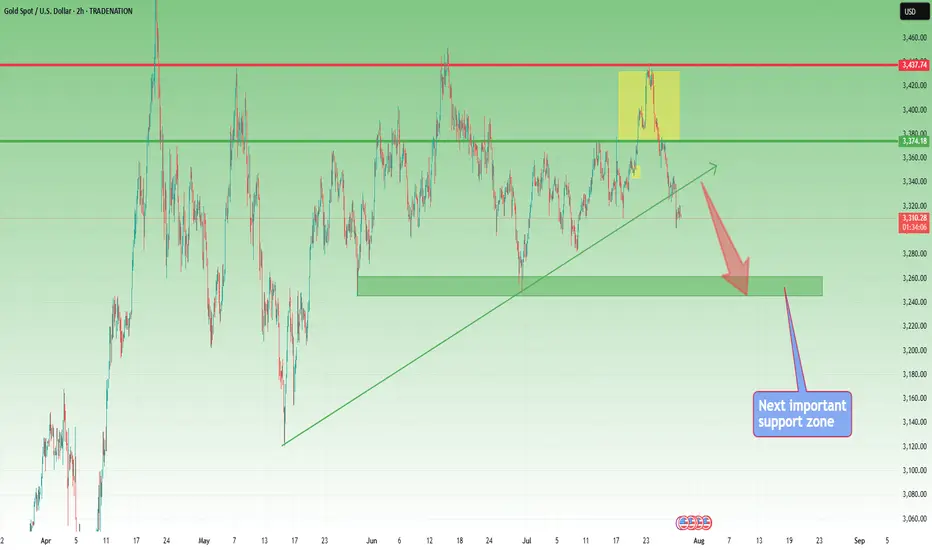
XAUUSD – Weak Rebound, Bearish Bias RemainsYesterday was a quiet and choppy day for Gold.
Although price managed to recover a small portion of last week’s 1400 pip drop, the rebound remains anemic — price barely reached the 23% Fibonacci retracement.
To make things worse for the bulls, the recovery from around $3300 is starting to take the shape of a bearish flag, a continuation pattern that typically signals further downside ahead.
📌 Resistance Zones to Watch:
- Initial resistance: $3345–3350
- Stronger resistance: $3370, a level already proven and well-defined
As long as the price is under those levels, I remain firmly bearish.
📈 Trading Plan:
I already have a short position open, and I'm still waiting to add more, preferably on a push into higher resistance, ideally above $3345.
No need to force entries — I’d rather scale in on strength, not weakness.
Once the correction is complete, I’m targeting:
- $3280 as the first support
- $3250 as a realistic downside objective
Conclusion:
The rebound lacks power. The structure favors the bears.
Still watching for better entries to add short, with eyes on 3280 and 3250 as likely targets.
Let’s stay patient and let the setup come to us. 🎯
Disclosure: I am part of TradeNation's Influencer program and receive a monthly fee for using their TradingView charts in my analyses and educational articles.

XAUUSD – Bears in Control, but Watch for a Rebound FirstYesterday, after a small bounce from the ascending trendline, Gold broke down and printed an intraday low around $3300.
Right now, the market appears bear-dominated, and further downside continuation is likely in the coming days.
________________________________________
📉 But there’s a catch:
From last week's top, Gold has dropped over 1400 pips without any meaningful correction.
That opens the door for a possible short-term rebound, which could be just a setup for new short entries.
________________________________________
📌 Key levels to watch:
• First resistance: $3350
• Major resistance: $3375 – Only a daily close above this level would shift control back to the bulls
🎯 Until then, any bounce is an opportunity to sell into strength.
A break below $3300 opens the path to $3280, with a likely extension toward $3250.
________________________________________
Conclusion:
The trend is bearish, but don’t chase.
Wait for a corrective rally, then look to sell the rip—unless bulls reclaim $3375, it’s still a bear market.
Let’s see if Gold gives us the setup. 🎯
Disclosure: I am part of TradeNation's Influencer program and receive a monthly fee for using their TradingView charts in my analyses and educational articles.
Lingrid | HYPEUSDT Potential Continuation After PullbackKUCOIN:HYPEUSDT is bouncing from a higher low near the 42.070 zone after breaking a descending flag pattern. Price action remains above the ascending support trendline while pressing into a key structure retest. As long as GETTEX:HYPE stays above 42, a bullish leg toward the 49.700 resistance remains likely. Structure suggests a resumption of the impulse phase within the broader uptrend.
📉 Key Levels
Buy trigger: Clean breakout above 45.00
Buy zone: 41.5 – 43.0 (support + flag bottom)
Target: 49.700
Invalidation: Close below 40.00
💡 Risks
Breakdown below the ascending support would weaken the bullish setup
Failure to reclaim mid-flag resistance may lead to deeper consolidation
Broader market weakness in altcoins could delay breakout momentum
If this idea resonates with you or you have your own opinion, traders, hit the comments. I’m excited to read your thoughts!

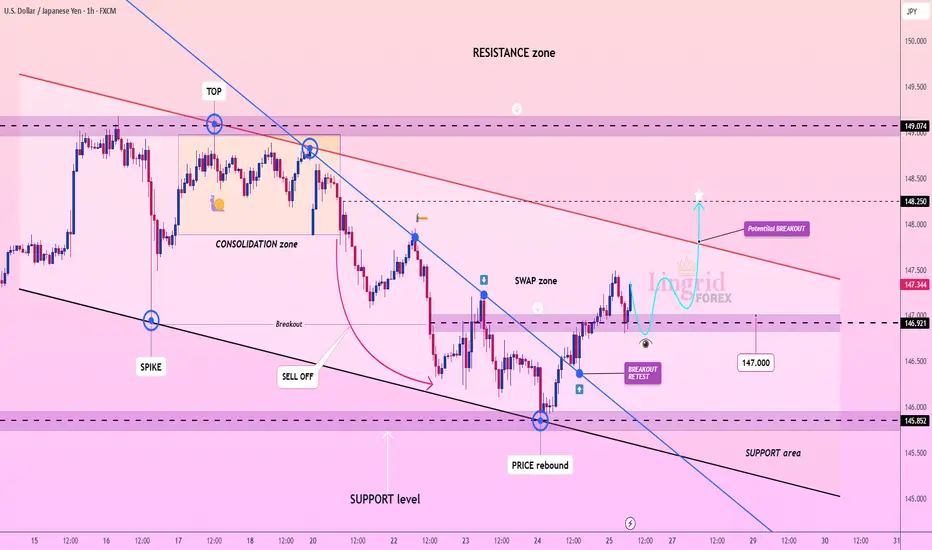
Lingrid | USDJPY Potential Channel Breakout. LongFX:USDJPY is retesting the breakout zone after reclaiming support from a prior swap area near 146.9. Price action has broken above a downward trendline and is forming a bullish retest structure. As long as USDJPY holds above 146.920 zone, the setup favors a continuation toward the resistance barrier. A breakout above the red descending trendline could accelerate upside momentum.
📉 Key Levels
Buy trigger: Break and hold above 147.500
Buy zone: 146.900 – 147.000
Target: 148.250
Invalidation: Break below 146.000
💡 Risks
Failure to break the descending red trendline may trigger renewed selling
Consolidation below resistance could signal buyer exhaustion
Break below 146.000 would invalidate bullish retest setup
If this idea resonates with you or you have your own opinion, traders, hit the comments. I’m excited to read your thoughts!
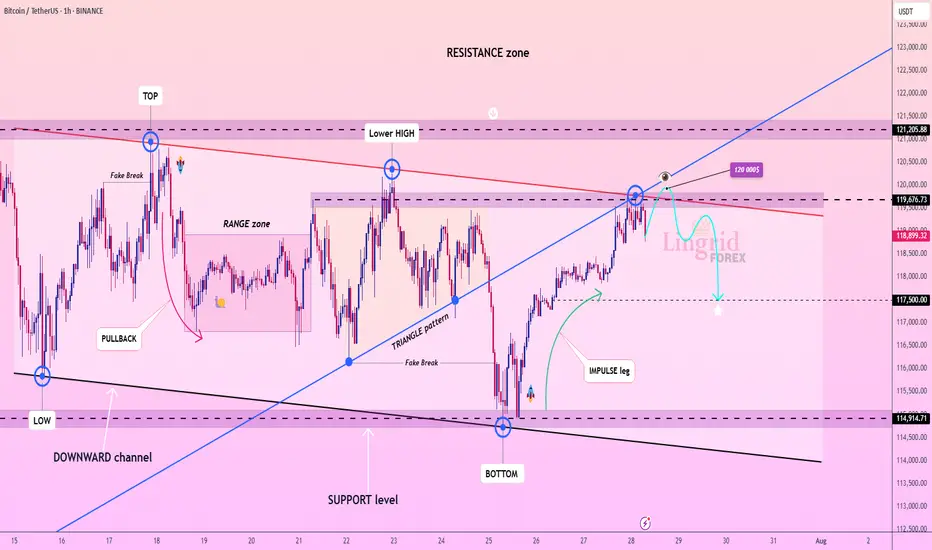
Lingrid | BTCUSDT Range-Bound Market: Short-Term Bearish MoveBINANCE:BTCUSDT has failed to break through the descending resistance near 120,000 and is now forming a lower high within the broader resistance zone. The price action follows an impulsive leg up and is currently tracing a potential reversal pattern under key structural resistance. As long as the market remains capped below 120,000, continuation toward 117,500 is likely. The downward bias is supported by weakening momentum after the bull trap and resistance rejection.
📉 Key Levels
Sell trigger: Breakdown below 119,000
Sell zone: 119,400 – 120,000
Target: 117,500
Invalidation: Break and close above 120,500
💡 Risks
Sudden bounce from the 119,000 handle could trap late sellers
Breakout above 120,000 would shift structure to bullish
Support near 117,500 may slow or reverse bearish pressure
If this idea resonates with you or you have your own opinion, traders, hit the comments. I’m excited to read your thoughts!