Lingrid | TONUSDT Buying OPPORTUNITY in the ACCUMULATION Zone OKX:TONUSDT saw a sharp sell-off from the double top near 3.59, but the price rebounded from the 2.88 support zone, forming a potential accumulation structure. The current setup suggests a consolidation just below the key resistance at 3.25, aligning with the descending trendline. A breakout above this level would confirm bullish momentum and open room for further upside. Until then, the 3.03–3.05 area remains a tactical range for accumulation.
📈 Key Levels
Buy zone: 3.00 – 3.05
Buy trigger: breakout above 3.25 resistance
Target: 3.25
Sell trigger: failure to hold above 3.00
💡 Risks
Continued rejection at the descending trendline caps upside.
A clean break below 2.88 would invalidate the bullish scenario.
Market-wide volatility may distort breakout signals.
Traders, if you liked this idea or if you have your own opinion about it, write in the comments. I will be glad 👩💻
Signalservice

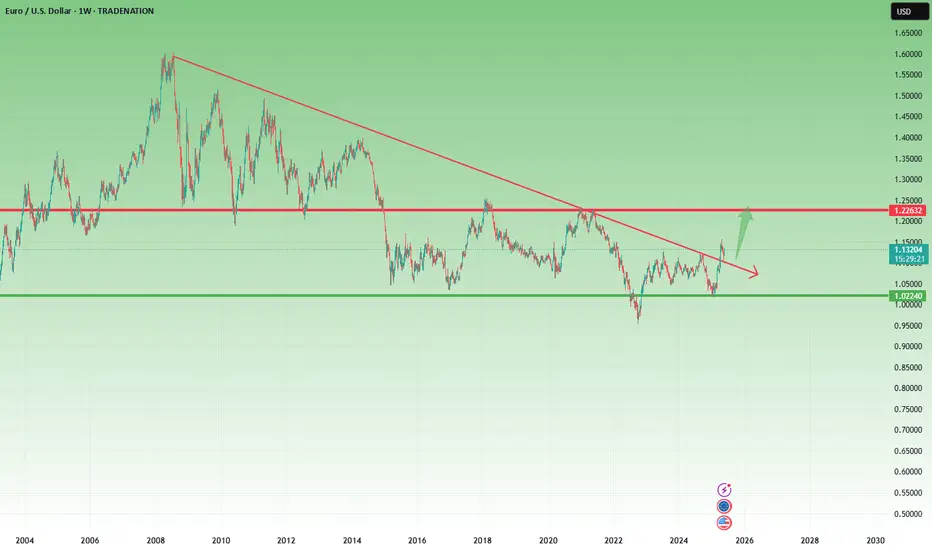
Big Picture Shift: EURUSD Bulls Eye 1.23–1.25 Zone📊 EURUSD – Has the Long-Term Trend Finally Reversed?
Since the 2008 all-time high at 1.60, EURUSD has been in a persistent downtrend, dropping all the way below parity in September 2022.
Following the recovery back above parity, the pair has been range-bound in a 700-pip channel for nearly two years. And while early 2025 brought a sharp decline toward the 1.02 zone, this move was quickly reversed, forming what now looks like a higher low relative to the sub-parity bottom.
❓ The big question: Is the long-term trend now bullish?
There are several signs supporting this idea:
✅ From 2008 to 2014, the pair formed a massive descending triangle, which eventually broke to the downside.
✅ The area around 1.05 held as a long-term support, and price began trading in a broader range with 1.22–1.23 resistance.
✅ The break below parity could now be interpreted as a false breakdown, with the strong reversal from 1.02 this year confirming the historical support zones from 2015 and 2017.
✅ Most importantly, the recent push to 1.1550 could be the first higher high on the long-term chart — a potential signal that the downtrend of nearly two decades is ending.
🎯 Conclusion and Long-Term Target
In my view, the long-term trend has shifted. The structure now favors bullish continuation, and my primary target on the long term is the 1.23–1.25 zone.
Disclosure: I am part of Trade Nation's Influencer program and receive a monthly fee for using their TradingView charts in my analyses and educational articles.
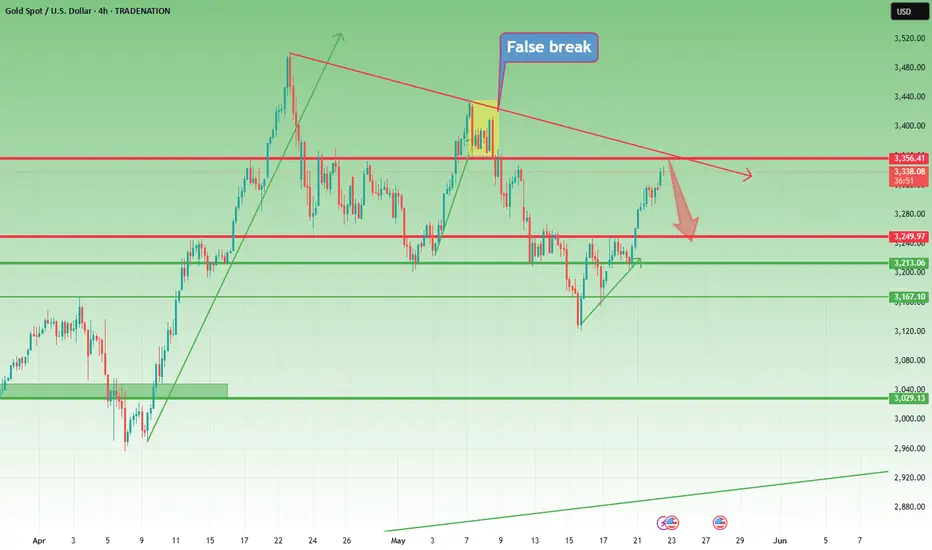
Gold Hits 3360 Resistance After Breakout – Reversal Ahead?📈 Gold Breaks Out – Now Approaching Key Resistance
Two days ago, I highlighted the ascending triangle forming on Gold and warned that a breakout could lead to strong acceleration in the direction of the move.
As expected, price broke to the upside and rallied 1,000 pips, confirming the bullish breakout.
🧱 B ut now, Gold faces a major test...
Price is now approaching a critical confluence resistance zone around 3360, where I expect a possible reversal.
Given the recent pattern of strong two-way volatility, a pullback from here could send Gold back down to retest the broken 3250 zone — now acting as support.
📊 Trading Plan:
I’m watching closely for signs of weakness near 3360 to open short trades. This level is key for both bulls and bears, and price action here could define the next move.
Disclosure: I am part of Trade Nation's Influencer program and receive a monthly fee for using their TradingView charts in my analyses and educational articles.
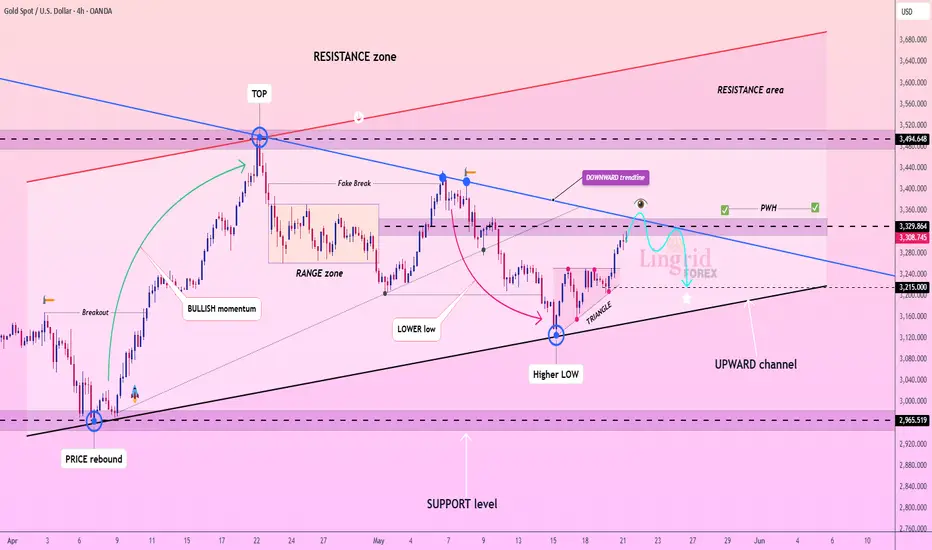
Lingrid | GOLD Range RESISTANCE Short SetupThe price perfectly fulfilled my previous idea . OANDA:XAUUSD bounced from the higher low and is now testing the key resistance around 3330, where the downward trendline intersects the prior weekly high (PWH). Price remains within the broader upward channel, but signs of rejection could lead to a retest of the 3215 support area. Bulls must reclaim and hold above the descending trendline to regain control. A failure here would confirm another lower high and open downside risk.
📈 Key Levels
Buy zone: 3215 – 3230
Buy trigger: breakout above 3330 and trendline retest
Target: 3494
Sell trigger: rejection from 3330 resistance
💡 Risks
Macro catalysts (FOMC, CPI) could trigger volatility.
Repeated failure to reclaim trendline may deepen bearish pressure.
Higher low remains valid unless 3215 breaks decisively.
Traders, if you liked this idea or if you have your own opinion about it, write in the comments. I will be glad 👩💻
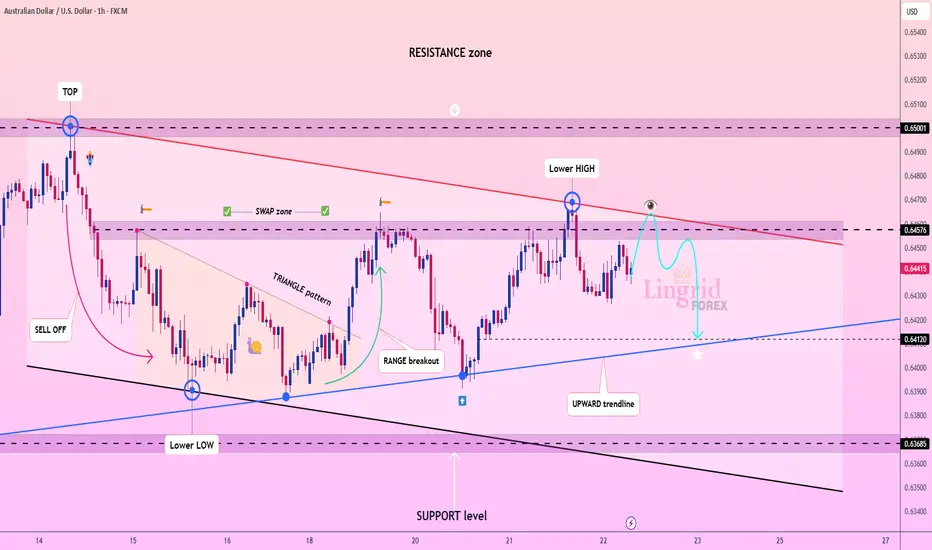
Lingrid | AUDUSD sideways Market POTENTIAL Short EntryThe price perfectly fulfilled my previous idea . FX:AUDUSD facing resistance near the 0.6450–0.6460 area, marked by a lower high under the descending red trendline. After a breakout from the triangle pattern, price showed strength but failed to sustain above the swap zone. Now it's forming a potential lower high setup, suggesting weakening momentum. If price fails to clear resistance, it could rotate back toward 0.6412 support and below.
📉 Key Levels
Sell trigger: rejection near 0.6450
Buy zone: 0.6412
Target: 0.6368
Buy trigger: reclaim of 0.6460 with strong bullish candles
💡 Risks
A break above the descending trendline would shift structure bullish.
U.S. dollar weakness could invalidate the bearish thesis.
Data surprises may cause sharp volatility spikes.
Traders, if you liked this idea or if you have your own opinion about it, write in the comments. I will be glad 👩💻
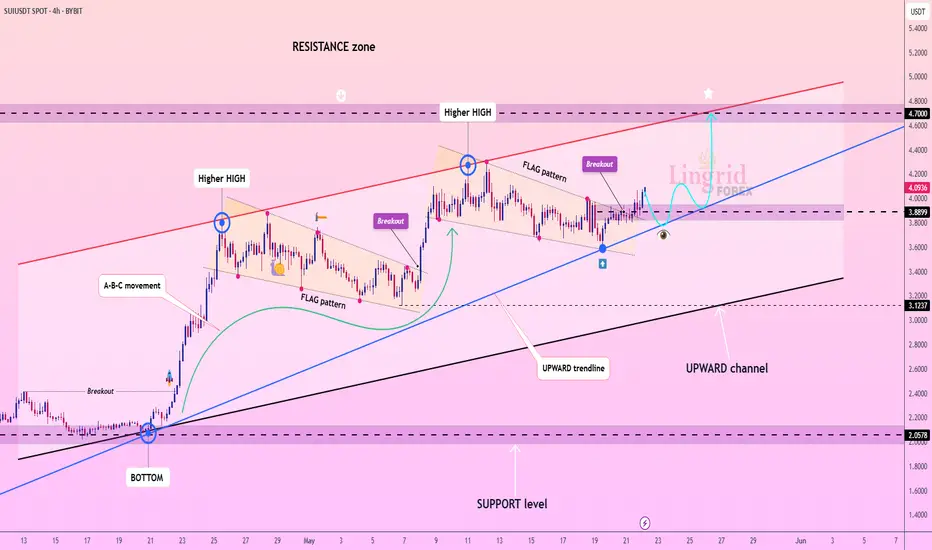
Lingrid | SUIUSDT Pattern Building For BULLISH ExtensionBINANCE:SUIUSDT is building strength along the upward trendline after breaking out of a flag pattern. Price is holding above the key support at 3.89, preparing for another potential push toward the upper resistance channel around 4.70. The structure remains bullish with successive higher highs and solid trendline defense. A clean bounce here could confirm continuation toward the top of the resistance zone.
📈 Key Levels
Buy zone: 3.85 – 3.90
Buy trigger: bounce from trendline support
Target: 4.70
Sell trigger: loss of 3.85 and breakdown below trendline
💡 Risks
Market-wide corrections may invalidate the local bullish setup.
Multiple failed breakouts near 4.20 may create short-term overhead pressure.
Rejection from the red channel top again would signal exhaustion.
Traders, if you liked this idea or if you have your own opinion about it, write in the comments. I will be glad 👩💻
Potential Selling Opportunity on Gold from 3374 level!Hello traders, 👋
I’m closely watching Gold (XAU/USD) for a possible short setup around the 3374 zone, and here’s my breakdown:
📉 Trend Structure:
Gold continues to respect its bearish market structure, consistently forming Lower Highs (LHs) and Lower Lows (LLs) — a clear sign of sellers maintaining control.
📐 Key Confluence at 3374:
Price is currently retracing toward a descending trendline that perfectly aligns with the 78.6% Fibonacci retracement level, drawn from the previous swing highs. This confluence zone strengthens the case for a potential reversal.
📍 Sell Zone:
I’m watching the 3360–3380 region, with 3374 being my preferred level to look for entries.
Entry Confirmation:
Before executing a trade, I’ll be waiting for:
A bearish engulfing candle
A bearish breaker block
Or a strong rejection pin bar on the lower timeframes
🎯 Targets:
TP1: 3321
TP2: 3253
TP3: 3210
🔒 Risk management is key – always wait for confirmation before entering!
Let me know what you think in the comments — agree or disagree? 👇
Trade safe and stay sharp!

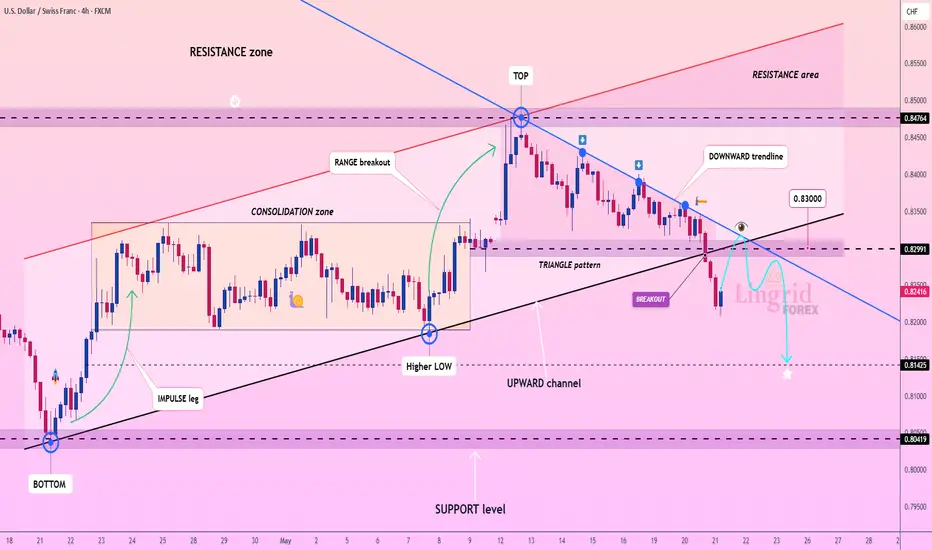
Lingrid | USDCHF channel Breakout: SELLING OpportunityThe price perfectly fulfills my previous idea . FX:USDCHF recently broke below both its upward channel and triangle support, confirming a bearish shift in momentum. The price is now retesting the $0.8299 zone, which aligns with the underside of the broken structure and a key confluence point near the descending trendline. If rejected here, the pair could extend losses toward the next major support around $0.8140. Sellers remain in control unless price reclaims the $0.8300 region decisively.
📈 Key Levels
Sell trigger: rejection from $0.8299 – $0.8300
Target: 0.8140
Buy zone: none while under trendline
Buy trigger: strong recovery above $0.8300
💡 Risks
False breakdown could lead to quick recovery rally.
Broader USD strength may invalidate the bearish setup.
Consolidation near $0.8300 may delay directional clarity.
Traders, if you liked this idea or if you have your own opinion about it, write in the comments. I will be glad 👩💻
Lingrid | TRXUSDT Trend Continuation FormationBINANCE:TRXUSDT remains in a clear uptrend, bouncing within its upward channel and forming higher lows. After a strong rally, price is consolidating around the $0.2680 support near the trendline, with signs of a bullish continuation pattern. A break above $0.2750 could fuel momentum toward the $0.2865 resistance zone. As long as price respects the rising trendline, the structure favors buyers.
📈 Key Levels
Buy zone: 0.2680 – 0.2710
Buy trigger: rebound from trendline support
Target: 0.2865
Sell trigger: break below 0.2680
💡 Risks
Loss of trendline support could shift bias short-term.
Broader market pullbacks may suppress TRX upside.
Weak breakout could lead to fakeout and reversal.
Traders, if you liked this idea or if you have your own opinion about it, write in the comments. I will be glad 👩💻

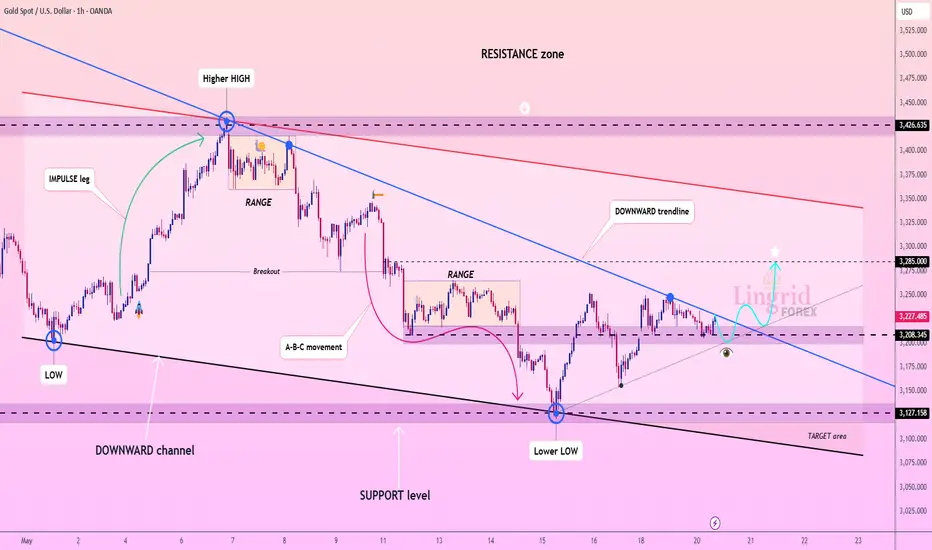
Lingrid | GOLD Potential Near-Term BULLISH MomentumOANDA:XAUUSD is attempting to stabilize just above the $3,208 zone after forming a lower low inside the downward channel. Price is compressing between the support base and descending trendline, signaling potential for breakout if buyers reclaim $3,225. A successful retest and push above this level could trigger a rally toward $3,285. Bulls will likely remain in charge if the structure holds above $3,208.
📈 Key Levels
Buy zone: 3,208 – 3,225
Buy trigger: breakout and hold above descending trendline
Target: 3,285
Sell trigger: drop below 3,208
💡 Risks
Fed comments or rate surprises may jolt gold direction.
Sharp rebound in USD could undermine gold recovery.
Rejection from trendline may resume the bearish structure.
Traders, if you liked this idea or if you have your own opinion about it, write in the comments. I will be glad 👩💻
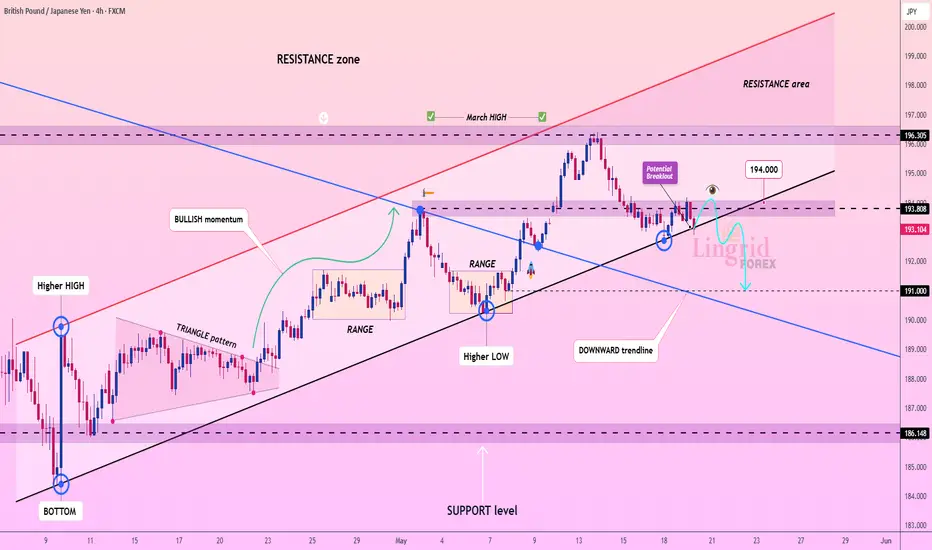
Lingrid | GBPJPY possible Channel BREAK Bearish MoveThe price perfectly fulfilled my last idea . FX:GBPJPY is consolidating after a strong rally toward the March high. Price is now testing support near 193.8, where the ascending trendline and prior breakout zone converge. A failure to hold this level may open the door for a drop toward 191.000. However, bulls remain in control while price stays above trend support.
📈 Key Levels
Buy zone: 193.0 – 193.8
Buy trigger: bounce from trendline with bullish momentum
Target: 196.3
Sell trigger: break below 193.0
💡 Risks
Weak UK data may trigger bearish sentiment.
Yen strength due to safe-haven flows could pressure GBPJPY.
Break of trendline may lead to deeper correction below 191.
Traders, if you liked this idea or if you have your own opinion about it, write in the comments. I will be glad 👩💻
Lingrid | ADAUSDT Bullish Pattern Continuation from SUPPORTBINANCE:ADAUSDT is pulling back after forming a local top near the $0.81 resistance. Price is now drifting toward a confluence support zone around $0.70–0.71, where the upward trendline meets previous breakout levels. If buyers step in here, a rebound could propel price back toward the upper range at $0.81. Holding above this support keeps the bullish channel structure intact.
📈 Key Levels
Buy zone: 0.7000 – 0.7088
Buy trigger: bullish reaction from channel support
Target: 0.8100
Sell trigger: break below 0.7000
💡 Risks
BTC volatility could drag alts lower.
Break below the trendline may signal broader weakness.
Low trading volume near support could cause false breakouts.
Traders, if you liked this idea or if you have your own opinion about it, write in the comments. I will be glad 👩💻

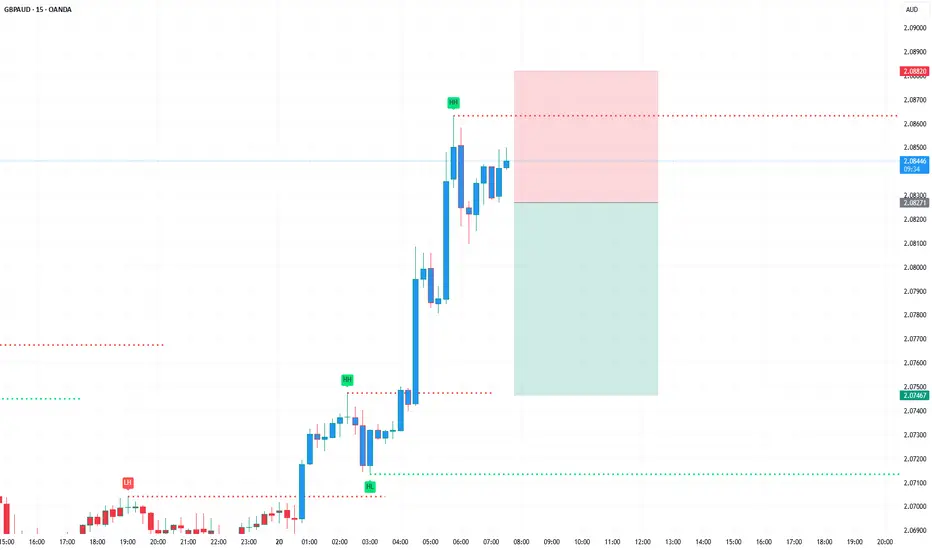
GBPAUD sell Setup nice potentialGBPAUD sell Setup nice potential.
of course this is my view, not recommendation
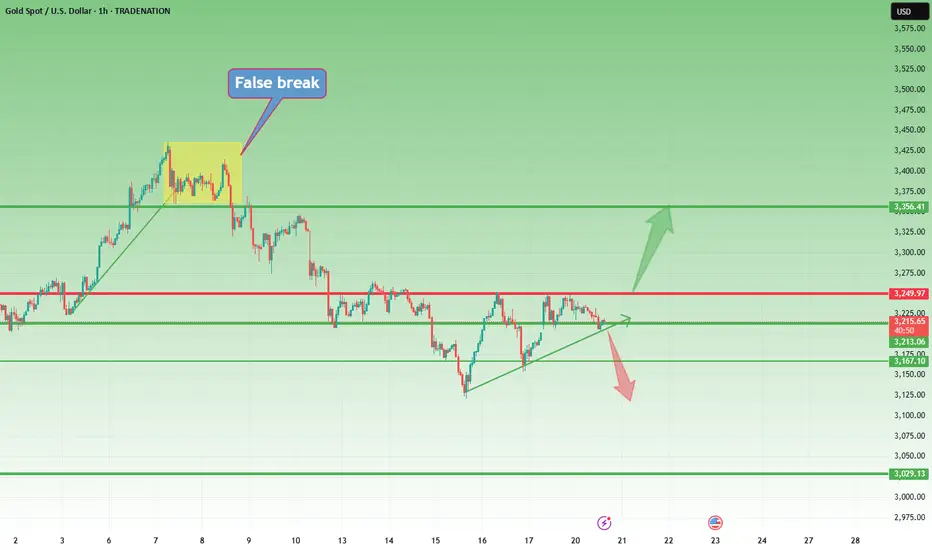
Gold Stuck Between 3250 and 3200 – Watch the Breakout!After another week filled with violent price swings, Gold started this week on a much calmer note. Yesterday, after filling the Asia open gap, price pushed up to test the 3250 resistance, only to reverse and fall back toward the 3210 support zone.
🔺 A triangle is forming… but which way will it break?
Since last Thursday, price action has been forming an ascending triangle — a pattern that typically favors upside breakouts.
But for this to play out, we need a clean break above 3250. If that happens, we could see a fresh 1,000 pips move up in the short term.
📉 What if 3200 fails again?
A break back below 3200 would cancel the bullish structure and likely send price toward the 3160 support, or even further down to the 3100 zone.
📊 Trading Plan:
For now, I remain on the sidelines, waiting for a clear breakout in either direction. No need to rush — the breakout should bring strong momentum either way.
Disclosure: I am part of Trade Nation's Influencer program and receive a monthly fee for using their TradingView charts in my analyses and educational articles.
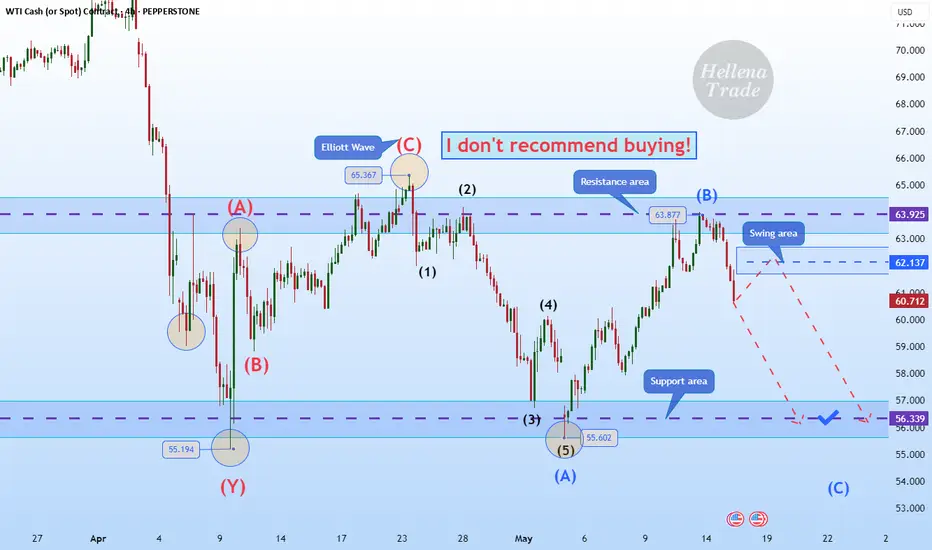
Hellena | Oil (4H): SHORT to support area of 56,339.Colleagues, I was watching the price and was expecting a pattern for a reversal downtrend. I still expect a downward movement and believe that the price is in a combined correction.
This means that wave “B” has been formed and I expect wave “C” to reach at least the 56,339 area.
Manage your capital correctly and competently! Only enter trades based on reliable patterns!
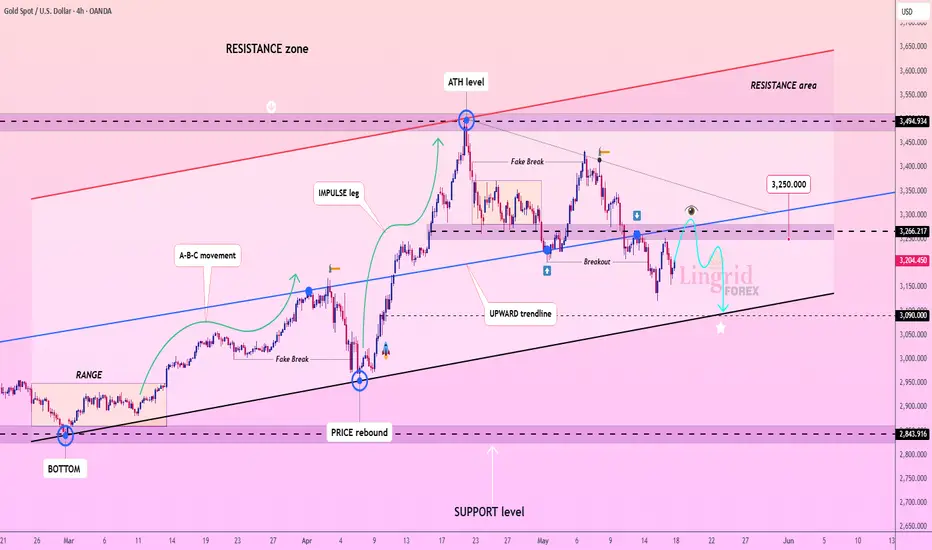
Lingrid | GOLD Weekly MARKET Outlook: From ATH to Range-BoundOANDA:XAUUSD market is currently in a critical consolidation phase following its all-time high level. The recent price action shows a significant pullback with a close below both the last 4 weeks' low and the previous higher low. This isn't necessarily a reversal but rather a structural shift toward a range-bound market dynamic. The chart clearly illustrates a completed impulse leg that reached the resistance zone, followed by what appears to be developing into a corrective move.
The upward trendline that has supported the entire rally from the bottom around 2843 remains intact despite recent weakness. This suggests the longer-term bullish structure hasn't been invalidated yet, though it's currently being tested. The recent break below 3260 is particularly significant as it represents a break of support that had previously acted as a foundation for bullish price action. This suggests a deeper correction may unfold before the next structural move can develop.
Fundamentally, this pullback may be attributed to several factors including stabilizing geopolitical tensions, pausing the tariff war, or profit-taking after the substantial run-up. While the gold market has clearly shifted from its parabolic advance to a consolidation phase, the overall structure remains constructive for eventual continuation higher once this correction completes.
Traders, if you liked this idea or if you have your own opinion about it, write in the comments. I will be glad 👩💻
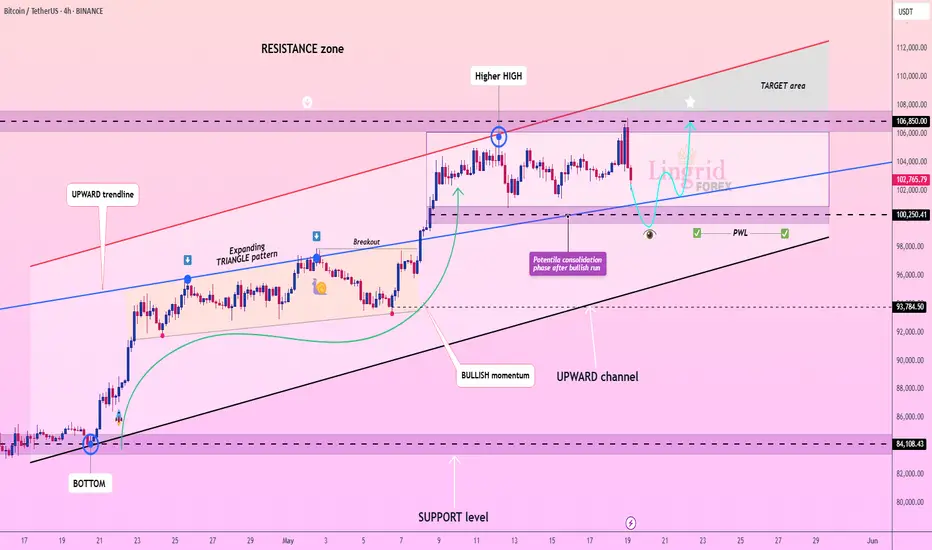
Lingrid | BTCUSDT Consolidation DIP Buying OpportunityBINANCE:BTCUSDT completed an expanding triangle breakout and reached a higher high within the resistance zone. After the bullish run, price pulled back toward the $100,250 level and may enter a brief consolidation phase above the upward channel’s midline. If support holds, bulls may aim for $106,850 to test the upper boundary of the channel.
📌 Key Levels
Support: $100,250
Midline Guide: $102,000–$103,000
Target: $106,850
⚠️ Risks
Rejection from the resistance band may trap buyers
Falling below $100K could shift bias short-term
Low volatility may delay breakout attempts
Traders, if you liked this idea or if you have your own opinion about it, write in the comments. I will be glad 👩💻
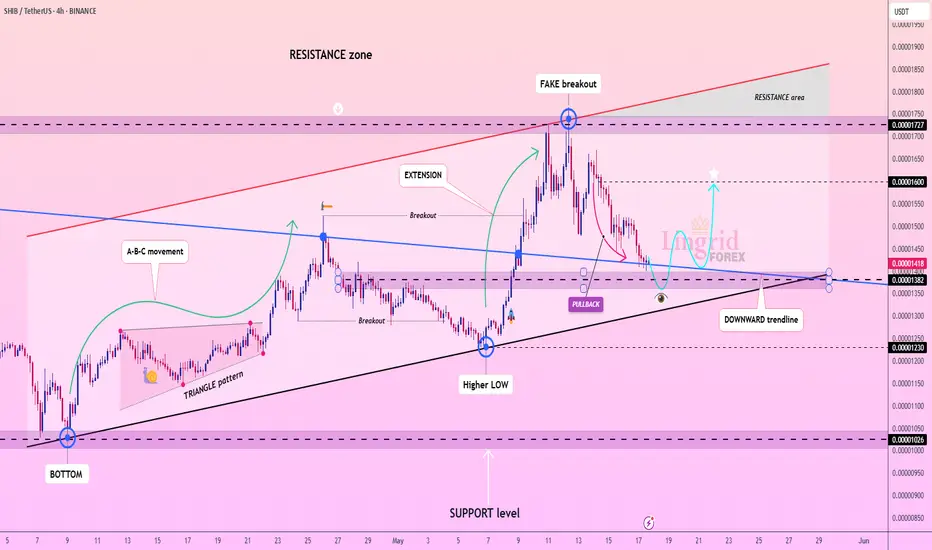
Lingrid | SHIBUSDT long OPPORTUNITY after PULLBACKThe price has perfectly fulfilled my previous forecast . BINANCE:SHIBUSDT saw a strong rally with an A-B-C structure and triangle breakout, leading to a fake breakout above the resistance zone. After the rejection at the red resistance line, the price pulled back to retest the ascending black trendline, which now aligns with the 0.00001382 level. A bounce here could push price back toward the 0.00001600 target if support holds.
📌 Key Levels
Support: 0.00001382
Intermediate Target: 0.00001600
Resistance: 0.00001727
⚠️ Risks
Breakdown below the trendline could retest 0.00001230
The blue downward trendline may act as short-term resistance
Weak volume could invalidate the breakout attempt
Traders, if you liked this idea or if you have your own opinion about it, write in the comments. I will be glad 👩💻
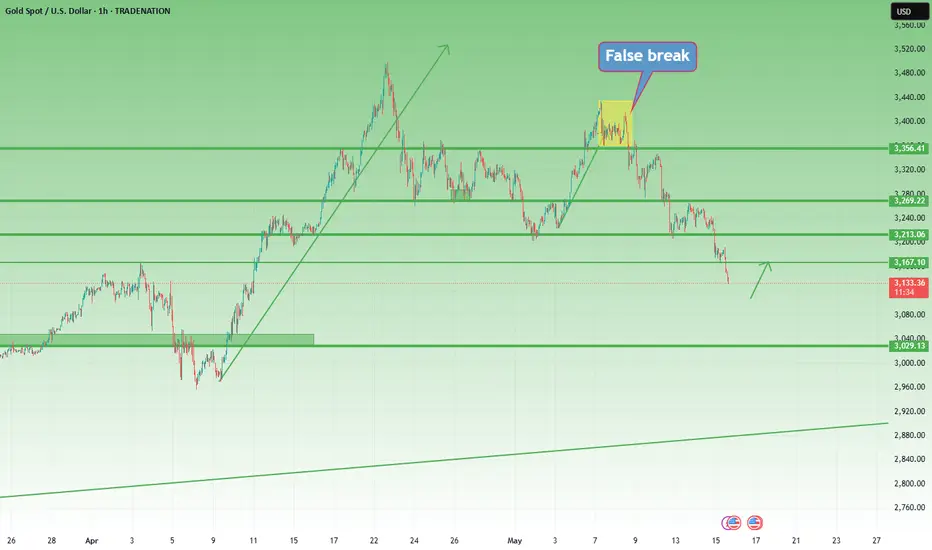
Lingrid | GOLD Weekly Low False Breakout. Possible LongThe price perfectly fulfilled my previous idea . OANDA:XAUUSD after a steep selloff from the top, OANDA:XAUUSD formed a new lower low just beneath the black support trendline, potentially faking out the weekly low. A bounce has begun, and if momentum holds, the price could reclaim the blue downtrend line, eyeing the $3,290 zone as a bullish target.
📌 Key Levels
Support: $3,111.81
Mid-range: $3,171.05
Resistance Target: $3,290.00
⚠️ Risks
Failure to hold above $3,171.05 may signal trend weakness
Blue trendline may act as resistance
Possible fakeout below support could trap bulls
Traders, if you liked this idea or if you have your own opinion about it, write in the comments. I will be glad 👩💻

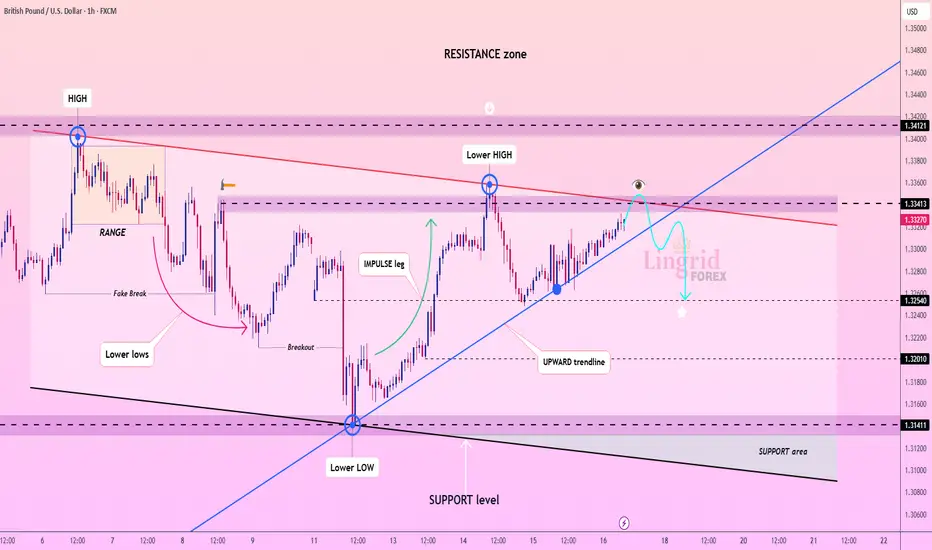
Lingrid | GBPUSD retest the RESISTANCE zone and FALLFX:GBPUSD price is approaching the confluence of the red resistance trendline and the $1.334 level after an extended climb along the upward trendline. Despite short-term bullish momentum, this zone has acted as a strong barrier in the past. A rejection here could signal the start of a local correction toward $1.325 or lower.
📌 Key Levels
Support: $1.32540
Resistance: $1.33413
Reversal Zone: Red trendline near $1.334
⚠️ Risks
Breakout above $1.334 could invalidate the reversal setup
Momentum remains bullish above the blue trendline
Failure to reject the red trendline may shift bias to breakout continuation
Traders, if you liked this idea or if you have your own opinion about it, write in the comments. I will be glad 👩💻
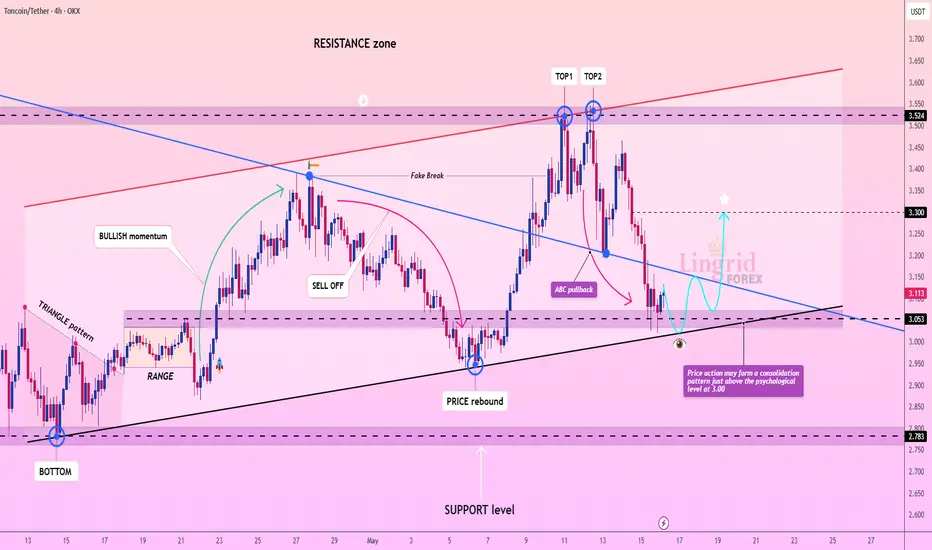
Lingrid | TONUSDT buying OPPORTUNITY from SUPPORT zoneOKX:TONUSDT found support just above the $3.00 psychological level after a double top formation triggered a sharp correction. Price is currently hovering near the upward trendline and may enter a consolidation phase before attempting a rebound. A successful break above the descending trendline could open the way toward $3.30.
📌 Key Levels
Support: $3.00
Resistance: $3.30
Potential Breakout Trigger: Descending trendline above $3.15
⚠️ Risks
Failure to hold $3.00 could expose the $2.78 support
Bearish continuation if the descending trendline resists breakout
Market indecision near psychological levels may lead to volatility
Traders, if you liked this idea or if you have your own opinion about it, write in the comments. I will be glad 👩💻
2000+ Pips Down This Week – Can Gold Finally Breathe?Yesterday, Gold continued its aggressive drop and, as expected, broke below the key 3200 level, reaching the 3165 support zone and even exceeding it — trading now around 3136.
The move that started on Monday is extremely sharp — more than 2,000 pips lost in just a few days — and follows the same pattern we've seen recently: rapid, volatile swings.
________________________________________
❓ Is this the bottom, or will the fall continue?
At this stage, calling a bottom is risky. There is no clear sign of exhaustion on higher timeframes, and Gold remains vulnerable.
________________________________________
📌 What I’m watching now:
• Lower timeframes (M30–H1) for signs of a temporary reversal
• Potential bullish divergence
• Watching for spikes down followed by sharp reversals to the upside as potential long entries — aiming to catch a short-term correction within the broader downtrend
________________________________________
📊 Trading Plan:
For now, I will wait for a possible upside correction, but I won’t rush in. If signs of a bottom emerge, I might catch a short-term bounce, with tight risk.
Disclosure: I am part of Trade Nation's Influencer program and receive a monthly fee for using their TradingView charts in my analyses and educational articles.
Lingrid | GOLD ABC Complete - REVERSAL SetupThe price perfectly fulfilled my previous idea . OANDA:XAUUSD touched the lower boundary of its descending channel near $3,108 and showed signs of a short-term bounce. The A-B-C correction appears complete, and buyers may attempt a rebound toward the $3,220 level. However, overall market structure remains bearish unless a breakout above the upper trendline confirms reversal.
📌 Key Levels
Support: $3,108
Resistance: $3,220
Structure: Descending channel with lower highs and lows
⚠️ Risks
Rejection near $3,220 could reinforce bearish control
Failure to hold $3,108 opens room toward deeper support
Bearish macro pressure from DXY or rate expectations could limit upside potential
Traders, if you liked this idea or if you have your own opinion about it, write in the comments. I will be glad 👩💻
