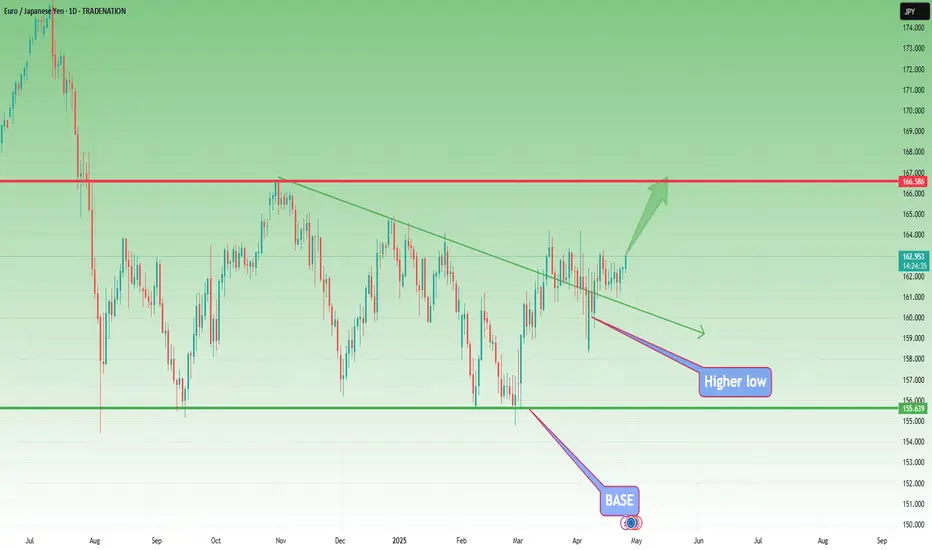
EurJpy- Ready to rise at 166?Since mid-March, EURJPY has been in a consolidation phase. Except for the early April spike down, the pair has respected a pretty clear range between the 161.00 support and the 163.30 resistance.
Now, however, EURJPY looks ready to break to the upside. A sustained price above 163.30 would confirm this breakout and open the door for bullish momentum.
🔍 My strategy:
I’m looking to buy dips, ideally around the 162.50 area.
If the price drops and breaks below 161, that would invalidate the setup.
On the upside, the first major target is the 166.00 resistance zone.
Disclosure: I am part of Trade Nation's Influencer program and receive a monthly fee for using their TradingView charts in my analyses and educational articles.
Signalservice
USDJPY – Searching for a Bottom After a Brutal DropSince the start of the year, USDJPY has been in an almost free fall, losing nearly 2,000 pips and breaking multiple key supports, including the critical 150 level.
Yesterday, we even saw a spike below 140, a level not touched for quite some time.
🔄 However, after that spike, the pair reversed sharply to the upside, showing strong demand in that area.
Interestingly, this zone was tested at the start of 2024 and again back in September, adding even more technical relevance.
📊 Despite the poor outlook for the USD overall, I now expect a meaningful rebound from here, aiming for a retest of the former 146 support, which has now turned into resistance.
💡 Trading Plan:
I will be looking to buy dips near the current support, targeting a 1:3 Risk/Reward setup toward the 146 resistance area.
Disclosure: I am part of Trade Nation's Influencer program and receive a monthly fee for using their TradingView charts in my analyses and educational articles.

Gold Analysis – New Leg of Correction Incoming?It’s been a “special” week for Gold, with wild swings that kept me mostly on the sidelines – except for Monday’s take profit. Now, however, the market is starting to show more clarity.
❓ Has the Market Topped Out?
After a dip to 3260, the price reversed sharply, gaining over 1,000 pips to reach 3367. Yet, both recent attempts to push higher were rejected.
Now, with the spike from 3360 to 3500 looking like a blow-off top, the stage seems set for a new leg of correction.
🔍 Key Technical Signs:
• Heavy selling pressure near recent highs.
• Price action suggests buyers are exhausted.
• 3370 becomes a key resistance – as long as it holds, bearish setups are favored.
📉 Trading Plan:
My approach is simple:
👉 Sell rallies
🎯 Target: a 1,000+ pip drop if 3370 remains intact.
Disclosure: I am part of Trade Nation's Influencer program and receive a monthly fee for using their TradingView charts in my analyses and educational articles.
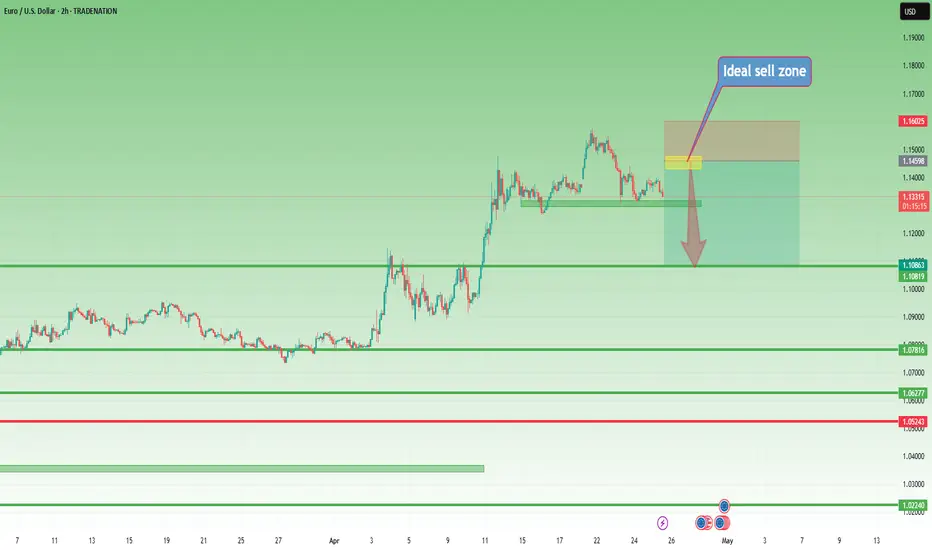
EUR/USD: Is the Uptrend Losing Steam?EUR/USD has had an exceptionally strong month, gaining over 7% from bottom to top – one of the best performances in EUR’s history against the dollar.
But now, things are starting to shift.
🧭 Possible Long-Term Trend Change?
Beyond the impressive rally, the bigger story might be the potential shift in the long-term trend. However, after such a sharp move up, a correction is not only likely – it may already be underway.
🔍 Technical Outlook:
- Price pushed above the key 1.15 psychological level but failed to hold momentum.
- A bearish consolidation is forming.
- A classic Head and Shoulders pattern appears to be developing, with a neckline near 1.13.
- A break of that level could open the door for a deeper retracement, with a target around 1.11.
🛠️ Trading Plan:
I’m looking to sell rallies, ideally near 1.1450, to maintain a 1:3 risk-to-reward ratio.
Disclosure: I am part of Trade Nation's Influencer program and receive a monthly fee for using their TradingView charts in my analyses and educational articles.
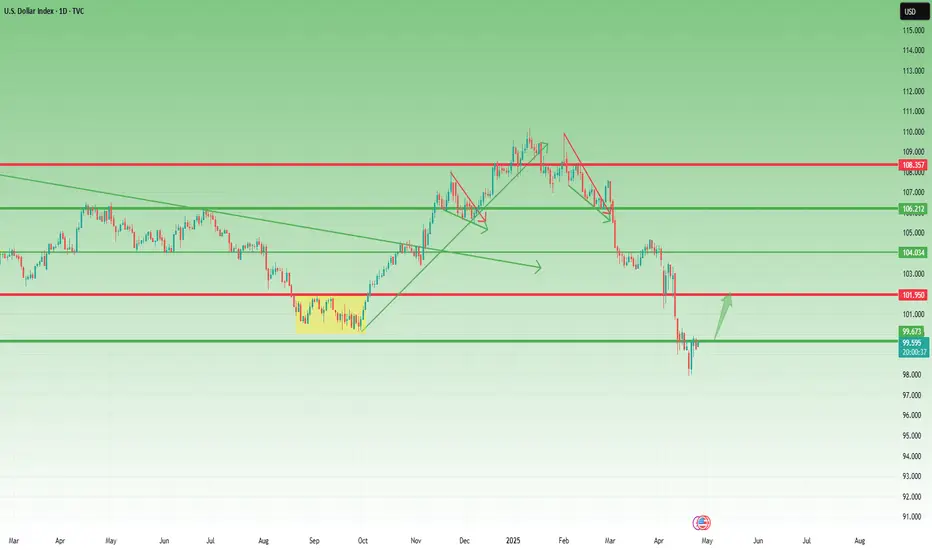
USD Index: A Possible Reversal in Sight?Since early February, right after Trump’s inauguration, the USD Index (DXY) has been under pressure, falling sharply by over 10%.
However, after hitting the 98.00 level, things seem to have stabilized. We're seeing the early signs of a relief rally.
🔍 Technical Perspective:
- This week’s candlestick pattern suggests a bullish reversal.
- The dip on Wednesday was quickly bought, showing buyer interest.
- A minor correction occurred yesterday, but dips are being well supported.
- Currently, the DXY trades around 99.60, just under the psychological level of 100.
🎯 Outlook:
As long as 98 remains intact, the bias shifts towards a potential rebound.
First target: 102 – a logical resistance zone and prior support.
This is not yet a confirmed trend reversal, but the price action is shifting. The key now is how the market reacts around the 100 level. A break above could trigger further bullish momentum.
Lingrid | GOLD correction Phase Following RESISTANCE RejectionOANDA:XAUUSD market bounced off the resistance and dropped, creating approximately a -6% correction after the previous bullish momentum. Price action formed a gap which was subsequently filled. Notably, this corrective move mirrors a similar pattern observed at the beginning of this month when the market also corrected by -6.6%. Currently, the price is testing the previous week's high area, which may establish itself as a support zone. Following such a rapid decline, price typically enters a consolidation phase - we might see sideways movement around the 3300 level for some time. However, if we get a rejection candles forming at current levels, I expect the price to move higher and retest the recent resistance zone. My goal is resistance zone around 3500
Traders, if you liked this idea or if you have your own opinion about it, write in the comments. I will be glad 👩💻

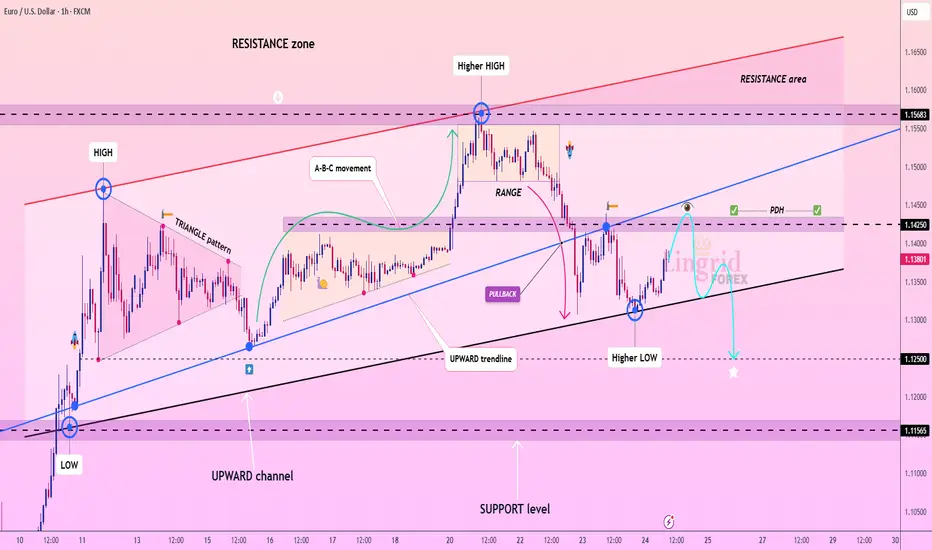
Lingrid | EURUSD short-term BEARISH move after RESISTANCE bounceFX:EURUSD hit the resistance at 1.15000 with significant force before bouncing off it. On the 1H timeframe, the market is forming an ABC pullback pattern, suggesting price may decline further toward the 1.12000 support level. Taking a broader view, we can observe the potential a head and shoulders pattern, which remains valid as long as price stays below the upward trendline. I think the market will retest the area below the previous week's low if price breaks through the upward channel. Given that the price entered a consolidation zone, I expect possible continued downward movement in the near term. My goal is support zone around 1.12500
Traders, if you liked this idea or if you have your own opinion about it, write in the comments. I will be glad 👩💻
Lingrid | AVAXUSDT Bullish TREND with KEY Support ZoneBINANCE:AVAXUSDT market is making higher highs, demonstrating a clear bullish trend on the current timeframe. The price has reached the previous resistance zone where it formed a pullback. This time, the price may pull back again toward the psychological level at 20.00. I expect the price to find support and bounce at the confluence of three technical factors: the support level, the previous week's high, and the upward trendline. This triple support zone could provide a solid foundation for continuation of the bullish move. My goal is resistance zone around 23.50
Traders, if you liked this idea or if you have your own opinion about it, write in the comments. I will be glad 👩💻

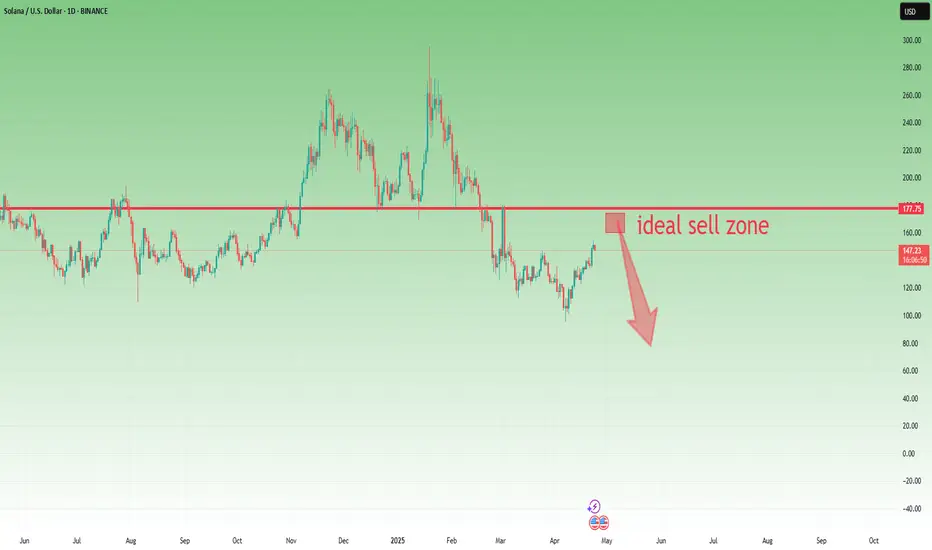
Solana – Bear Market Rally or Reversal?Like the rest of the crypto market, Solana started rebounding on April 8th, pushing more than 50% up from the recent lows. But just like with many altcoins, I'm not convinced this is a true trend reversal. Instead, it looks more like a classic bear market rally.
Let’s not forget: SOL is coming down from nearly $300. A bounce from $95 to $150 is strong, yes—but in the bigger picture, it’s still just a correction.
📍 Key resistance zone: $160–$170
As long as price remains under this zone, the probability of another leg down remains high.
🧠 My plan:
If Solana creates a new local high around $160, I’ll be looking to sell into the rally.
🎯 Target:
$100 at least, depending on how the market reacts.
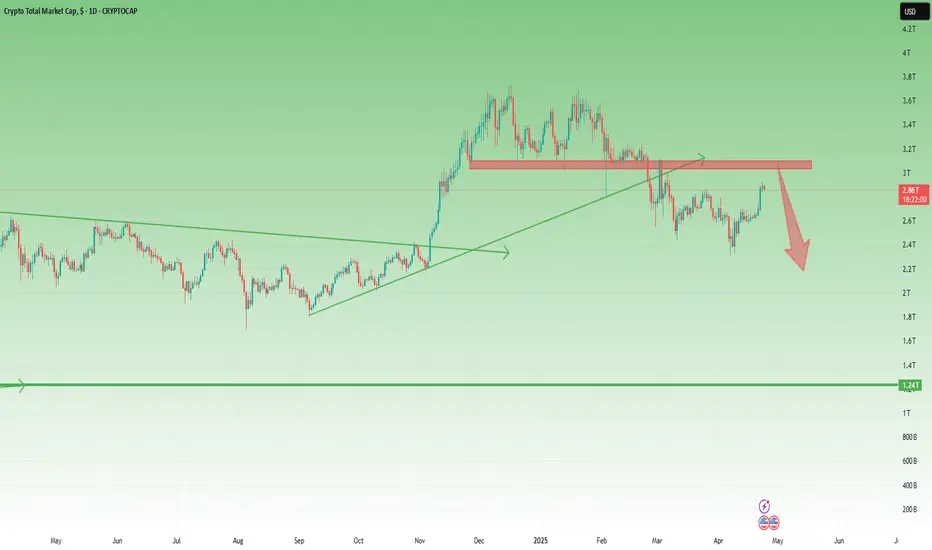
Crypto Euphoria Is Back, But Should It Be?📈 Bitcoin is back above 90k and the crowd is cheering again: moons, 150k by summer, non-stop hopium.
But is the overall picture that bullish? Not even close.
📊 Looking at the Total Market Cap chart :
- After that long November to late February consolidation, Total finally broke below the 3T support
- We retested the break and new local lows followed
- The recent bounce? Looks corrective, not impulsive
- And we’re still trading below 3T and with good percentages
❗ Conclusion:
I’m not buying into the hype.
In fact, I’m expecting a new leg lower – possibly all the way to 2T
📌 Trading Focus:
Shorting Solana and ETH
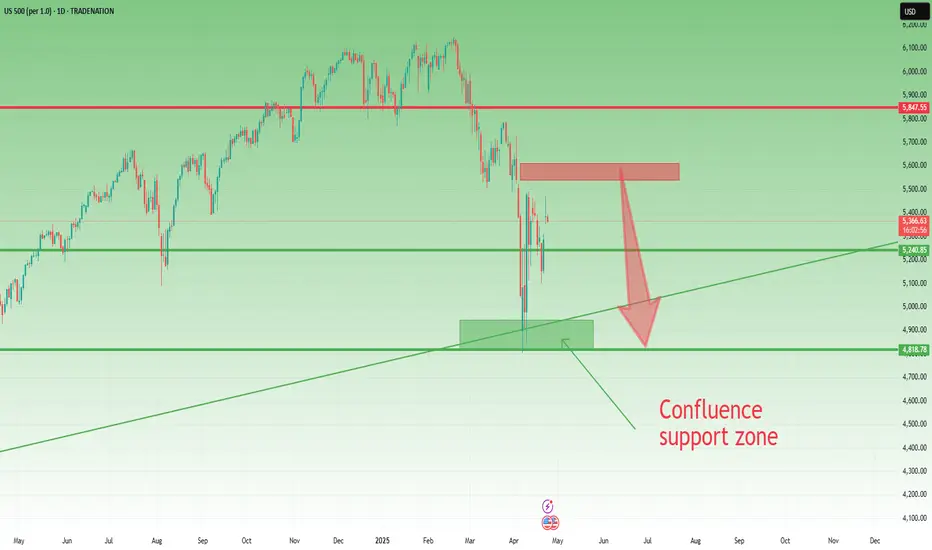
SP500 remains very bearish overall📈 In my previous post, I highlighted the confluence support zone and the potential for a bounce — and we got it. SP500 rallied around +10% off the lows.
But let’s not get too comfortable...
❓ I s the worst behind or is this just a trap before the next leg down?
From my perspective, the correction is not over.
The current bounce looks more like a bear market rally than a true reversal.
📉 Why I expect another drop:
1. Technically, as long as SP500 is trading below 5500-5600 zone, the structure remains bearish
2. Fundamentally, the backdrop hasn’t improved — if anything, it’s getting worse
3. Price is approaching a major resistance zone, which I plan to sell into
📌 My Plan:
I’m watching this zone for signs of weakness.
If momentum fades, I’ll look to short, targeting at least 5k, potentially even a new local low.
Disclosure: I am part of Trade Nation's Influencer program and receive a monthly fee for using their TradingView charts in my analyses and educational articles.
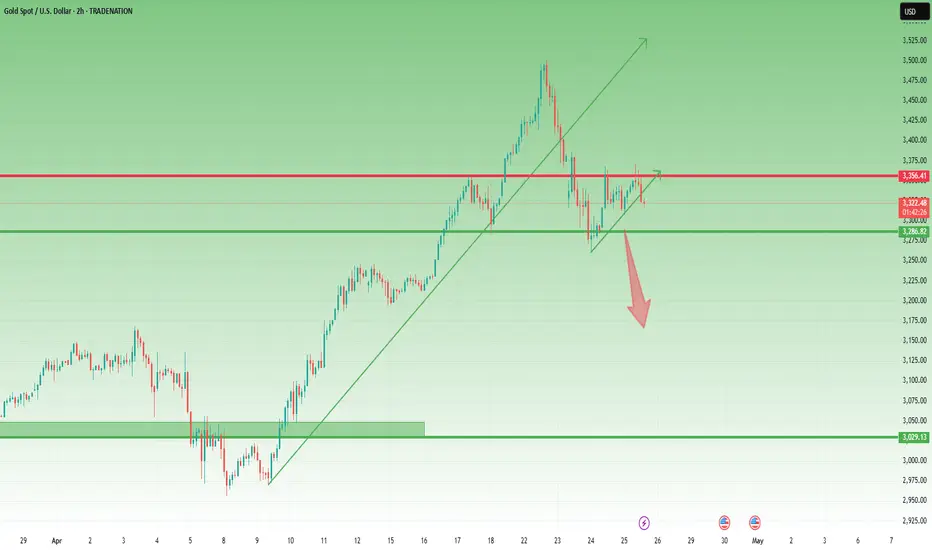
GOLD – Will the Correction Continue or Is It Over?📉 What happened yesterday?
Gold extended its drop and touched a low around 3260. A recovery of around 1000 pips followed — a typical day for Gold lately, just daily noise...
However, during the Asian Session, selling pressure kicked in again and we’re now seeing fresh weakness.
❓ Has Gold finished correcting or is there more to come?
That's the big question. And the answer might lie in the 3300 zone — specifically the 3285–3300 range. Why? Because this is where the last powerful bullish impulse started, the one that took Gold to kiss the 3500 level.
🔍 Why continuation of the correction is still possible:
- We’re seeing a retest of support, not a new higher low – this weakens the bullish case.
- The Asian Session high lines up with the old ATH, potentially forming a Head and Shoulders pattern – not confirmed, but worth watching.
At least the market madness of the past days has now given us clearer levels to work with:
→ Below 3280 = further downside possible, with 2k pips target if H&S confirms
→ Above 3350 = likely trend resumption, aiming again for 3500
📌 My trading plan:
Even though I always work with 2 scenarios, I usually have a preferred one. It's not the case at this moment, so I'm still out.
- If I see momentum above 3350, I’ll look to buy.
- If I see a break under 3300 with confirmation, I’ll look to sell continuation.
Disclosure: I am part of Trade Nation's Influencer program and receive a monthly fee for using their TradingView charts in my analyses and educational articles.

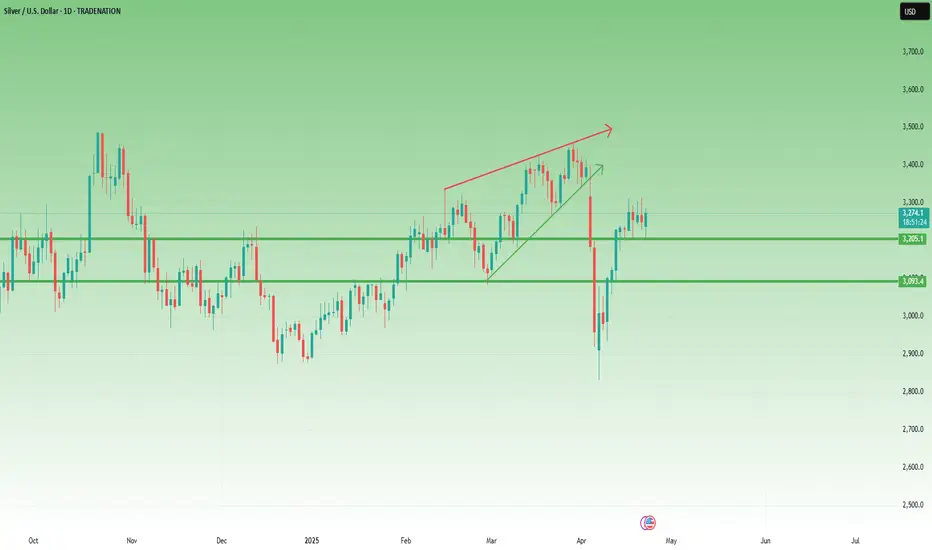
Silver Update – April Rollercoaster Ends in Bullish Setup?What a month it has been for Silver also!
In early April, the metal broke down from a rising wedge pattern, triggering a waterfall drop of around 6,000 pips. The plunge took us right into the 28 zone, but the reversal that followed was nothing short of spectacular.
In just two trading days, Silver rocketed back above the key 30 level, and the rally didn’t stop there. By mid-month, it reclaimed the 32 support – a level previously broken during the drop.
📉 Last week, however, price action turned quiet compared to the volatility in Gold, with Silver entering a tight consolidation.
But here’s the key point:
➡️ Despite the sharp early-month drop, the structure is now bullish again and remains so as long as 32 holds.
💡 Trading Plan:
I'm looking to buy dips near 32 in anticipation of a breakout above 33.15 – the upper boundary of the recent consolidation.
If that level gives way, Silver could accelerate its gains and make a new attempt toward 35.
Disclosure: I am part of Trade Nation's Influencer program and receive a monthly fee for using their TradingView charts in my analyses and educational articles.
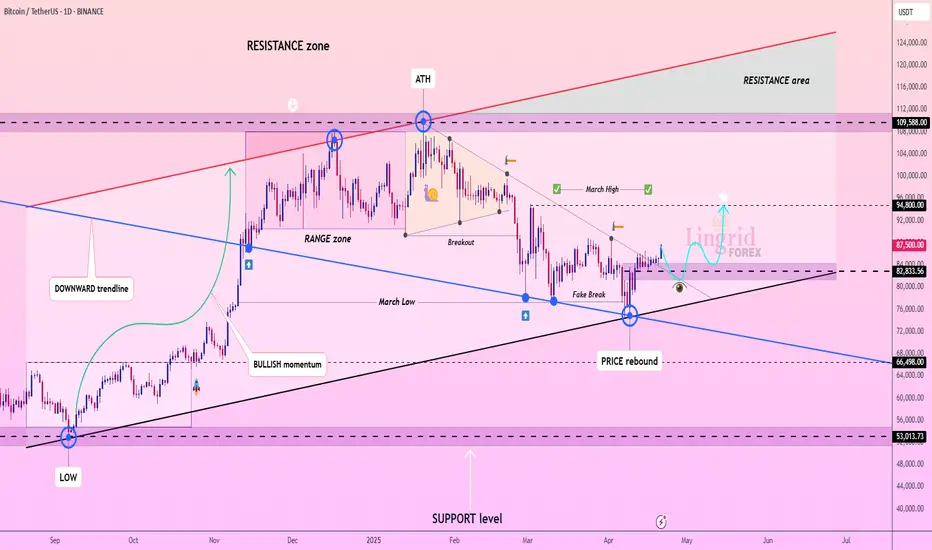
Lingrid | BTCUSD shifting SENTIMENT. End of CORRECTION Phase?BINANCE:BTCUSDT market initially made a false breakout below the March low before bouncing off this support level. Recently, prices broke through the downward trendline that showed the correction phase, suggesting sentiment is gradually shifting toward bullish. However, we should remain cautious as this could still develop into a false breakout. If that scenario unfolds, we anticipate the inverse head and shoulders pattern.
Notable resistance has emerged around the 84,000 level, with price action struggling to breach this threshold, highlighting its significance as a key zone. Going forward, the market will likely oscillate between 84,000 and 89,000 before potentially retesting the March high levels. Overall, we might have positive momentum and bullishness in the market towards end of this month, though this outlook remains vulnerable to any unexpected negative news that could impact price action. My mid-term goal is resistance zone around 94,800
Traders, if you liked this idea or if you have your own opinion about it, write in the comments. I will be glad 👩💻
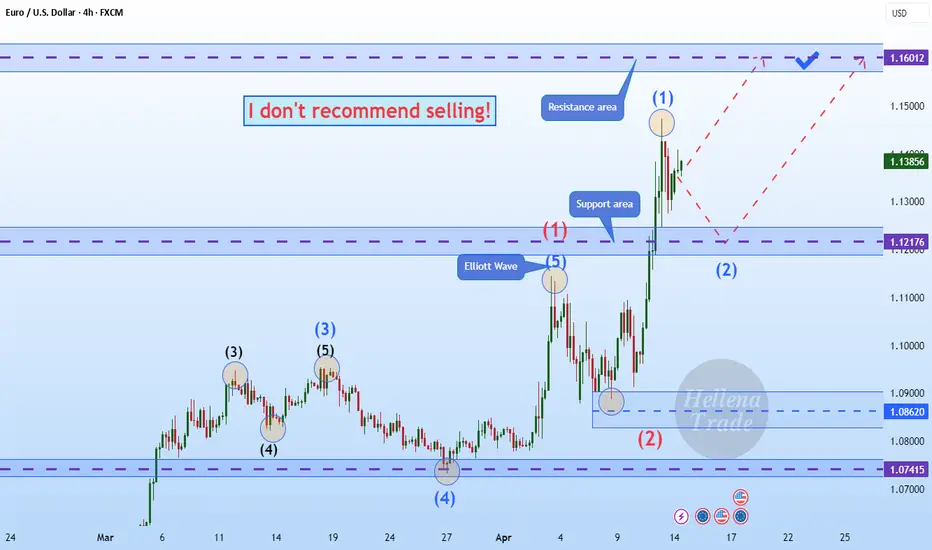
Hellena | EUR/USD (4H): LONG to the resistance area 1.16000.Good afternoon colleagues! In the coming week I expect the upward movement to continue in wave “3” of the higher order. I believe that a small correction to the support area of 1.2176 and then rise to the resistance level of 1.16000 is possible.
There are two possible ways to enter the position:
1) Market entry
2) Pending limit orders.
Manage your capital correctly and competently! Only enter trades based on reliable patterns!
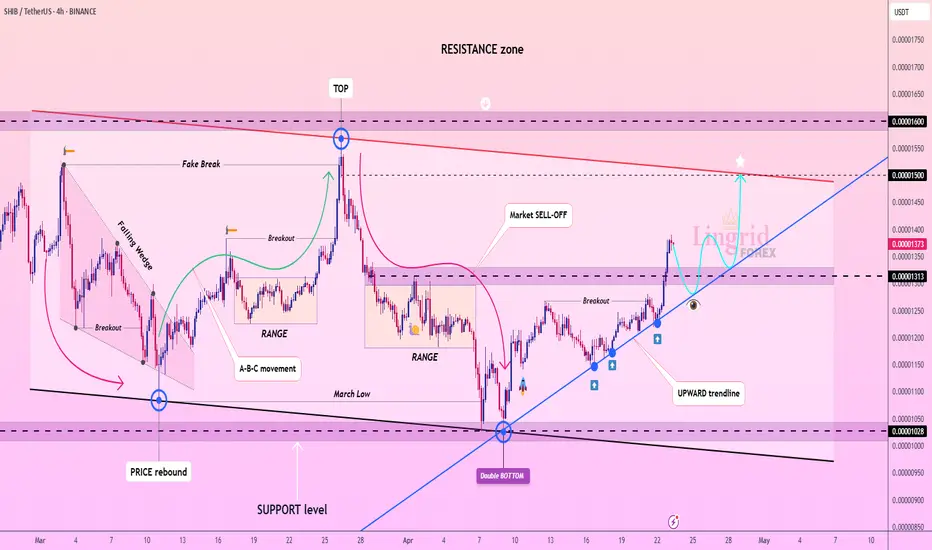
Lingrid | SHIBUSDT price REBOUND after DOUBLE Bottom FormationBINANCE:SHIBUSDT market has bounced off the support level following a double bottom formation. Price action essentially created a false breakout below the previous month's low before reversing higher. Recently, it completed an ABC move, which typically precedes a pullback phase. The 0.00001250 support level has demonstrated significant importance to the market, having been tested multiple times with price rebounding from this zone on numerous occasions. Since the price has successfully broken and closed above this critical level, I expect the market to retrace toward the support zone and upward trendline before continuing its upward movement, provided it maintains position above these key zone. My goal is resistance zone around 0.00001500
Traders, if you liked this idea or if you have your own opinion about it, write in the comments. I will be glad 👩💻
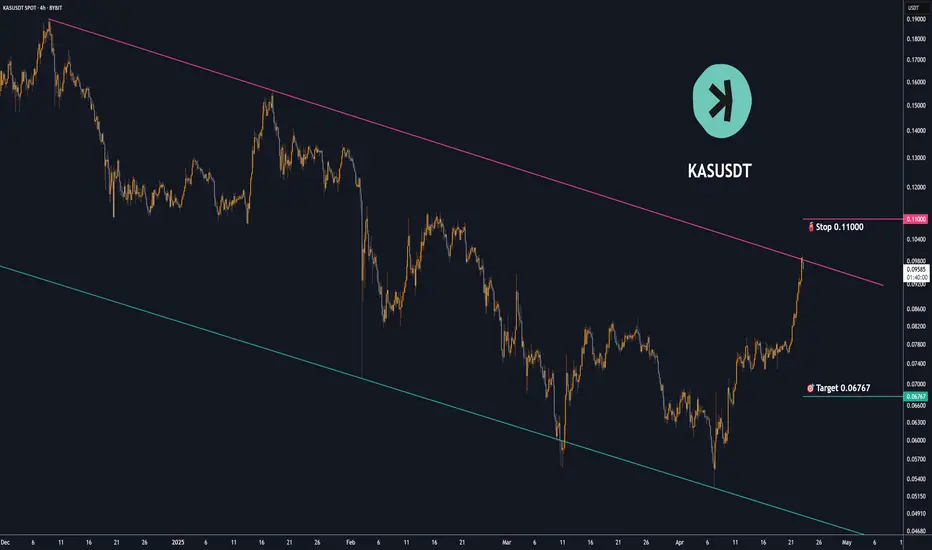
Trading opportunity for KASUSDTBased on technical factors there is a Sell position in :
📊 KASUSDT
🔴 Sell Now
🪫Stop loss 0.11000
🔋Target 0.06767
📏 R/R 2
💸RISK : 1%
We hope it is profitable for you ❤️
Please support our activity with your likes👍 and comments📝
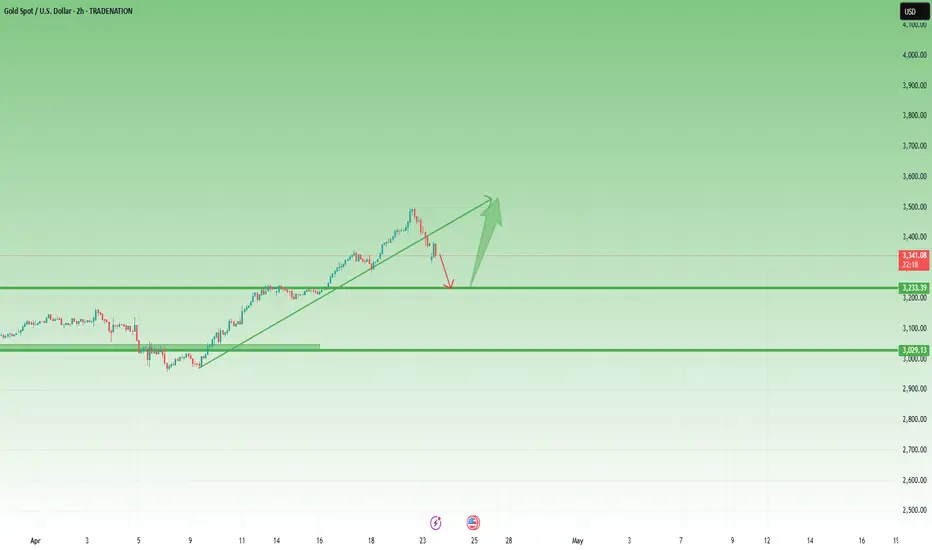
Gold Madness –5k Pips in 10 Days,drop almost 2k after. Now What?The last 10 trading days in Gold can be summed up in just one word: madness.
Back on April 9, the price was still under 3000 – yesterday it kissed 3500, marking an explosive 5000-pip rally in less than two weeks. That’s over 15% gain in no time!
🔙 As I mentioned in yesterday’s educational post , even though I expected a major correction, the lack of a clear stop loss setup made me choose the safest option: staying out.
Well, Gold did what it does best – surprise. Just before reaching a new all-time high, price reversed and at the time of writing, it has already dropped over 1600 pips from the peak.
📉 From a technical perspective, there are some important developments:
- Price has broken below the rising trendline, signaling a potential shift on short term
- Now, it's heading towards the 3250 support zone, which is aligned with the 50% Fibonacci retracement of the recent rally.
- This area could become a battleground – if bulls step in, we might see another bounce.
💡 Trading Plan:
From the selling side, the only potential setup I see is around 3450, but with a huge stop loss, making it less attractive.
On the buy side, I’ll be watching the 3250 level closely. If price action shows strength there, I may consider entering long – but only if the market conditions align properly.
Until then, I’m observing from the sidelines. No FOMO – just disciplined strategy. 🚀
Disclosure: I am part of Trade Nation's Influencer program and receive a monthly fee for using their TradingView charts in my analyses and educational articles.
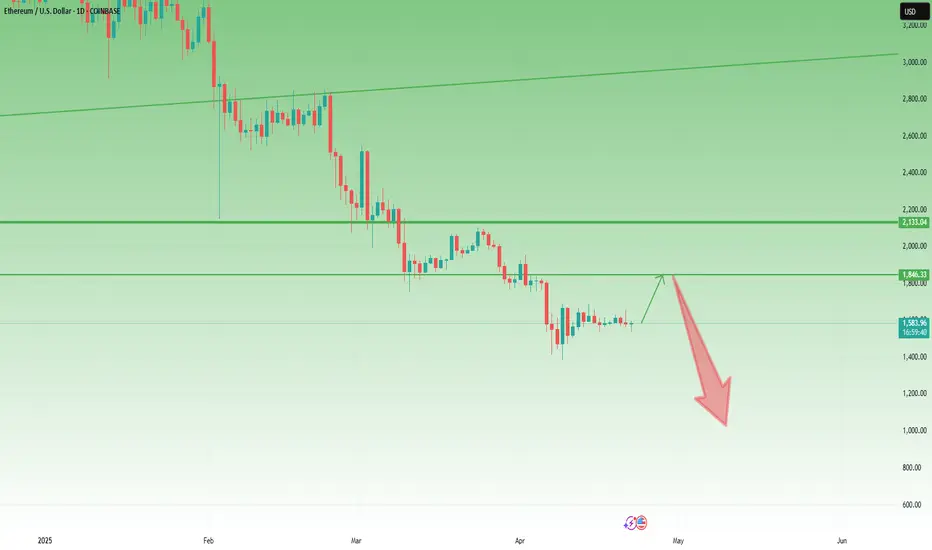
ETH Bulls Might Have a Shot – Tight Range Before the Breakout📅 What just happened on ETH?
Ethereum recently printed a local bottom just below 1400 – a level that felt unthinkable just a few months ago. But as it often happens in crypto, the unexpected became reality.
💡 What came next?
From that low, ETH bounced strongly, signaling the start of a natural correction. While I personally don’t believe this is the final bottom, I do see opportunity on the upside.
🧐 What the chart tells us:
Sharp reversal from under 1400
Quick drop but failed continuation lower
Current tight consolidation, which often leads to breakout setups
🧠 My view:
Right now, this looks like a temporary bottom, and until proven otherwise, I’m interested in buying the dip. As long as the structure holds, bulls might have the upper hand short-term.
🎯 My Trading Plan:
Looking to go long, with 1800 as my target.
Risk-Reward? I’m aiming for at least 1:2, so I’ll be waiting for the right entry signal before jumping in.
Lingrid | SUIUSDT key Support LEVELS Holding after RetestBINANCE:SUIUSDT market retraced to the support level before rebounding, having taken liquidity from below the psychological level of 2.00. This move was also accompanied by a fake breakout of the previous month's low, indicating a potential reversal in sentiment. On the daily timeframe, price is testing the November levels where we saw a surge. Looking left, we can see that the price has bounced off this support level twice before, highlighting it as an area of interest. I anticipate that the price will continue to rise from this area if sudden news doesn't drag it down. My goal is resistance zone around 2.40
Traders, if you liked this idea or if you have your own opinion about it, write in the comments. I will be glad 👩💻

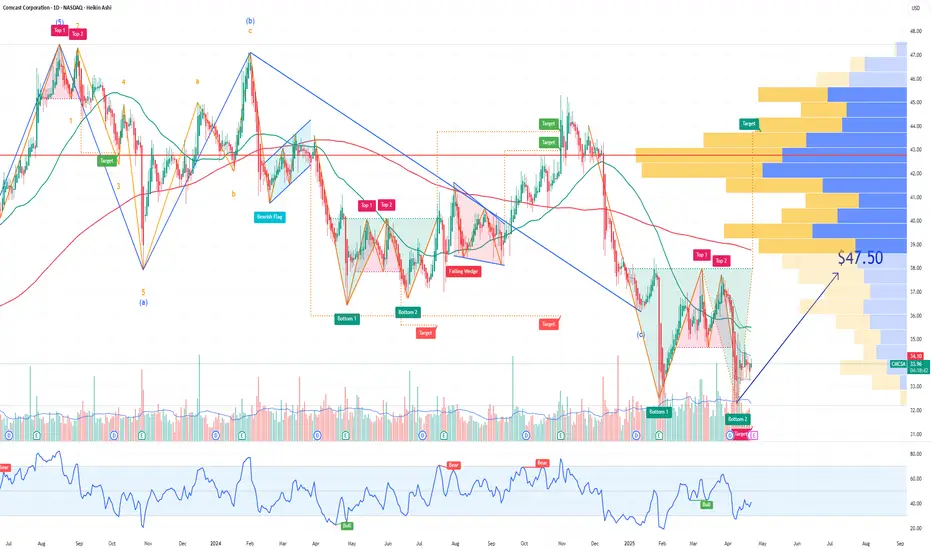
CMCSA Comcast Corporation Options Ahead of EarningsAnalyzing the options chain and the chart patterns of CMCSA Comcast Corporation prior to the earnings report this week,
I would consider purchasing the 37.5usd strike price Calls with
an expiration date of 2025-9-19,
for a premium of approximately $1.35.
If these options prove to be profitable prior to the earnings release, I would sell at least half of them.
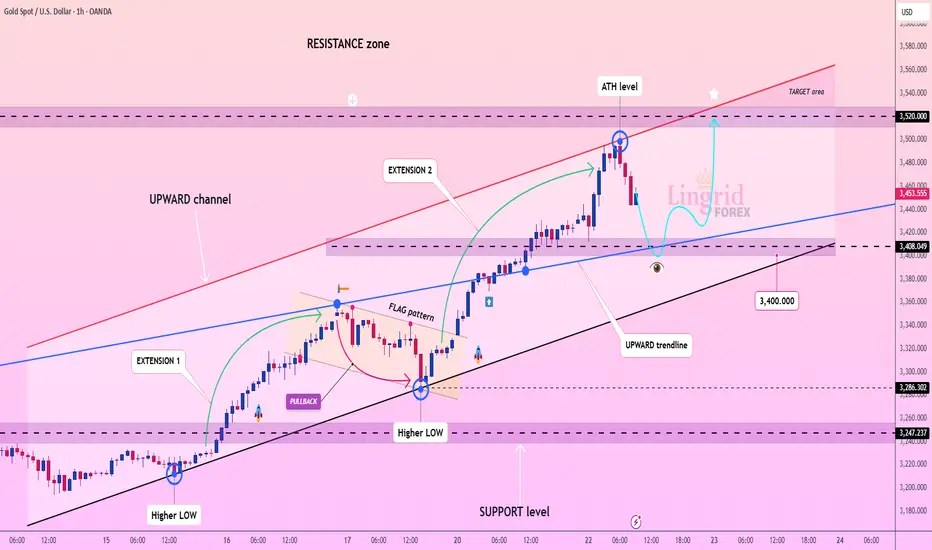
Lingrid | GOLD Unstoppable MOMENTUM Toward New All-TIME HighsThe price perfectly fulfilled my previous idea. It reached the targeted level. OANDA:XAUUSD market appears unstoppable as it reaches a new all-time high level at 3500. From this peak, price pulled back toward the support level and previous day's high. We can observe that the price completed an ABC move before the pullback formed. Following this retracement, there's a possibility the price is creating either a triangle pattern or flag pattern similar to previous formation. If the market maintains position above the upward trendline and the crucial support level at 3400, there's a strong probability of trend continuation with the market retesting the ATH level and pushing further upward. My goal is resistance around 3520
Traders, if you liked this idea or if you have your own opinion about it, write in the comments. I will be glad 👩💻
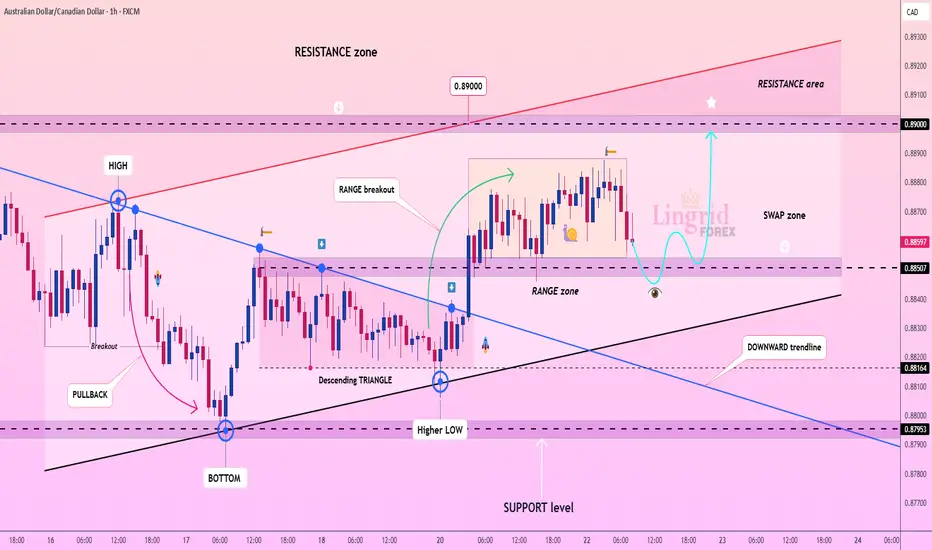
Lingrid | AUDCAD shows Contraction - EXPANSION patternFX:AUDCAD market has formed a range after successfully breaking through the triangle pattern. Price broke and closed above the 0.88500 key level, confirming the bullish bias. On the daily timeframe, an engulfing candle has formed, demonstrating bullish dominance in the market. Furthermore, the price structure continues to establish higher highs and higher lows, reinforcing the uptrend. I think the market may consolidate briefly before resuming its upward trajectory toward the key resistance zone. The price is likely to respect the support level, which acts as a swap zone due to its historical significance, having been tested and respected multiple times in the past. My goal is resistance zone around 0.89000
Traders, if you liked this idea or if you have your own opinion about it, write in the comments. I will be glad 👩💻