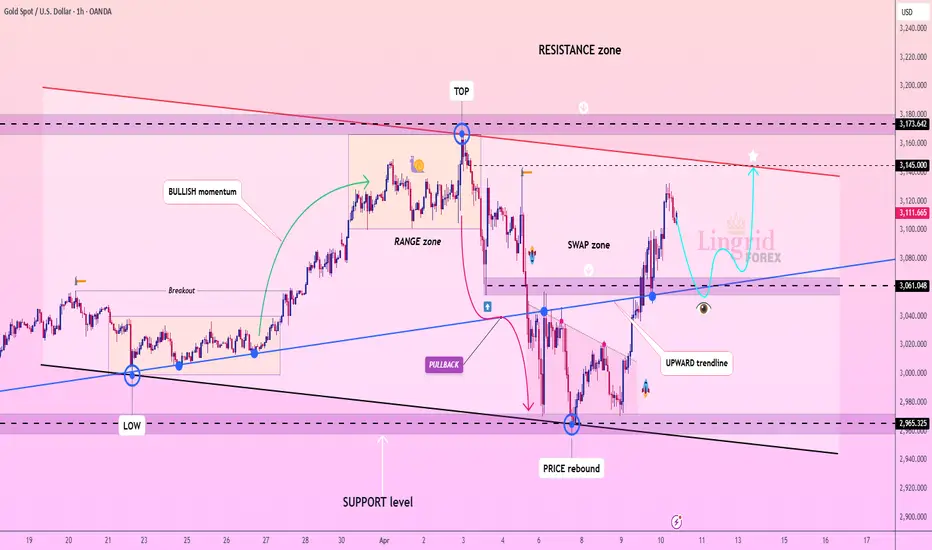
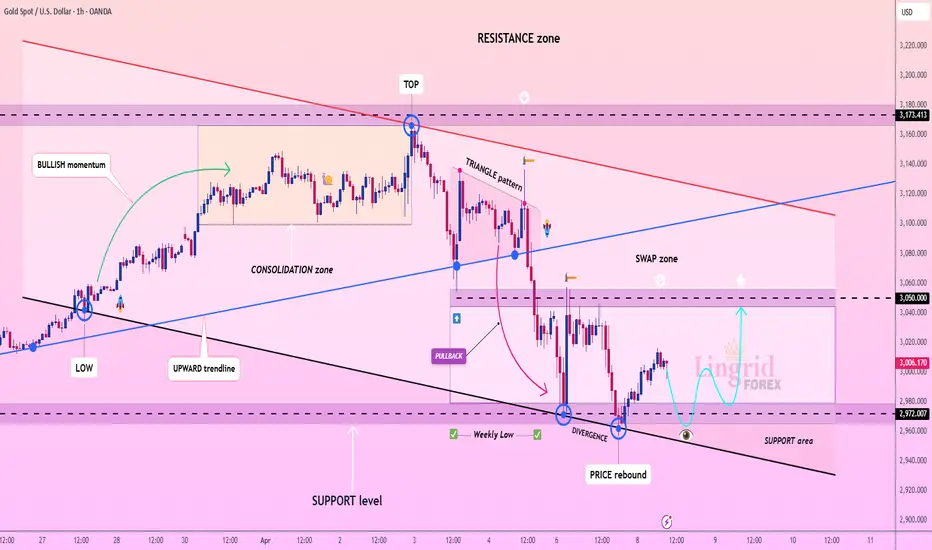
Lingrid | GOLD Retracement Likely Before UPWARD Continuation The price perfectly fulfilled my previous idea . It reached the target. OANDA:XAUUSD broke and closed above the swap zone around 3050, which was also Monday's high. The price is now testing the zone above the 3100 level, and I anticipate a potential pullback following the recent bullish extension. Given today's high-impact news, the market may drop from the resistance zone. If the price forms a retracement toward the support level, where we have an upward trendline and swap zone, there is a good chance of the price to rebound. Another scenario could be sideways movement, as we previously observed sideways action at this zone when looking to the left. Overall, I expect a pullback followed by continuation. My goal is resistance zone around 3145
Traders, if you liked this idea or if you have your own opinion about it, write in the comments. I will be glad 👩💻
Signalservice
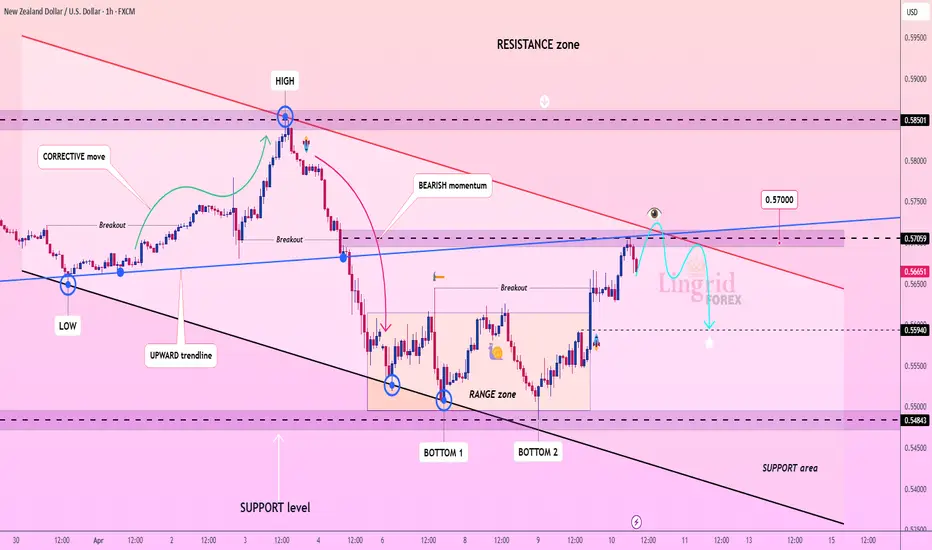
Lingrid | NZDUSD potential PULLBACK Trading OpportunityThe price perfectly fulfilled my previous idea . It hit the take profit level. After last week's massive sell-off, FX:NZDUSD price has pulled back toward 60% of the bearish move. The price appears to have bounced off the resistance zone where we have upward trendline and channel border. Additionally, there is a psychological level at 0.57000 as well. I believe the price may move lower and retest the middle of the consolidation zone if the price rejects the resistance. However, the market might move higher if the upcoming news release favors the market. My target is resistance zone around 0.55940
Traders, if you liked this idea or if you have your own opinion about it, write in the comments. I will be glad 👩💻
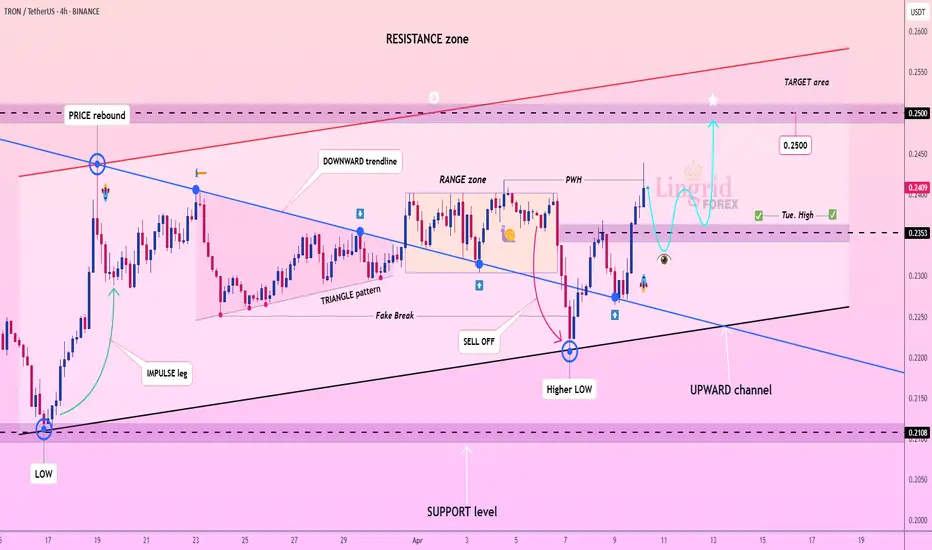
Lingrid | TRXUSDT short-term BULLISH move in CONSOLIDATION zoneThe price perfectly fulfilled my last idea . It reached the target level. BINANCE:TRXUSDT market is forming an ABC extension pattern and has established higher lows, while the highs remain relatively equal. Price continues to test the 0.2400 resistance zone, and I anticipate a potential breakthrough and close above this level. Recently, price broke above the previous week's high, suggesting it may either pull back or continue moving upward. However, I expect price to retest the support zone before resuming its upward trajectory. My target is resistance zone around 0.2500
Traders, if you liked this idea or if you have your own opinion about it, write in the comments. I will be glad 👩💻
Buy the Dips Towards 3080 – Gold Builds a Strong Base 🟡 What happened with Gold (XAUUSD) yesterday?
In yesterday's analysis, I mentioned that I was bullish on Gold, expecting a resumption of the upward move with targets extended to 3080 and interim resistance at 3050.
Although the price rose, it found strong resistance at the 3020 zone, which prompted me to close my buy trade with around 400 pips profit (although I was aiming for closer to 1k pips).
Afterward, the market started to drop and breached under 3000 again.
However, once the price reached the 2970 zone, bulls entered the market strongly and pushed the price back above 3000.
❓So now what? Is the correction over or will it continue?
Looking at the chart, we can clearly see two things:
✅ A solid support has formed around 2960-2970 zone
✅ A double bottom is in the making, with a well-defined neckline at 3020
________________________________________
📌 Why the bullish bias remains valid:
• 2960-2970 proved to be a strong demand zone
• Price reclaimed the 3000 level after the dip
• Double bottom structure is forming = possible breakout ahead
• 3020 is the key level to break for continuation
________________________________________
🎯 Trading Plan:
The preferred strategy remains:
➡️ Buy the dips
🎯 Main target: 3080
❌ Invalidation: daily close below 2960
Disclosure: I am part of Trade Nation's Influencer program and receive a monthly fee for using their TradingView charts in my analyses and educational articles.

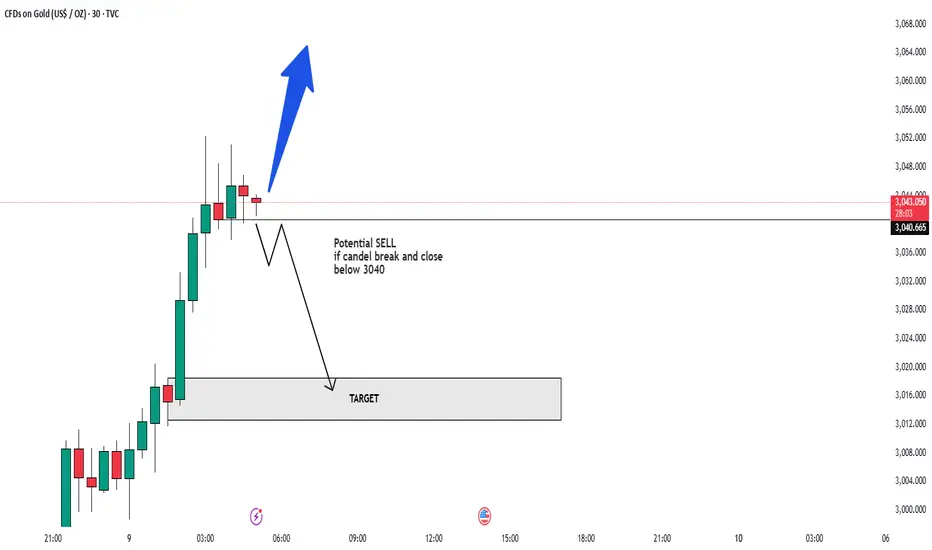
WILL GOLD PUMP AGAIN IN FOMC NEWS ALERT🚨 XAUUSD Market Update! 🚨
Gold is on the move, battling key levels between 3040! Will we see a breakout soon? 🔥
Bearish Watch: If the price drops below this range, we could target 3015 and 3020. ⚠️
Bullish Opportunity: A break above 3042 could signal a buying surge, with targets set at and 3100. 🚀
💬 What’s Your Move? Join the conversation and share your thoughts! Let’s navigate this golden opportunity together and aim for new highs! 💰
Lingrid | GOLD key LEVELS for Potential BULLISH ContinuationThe price perfectly fulfilled my last idea . It hit the take profit level. OANDA:XAUUSD market bounced off the 3000 support level, potentially signaling the end of the corrective move. However, examining the 1H timeframe reveals the price still remains within the consolidation zone. If the price breaks and closes above the 3050 resistance zone, we can anticipate a continuation of the bullish move. I expect the price may continue moving sideways until the next trading day. However, if the price retests the psychological level below, we can look for buying opportunities. My goal is resistance zone around 3100
Traders, if you liked this idea or if you have your own opinion about it, write in the comments. I will be glad 👩💻

Lingrid | USDJPY Bearish MOMENTUM. Potential ShortFX:USDJPY price is showing lower lows and lower closes, indicating bearish dominance in the market. After testing the previous week's low, the market rebounded, forming a pullback. Currently, the price trades below the psychological 146.000 level, the upward trendline, and the channel border. Overall, the price action is forming an ABC pattern, suggesting that point C may complete at the 142.000 support level. If the price closes below the previous week's low, there is a high probability of further downward movement. My goal is support zone around 143.050
Traders, if you liked this idea or if you have your own opinion about it, write in the comments. I will be glad 👩💻

Lingrid | XRPUSDT Correction Following ABC move CompletionThe price perfectly fulfilled my previous idea . It reached the target. BINANCE:XRPUSDT price has completed its ABC move, which is typically followed by the pullback we're currently witnessing. The market has broken below the psychological 2.00 level and its established range zone. I think the price may move toward the middle of the range zone, as this area historically acts as both support and resistance. However, considering the downward trendline and the key resistance at 2.00 above, I anticipate the price may rebound from that zone and continue its downward trend. My goal is support zone around 1.60
Traders, if you liked this idea or if you have your own opinion about it, write in the comments. I will be glad 👩💻

Lingrid | GOLD sideways MOVE after Failed SUPPORT BreakOANDA:XAUUSD market is oscillating between 2970 and 3050 levels, showing a potential consolidation phase. The price broke below the last 3 weeks' low but pulled back, forming a fake breakout. The price also tested February's high then bounced off, suggesting this support zone has significance to the market. Recently, the price formed a bullish divergence after creating a fake breakout of the previous support level. I think the market will continue moving sideways since the price is trading within the previous day's range. I expect the market to retest the swap zone above. My goal is resistance zone around 3050
Traders, if you liked this idea or if you have your own opinion about it, write in the comments. I will be glad 👩💻
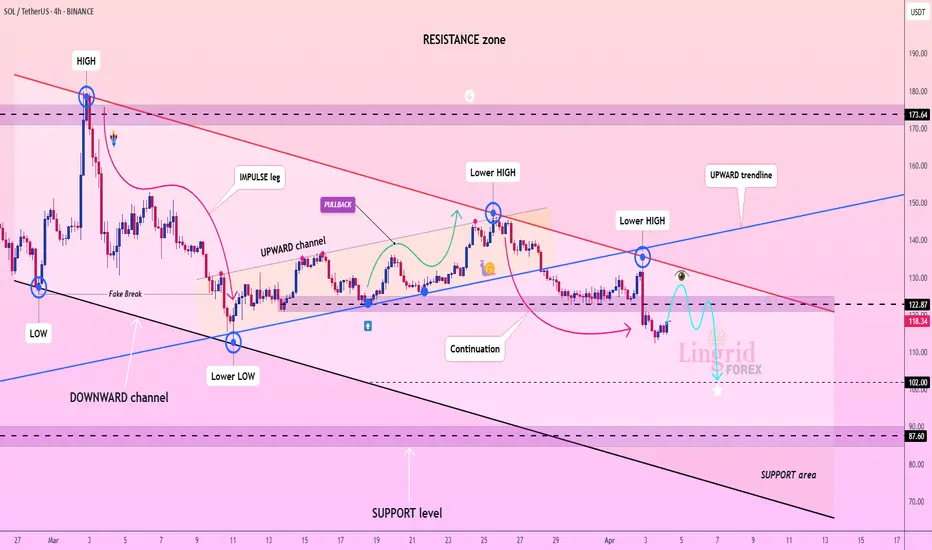
Lingrid | SOLUSDT testing MARCH low. Short OpportunityBINANCE:SOLUSDT market is making lower lows and lower closes, indicating a bearish trend. It is slowly approaching the key psychological level at 100.00 while currently testing the previous month's low. The price broke and closed below the upward trendline that had been holding for a couple of weeks. I think the price may continue to move lower toward the key support level, and there is a possibility it could push even lower. Furthermore, the price has been consolidating around the 120.00 level, demonstrating significant bearish sentiment in the market. I expect the price to move lower, possibly breaking below the March low. My goal is support zone around 102.00
Traders, if you liked this idea or if you have your own opinion about it, write in the comments. I will be glad 👩💻
XAUUSD Update: Bullish or Bearish? Key Levels to Watch! 🚨 Attention Traders! 🚨
XAUUSD is making waves and breaking through key levels! 🔥 The price is currently battling between 2980 and 2989 — will we see a breakout soon?
Bearish Alert: A dip below this range could lead us to targets like 2860 and 2850. ⚠️
Bullish Opportunity: A move above 2989 could trigger buying opportunities, with targets around 3004 and 3027. 🚀
💬 Let’s Talk Strategy! What’s your take on this? Share your insights as we ride this golden wave together and unlock new opportunities! 💰

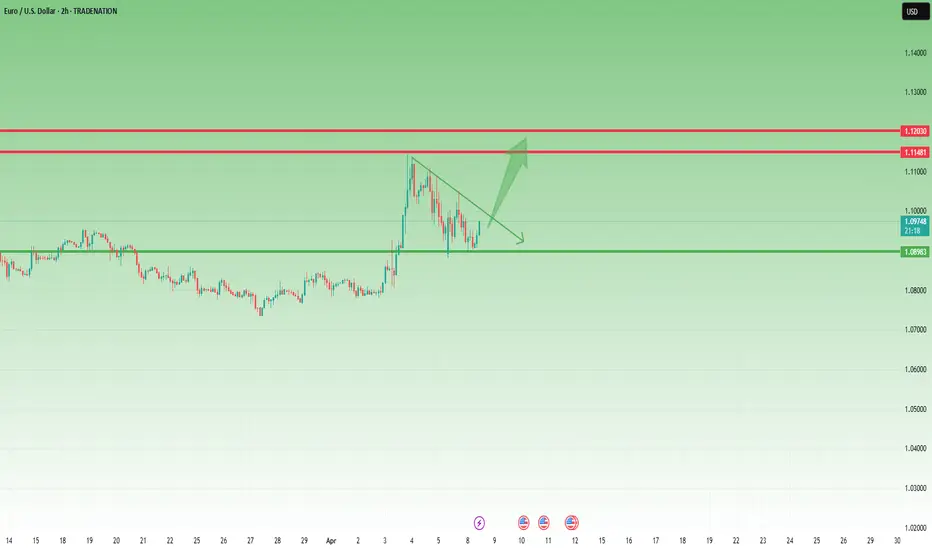
Bulls Take Control – Can EURUSD Reach 1.1150 Again?1. What happened (recap):
Last week, EURUSD reached the 1.1150 zone, a level that hasn't been touched since August-September last year. After that, the pair started a correction. Although the week started with a gap down yesterday, bulls took control and pushed the pair higher.
2. Key Question:
Has EURUSD completed its correction, or is another drop coming?
3. Why I expect further upside:
• 🔑 A retest of the formed support at 1.09 occurred during yesterday’s New York session, followed by a fresh rebound.
• 📊 The drop from 1.1150 appears corrective in nature, suggesting the possibility of a new leg up.
• 🎯 As long as 1.09 holds, my strategy is to buy dips with the primary target being a retest of the 1.1150 resistance zone.
4. Trading Plan:
📌 I’m looking for buying opportunities on dips, aiming to retest the 1.1150 resistance area. This scenario is invalidated only by a daily close below 1.09.
Disclosure: I am part of Trade Nation's Influencer program and receive a monthly fee for using their TradingView charts in my analyses and educational articles.
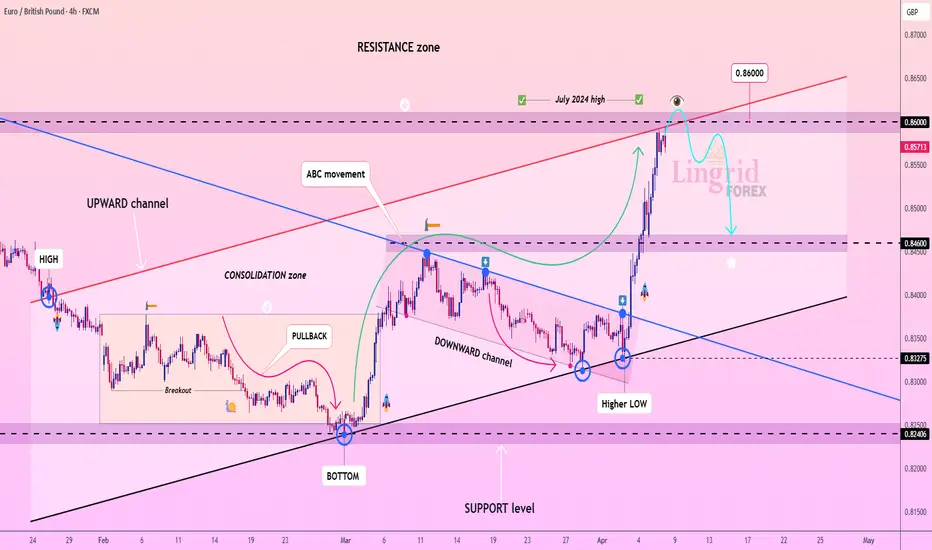
Lingrid | EURGBP tests RESISTANCE at July 2024 High. ShortThe price perfectly fulfilled my last idea . It hit TP. FX:EURGBP market shot up and reached the resistance zone as well as channel border. The price is now near the July High of 2024. The market has completed an ABC move where the C point is near the psychological level at 0.86000. On the 1H timeframe, the price has formed a double top with bearish divergence, suggesting a potential pullback. If the market remains below this resistance zone, I expect the price may retest the lower levels after the impulse leg. My goal is support level 0.84600
Traders, if you liked this idea or if you have your own opinion about it, write in the comments. I will be glad 👩💻
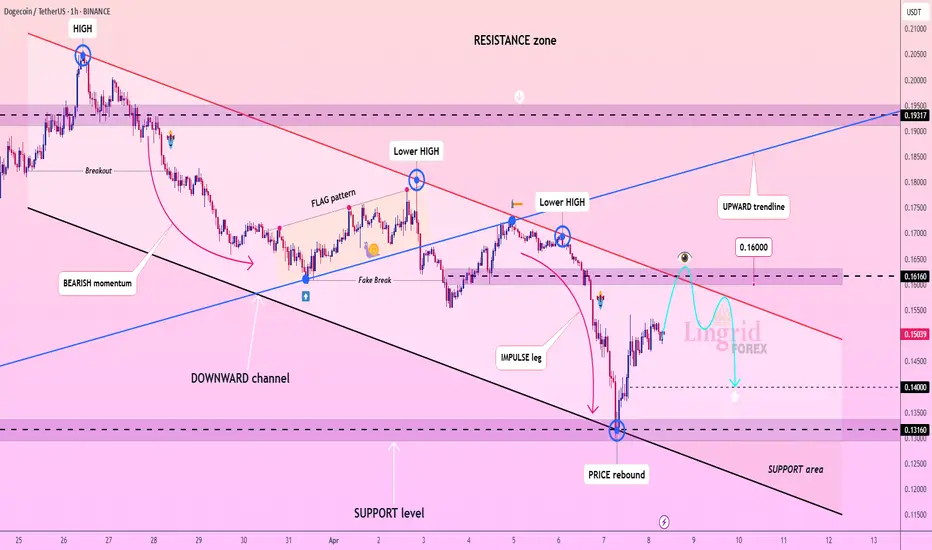
Lingrid | DOGEUSDT bearish TREND with Short-Term Relief RallyThe price perfectly fulfilled my last idea . It reached the target. The market has completed an impulse leg and recently bounced off the support level that was previously tested in October 2024. Overall, the market is making lower lows and lower closes, indicating bearish dominance. As we can see, the price is currently testing the 0.1500 level, and I believe it may move higher toward the channel border around 0.1600. Considering the overall bearish trend, I expect the market to continue making lower lows or possibly create a consolidation zone at this current support area. My goal is support zone around 0.1400
Traders, if you liked this idea or if you have your own opinion about it, write in the comments. I will be glad 👩💻
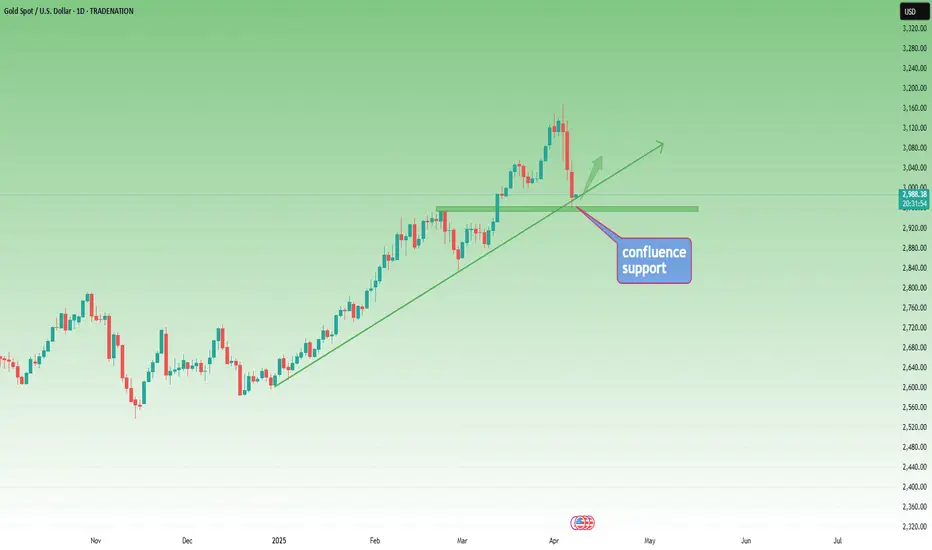
Gold's Rollercoaster: From 3167 ATH to 2950 Support–What's Next?Since the beginning of the year, Gold has been on an impressive uptrend, gaining over 5000 pips, culminating with last week's ATH at 3167.
As I highlighted throughout last week's analyses, even though we're in a strong uptrend, the price was too far deviated from the mean, making a correction inevitable.
✅ Friday Recap:
After testing the resistance zone formed at 3135-3140, Gold dropped hard, closing the week 1000 pips lower from its peak during Friday's session.
📉 Recent Developments:
The correction continued yesterday, with Gold recently touching an important confluence support around 2950.
📈 What's Next?
I expect an upward movement and resumption of the uptrend, with targets at:
• 3050 zone 📌
• 3080 zone 📌
🎯 Plan:
Buy dips near support, aiming for the mentioned targets. The analysis would be negated if we see a clear break below 2950. 🚀
Disclosure: I am part of Trade Nation's Influencer program and receive a monthly fee for using their TradingView charts in my analyses and educational articles.
Bulls are not of the woods, not by far1. What happened yesterday?
In my weekend analysis covering US indices , I mentioned that US500 (SP500) could drop and test the ascending trend line starting back at the pandemic low. This line is confluent with the horizontal support level given by January 2022 ATH, offering a good opportunity for traders to open long positions.
Indeed, at least on CFDs and futures, this trend line was touched, and the price rebounded strongly from there.
2. Key Question:
Will we have a full V-shape recovery, or will the price drop back below 5k in the coming sessions?
3. Why I expect a continuation of the correction:
🔸 Strong Resistance: The US500 has established a robust ceiling around the 5350-5400 zone(also a gap there)
🔸 Lack of Building Momentum on Support: There's no clear indication that this resistance will be broken anytime soon with the lack of accumulation under 5k
🔸 Potential for Further Decline: Given the current market structure, a drop below 5k remains a realistic possibility in the upcoming sessions.
4. Trading Plan:
🎯 My Strategy: Playing the range.
✅ Buy near the 4800 support.
✅ Sell into the resistance zone between 5350 and 5400.
5. Conclusion:
I’m watching for market confirmations and will continue applying this range strategy until there’s a clear directional change. 🚀
Disclosure: I am part of Trade Nation's Influencer program and receive a monthly fee for using their TradingView charts in my analyses and educational articles.

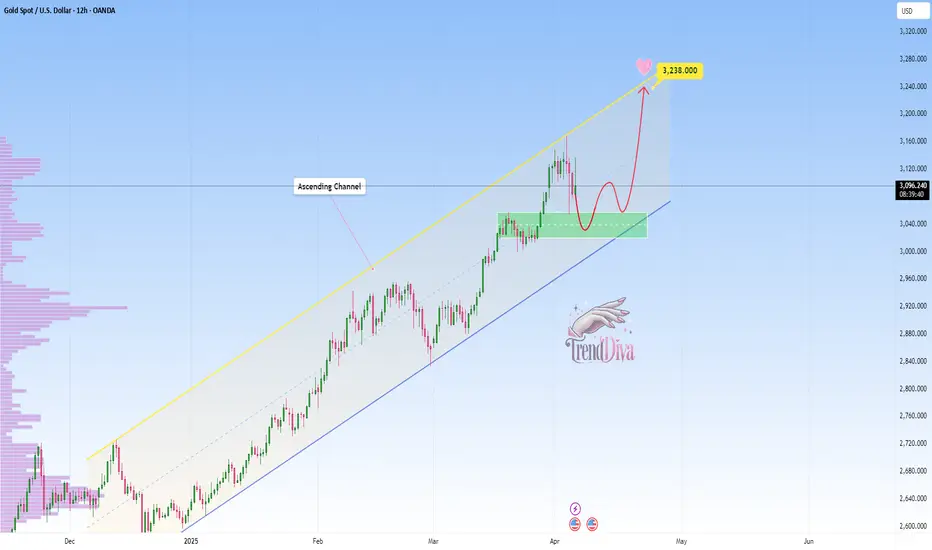
GOLD Trending Higher - Can buyers push toward 3,238?OANDA:XAUUSD is trading within a well-defined ascending channel, with price action consistently respecting both the upper and lower boundaries. The recent bullish momentum indicates that buyers are in control, suggesting a potential continuation.
The price has recently broken above a key resistance zone and may come back for a retest. If this level holds as support, it would reinforce the bullish structure and increase the likelihood of a move toward the 3,238 target, which aligns with the channel’s upper boundary.
As long as the price remains above this support zone, the bullish outlook stays intact. However, a failure to hold above this level could invalidate the bullish scenario and increase the likelihood of a pullback toward the channel’s lower boundary.
Remember, always confirm your setups and trade with solid risk management.
Best of luck!
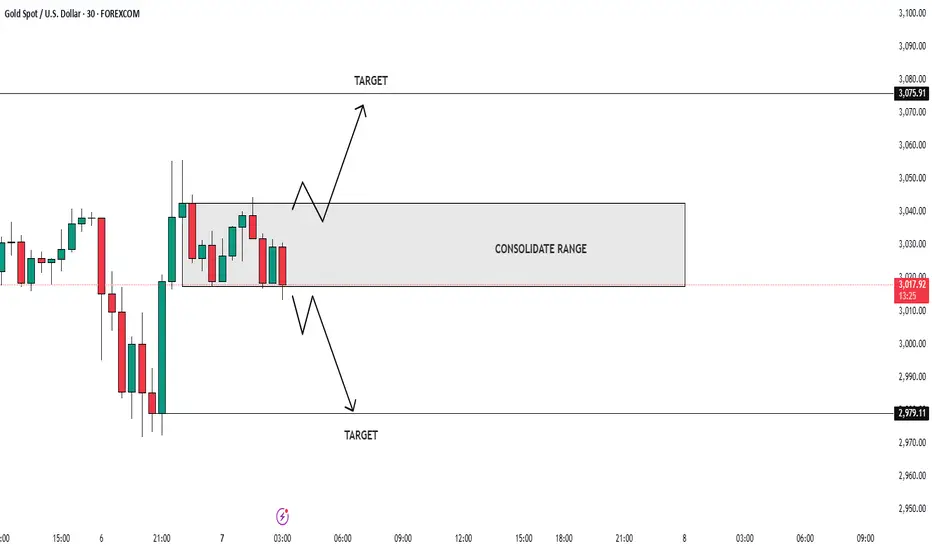
SUPPORT AND RESISTANCE BREAKOUT ALERT!🚨 Attention Traders! 🚨
XAUUSD is on fire, breaking records with power! 🔥 Here's the latest:
Current Range: We're seeing a fierce battle between 3017 and 3043. Will we break out soon?
Bearish Scenario: Watch out for a possible dip below this range. If that happens, targets like 2988 and 2978 could be in play. ⚠️
Bullish Scenario: A breakout above 3043 opens up buying opportunities! Watch for movement above 3072, with targets at 3124 and 3150. 🚀
💬 Join the Discussion! What are your thoughts? Let’s ride this wave and make the most of the opportunities ahead! 💎
Lingrid | GOLD Weekly Outlook: Bullish Momentum Faces CorrectionOANDA:XAUUSD market has been bullish; however, Friday turned bearish with a nearly 3.8% decline. After such bullish momentum, this pullback seems normal. In the current timeframe, price completed the ABC move, which is typically followed by a pullback—exactly what we've seen recently. On the weekly timeframe, the price formed a long-tailed bar, indicating it may retest the support zone below the 2900 level. However, considering the upward momentum in the market and the fact that price did not close below the previous week's low, this scenario seems less likely.
I believe we're facing a similar scenario to what we saw in the last week of February, when the market fell around 4% but subsequently reached all-time highs. Right now, areas to consider going long include just below the week's low and the psychological level at 3000. Additionally, we have the channel border as well as the upward trendline serving as potential support. Another scenario worth noting is what happened before the US election last November, when prices fell around 9%, which could mean a retest of the 2900 level. Overall, next week the price may move sideways for a couple of days after bearish impulse leg or bounce off the 3000 level.
Traders, if you liked this idea or if you have your own opinion about it, write in the comments. I will be glad 👩💻

Lingrid | BTCUSD breaking KEY Support Levels. Potential ShortThe price perfectly fulfilled my last idea . It reached the target. BINANCE:BTCUSDT recently broke and closed below the March low. Furthermore, it broke below the psychological key level at 80,000 and the upward trendline. The weekly candle also closed bearish with a long tail, suggesting that the price may fall below the next support level at 70,000. On the daily timeframe, the price action is forming an ABC move which also suggests that the price may go below the 70,000 level. I think if the price remains below the 77,000-78,000 resistance zone, there is a chance of movement toward lower levels. I expect the price to retest the support level and channel border. My goal is support zone around 70,000
Traders, if you liked this idea or if you have your own opinion about it, write in the comments. I will be glad 👩💻

Crypto Sell-Off: Is Solana Headed for $80?Without a doubt, Solana was the hottest topic in the crypto market last year and at the start of this one—especially with the meme coin craze.
However, after peaking near $300, the price began to decline in what initially appeared to be a normal correction. But once Solana broke below the $200 mark, things turned ugly, and the price quickly dropped to the key $120 support zone—a level that held strong over the past year.
Now, it looks like Solana is on the verge of breaking below this support, which could trigger an acceleration toward $80, with the $100 psychological level as an intermediate stop.
________________________________________
Why the Downside is Likely to Continue
📉 Bulls Can’t Hold Gains – Short-term rallies are fading fast, showing a lack of real buying strength.
📉 Bearish Engulfing Candle – Yesterday’s price action printed a lower high, adding further pressure on support.
📉 $120 Breakdown Incoming? – If this level fails, expect a sharp decline toward $80.
________________________________________
Trading Plan: Selling Under $130
🔻 Sell Rallies Below $130 – Targeting a move to $80 in the medium term.
🔻 Only a Sustained Move Above $130 – Would shift Solana to a neutral stance—not bullish by any means.
For now, the bearish pressure remains, and selling rallies is the strategy to follow. 🚀

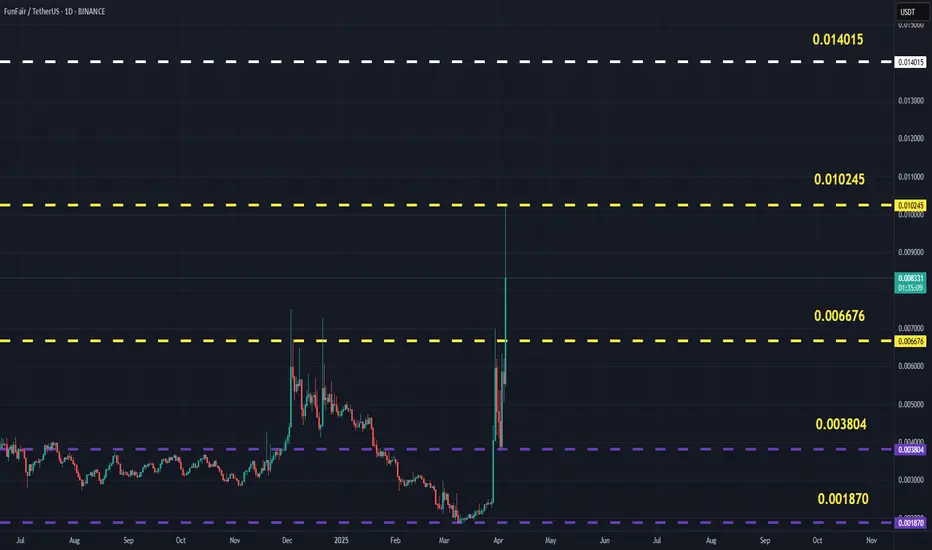
FUNUSDT(FUNToken) Updated till 05-04-25FUNUSDT(FUNToken) Daily timeframe range. while other alts going banana this thing doing pretty well till now. continuous push till 0.010245 which is local resistance. if it can have a confirm close above 0.006676 it will retrace back to 0.010245.
Lingrid | ETHUSDT approaching Key SUPPORT LevelBINANCE:ETHUSDT market has been moving sideways throughout the month, with the price gradually approaching the support level around 1700. The current month has closed bearish, and there is a possibility that the price may dip below the previous month's low before making a move higher in the long term. As we approach the mid of the current month, there seems to be a potential for the price to start moving upward. I anticipate that the price may briefly go below the 1700 level and then bounce back if it forms a fake breakout. This could present a buying opportunity, especially if the price shows signs of reversal after testing that support level. My mid-term goal is resistance zone around 2300.
Traders, if you liked this idea or if you have your own opinion about it, write in the comments. I will be glad 👩💻
