GOLD / XAUUSD TodaySSM Struckture is bearish
I have two scenario to sell setup
Now I open first if hit Sl and still rules to entry I will open next one
Signalservice

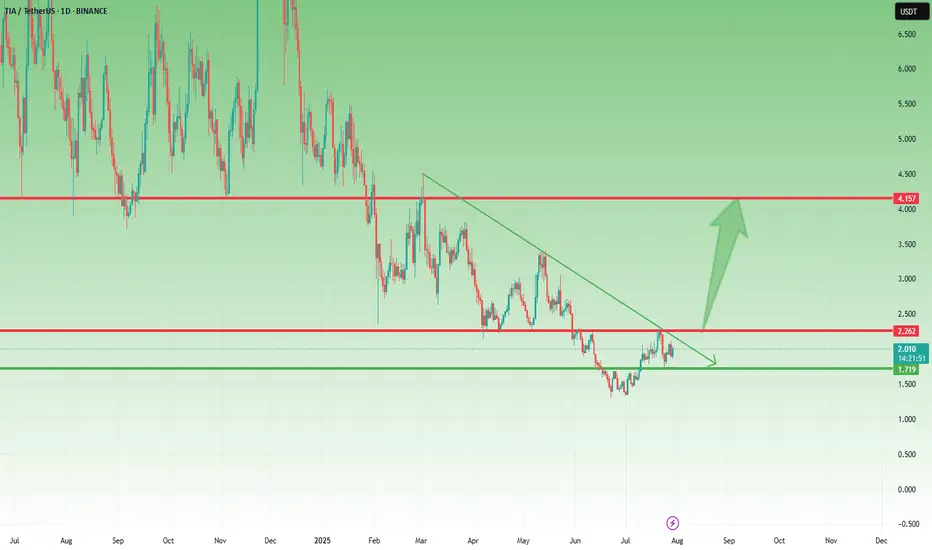
TIA Holding Support – Break Above $2.20 Could Trigger Big MoveLast week, I mentioned that TIA could be preparing for a move and that buying dips around $1.75 might be a good opportunity.
Well, price dropped exactly into that support zone, bounced slightly, and is now consolidating, which could be the calm before the next wave.
________________________________________
📌 Here’s what I’m watching:
• The $2.10–$2.20 zone is now a confluence resistance area (horizontal + descending pressure)
• A break and daily close above this level could trigger a strong leg up, with the next major target around $4.00
________________________________________
📈 Bias remains bullish
As long as $1.70 holds, this setup stays valid, and dips continue to be buyable.
________________________________________
🎯 Trading Plan:
• Looking to buy dips toward $1.80–1.85
• Acceleration expected only above $2.20
• Bearish invalidation only below $1.70
________________________________________
Conclusion:
TIA is respecting structure perfectly. If it breaks above $2.20, we could be looking at a potential double in price toward $4.
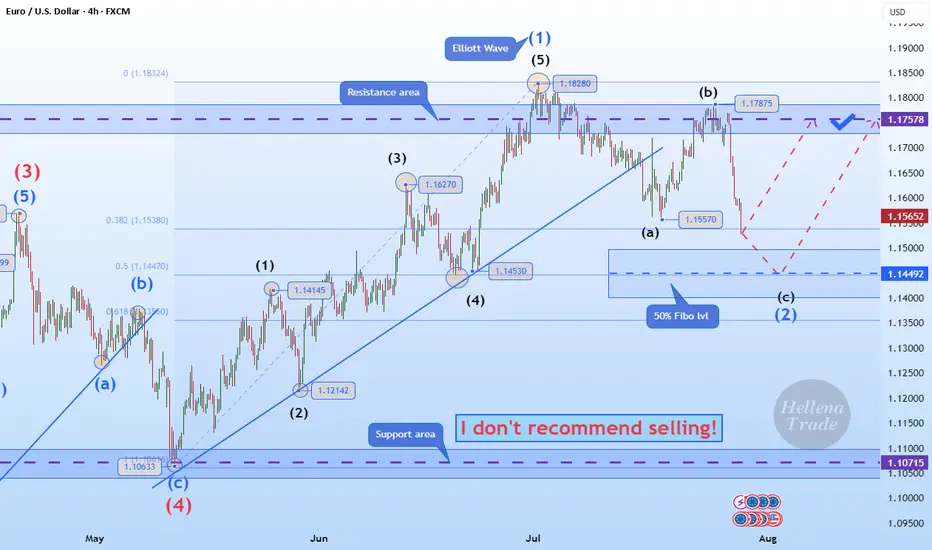
Hellena | EUR/USD (4H): LONG to the resistance area 1.17578.Colleagues, the price has made a strong downward movement, which can only mean one thing: the correction is not complete.
This means that the latest upward movement is wave “1” of medium order.
Therefore, I now expect the correction to end in wave “2” at the 50% Fibonacci level and thean upward movement to continue to at least the resistance level of 1.17578.
It is quite possible that after updating the level of 1.15570, the price will immediately begin an upward movement — this is a more risky option for entering a position.
Manage your capital correctly and competently! Only enter trades based on reliable patterns!
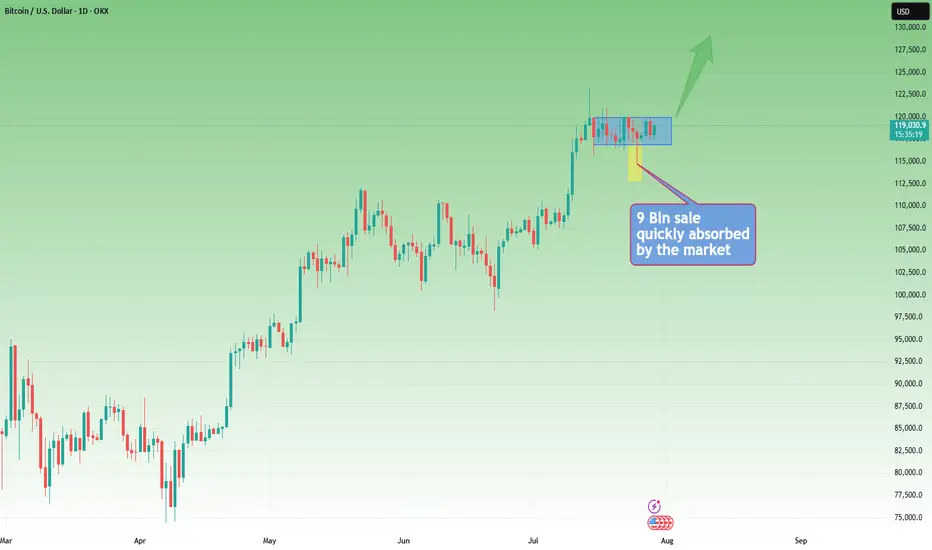
Rectangle Consolidation + Bull Trend = BTC Setup for ATHYesterday, Bitcoin dipped and recovered again, following last week's sharp spike down, triggered by the $9B Galaxy Digital sale on behalf of a Satoshi-era investor.
________________________________________
🧠 Why is this important?
Despite being one of the largest BTC sales in history, the move only caused a temporary spike down.
That’s a clear sign of market strength and strong interest on dips.
________________________________________
📉📈 Current Technical Context:
• If we ignore the spike, price is consolidating in a tight rectangle
• That’s typically a continuation pattern
• The broader trend remains strongly bullish
📌 Put all of that together, and we have at least 3 reasons to expect upside continuation
________________________________________
🎯 Key Levels:
• Break + daily close above $120K → likely leads to a new ATH and a potential test of $130K
• Invalidation only comes with a break below $114K
________________________________________
Conclusion:
BTC just absorbed a massive $9B sell without blinking.
As long as $114K holds, I'm bullish and expecting continuation.
Next leg could (and I hope it will) be explosive. 🚀
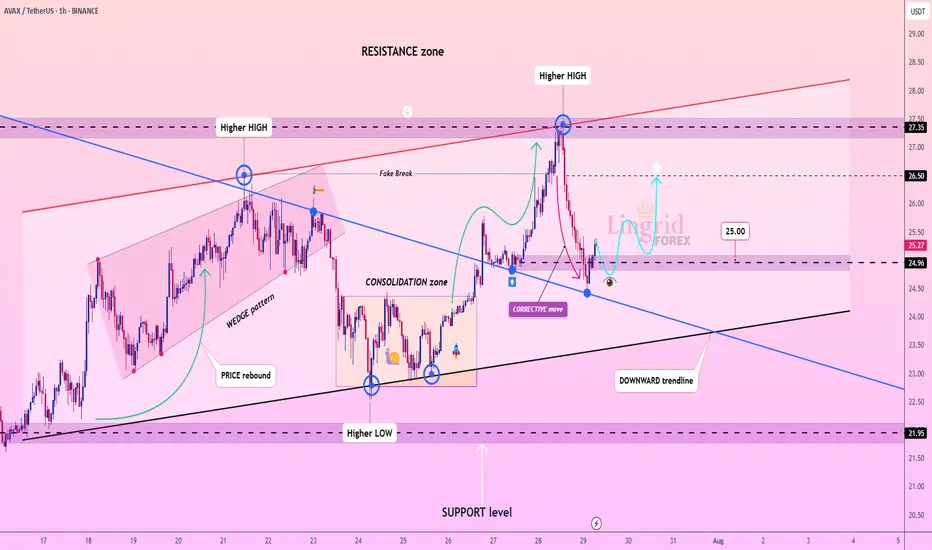
Lingrid | AVAXUSDT Corrective Move In The MarketThe price perfectly fulfilled my previous idea . BINANCE:AVAXUSDT retraced sharply from the 27.34 resistance zone after making a higher high but found support above the descending trendline. The recent corrective move has paused at a key structure level near 24.96, hinting at potential bullish continuation. A breakout above this local resistance could trigger a rally toward the 26.50–27.34 target zone. Momentum builds as long as price remains above the trendline and higher low structure.
📈 Key Levels
Buy zone: 24.80 – 25.30
Buy trigger: Break and hold above 25.30
Target: 26.50
Invalidation: Close below 24.00
💡 Risks
Downward trendline still active and could act as resistance
Potential for bearish fakeout before breakout
Failure to reclaim 25.30 quickly weakens bullish scenario
If this idea resonates with you or you have your own opinion, traders, hit the comments. I’m excited to read your thoughts!
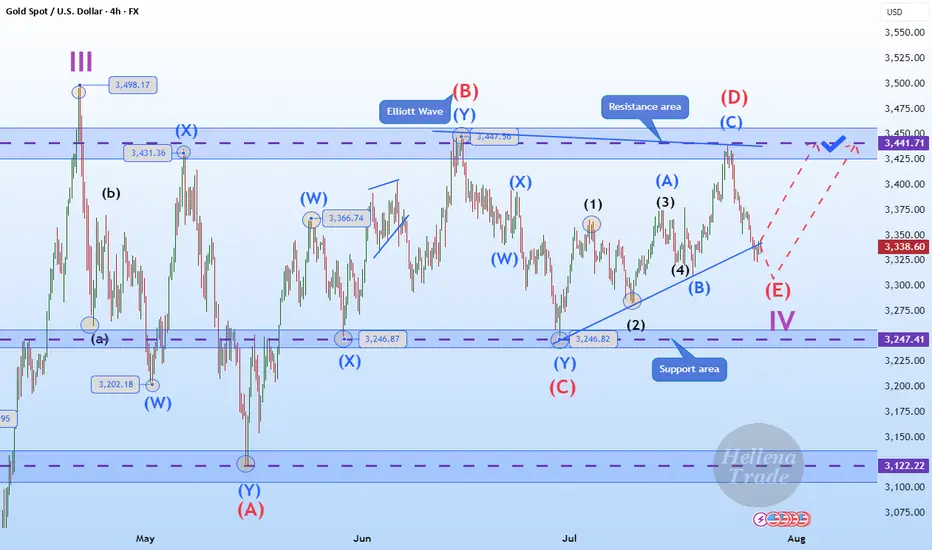
Hellena | GOLD (4H): LONG to resistance area of 3440 (Wave V).As you can see, everything turned out to be more complicated than I had previously thought. We are dealing with a complex correction and a diagonal. I believe that the “ABCDE” waves, which make up the corrective wave “4”, are completing their levels, and I continue to expect the upward movement to continue.
The first area I expect is the resistance area of 3440. This will be the beginning of the large upward wave “V.”
Manage your capital correctly and competently! Only enter trades based on reliable patterns!
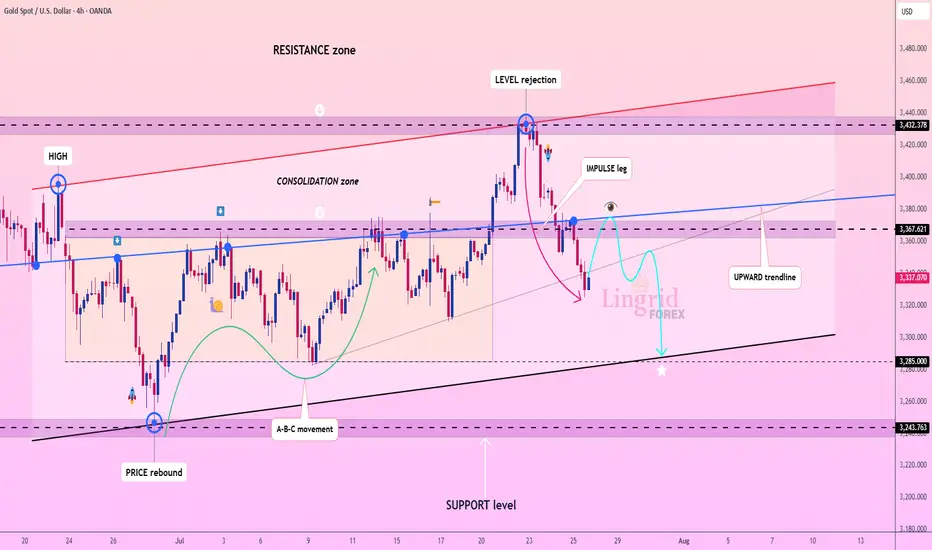
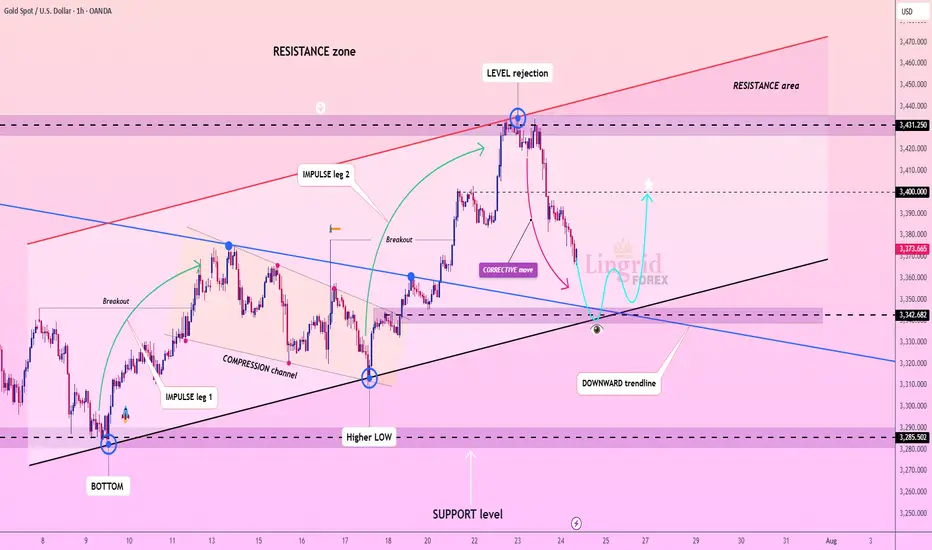
Lingrid | GOLD Weekly Market Outlook: Resistance Zone RejectionOANDA:XAUUSD markets have encountered significant resistance at the $3,450 level, resulting in a notable rejection and subsequent pullback toward support zones. The precious metal is now testing critical technical levels that will determine whether the broader bullish momentum can be sustained or if deeper correction is imminent.
The 4H chart reveals a clear level rejection at the resistance zone, followed by an impulse leg lower that has broken the upward trendline. This development suggests a potential shift in short-term momentum, with gold now trading within the consolidation zone between $3,365 and $3,285. The break of the ascending trendline is particularly significant, indicating that bulls may be losing control of the immediate price action.
The second chart provides valuable context with the weekly and 16-hour timeframe analysis. The pinbar rejection candle on the weekly chart confirms strong selling pressure at these elevated levels. The 16-hour chart shows multiple tests of the upward trendline, with the recent break potentially signaling a bearish impulse leg. However, the overall structure remains within the broader ascending channel, suggesting this could be a healthy correction within the long-term uptrend.
Critical levels to monitor include the $3,285 support zone and the broken trendline at $3,365. A decisive break below $3,285 could trigger a deeper correction toward $3,200, while reclaiming the upward trendline would restore bullish momentum toward new highs.
If this idea resonates with you or you have your own opinion, traders, hit the comments. I’m excited to read your thoughts!
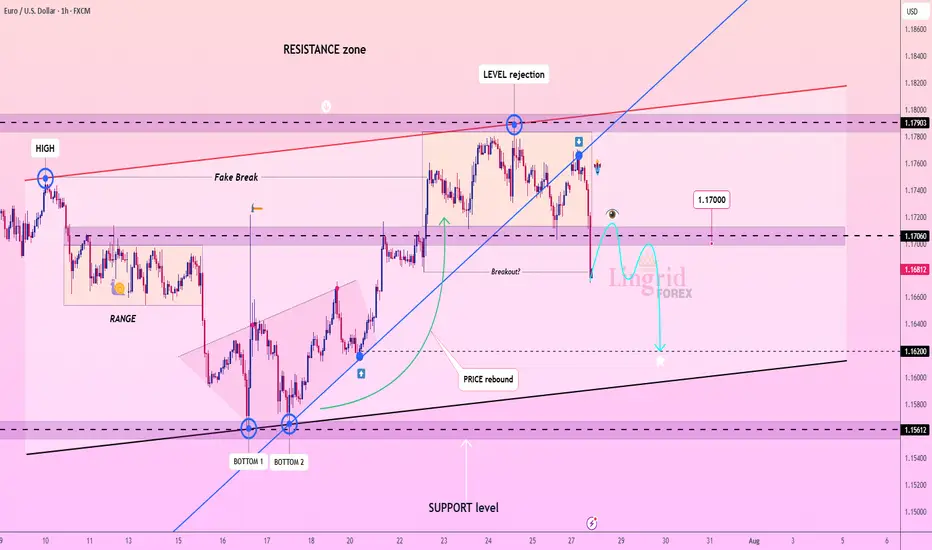
Lingrid | EURUSD Drops from 1.18000 RESISTANCE. Possible ShortFX:EURUSD is showing strong rejection at the resistance zone near 1.1790 after multiple fake breaks and failed attempts to sustain above the key level. Price has now broken below the mid-range and is forming a bearish rejection pattern right at the edge of the breakout area. With bearish momentum accelerating and a move toward 1.1620 support appears likely. Breakdown from the consolidation channel favors trend continuation to the downside.
📉 Key Levels
Sell trigger: Breakdown below 1.1660
Sell zone: 1.1700 – 1.1730
Target: 1.1620
Invalidation: Break above 1.1750
💡 Risks
Sudden bullish engulfing near 1.1670 could negate the breakdown
Support at 1.1620 may trigger a bounce
US macro data could shift trend dynamics mid-move
If this idea resonates with you or you have your own opinion, traders, hit the comments. I’m excited to read your thoughts!
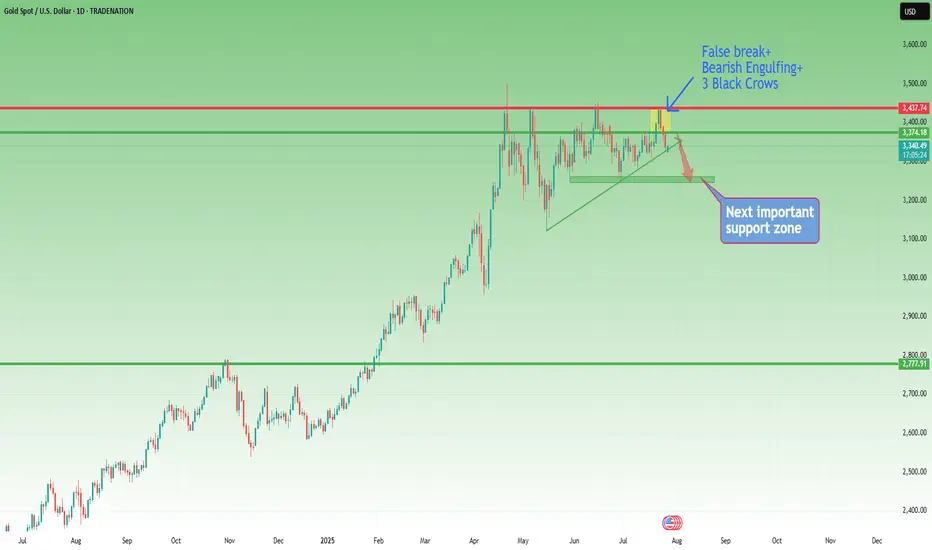
Gold Breakout Failed – Bearish Reversal in Play?Last week was both interesting and revealing for Gold.
After breaking above the key $3375 resistance—which also marked the upper boundary of a large triangle—price quickly accelerated higher, reaching the $3440 resistance zone.
However, instead of a bullish continuation, we witnessed a false breakout and sharp reversal. What initially looked like a healthy pullback turned into a full bearish rejection by week’s end.
________________________________________
📉 Current Technical Picture:
• On the daily chart, we now see a clear Three Black Crows formation
• On the weekly chart, a strong bearish Pin Bar confirms rejection
• And if we add the failed breakout above 3375, the bias tilts decisively bearish
________________________________________
📌 Key Zones and Trading Plan:
• Gold is currently bouncing from the ascending trendline zone, which is natural after dropping more than 1,000 pips in just 3 days
• The $3375–3380 area has regained importance as a key resistance zone, and that’s where I’ll be looking to sell rallies
• A bullish invalidation would only come if price manages to stabilize above $3400
Until then, this remains a bear-dominated market, and a drop below $3300 is on the table.
________________________________________
🧭 Support levels to watch:
• First support: $3280
• Major support: $3250 zone
________________________________________
📉 Conclusion:
The failed breakout, bearish candle formations, and current price structure all point to a market that's shifting in favor of sellers.
I’m looking to sell spikes into resistance, with a clear invalidation above $3400.
Disclosure: I am part of TradeNation's Influencer program and receive a monthly fee for using their TradingView charts in my analyses and educational articles.
INJ – From Overhyped to Reasonable OpportunityA year and a half ago, INJ was in full hype mode, with fantasmagorical predictions of $200+, even though the coin had already done a 40x move.
(And not to brag—but at that moment, with INJ trading around $40, I said that $10 was far more likely than $200. It actually dropped to $6.5...)
Fast forward to today, and things are starting to look more constructive—at least, if you're not aiming for the moon:
🔹 After the local low at $6.5, price formed a small inverted Head & Shoulders
🔹 Then it confirmed new support at $10, a key psychological level and neckline zone
🔹 Now it's pressing into the $15.5 resistance
From my perspective, the setup is starting to favor the bulls.
If we get a clean breakout above $15.5, the next resistance is around $20, but I wouldn’t be surprised to see a push to $25–26, or even slightly above $30, if momentum builds.
📌 Not a hype call.
It’s a realistic technical setup, built on structure—not dreams.
SEI Breakout Setup: Buy the Dip Before the Next Leg UpAfter the low around 0.13 in April, SEI started to recover, and although the first attempt to reclaim the 0.25–0.26 zone failed in mid-May, that key area—a former support from last year—was finally broken at the end of June.
Now, this previous resistance has turned into support, and even though gains have so far been capped by the falling trendline, price is consolidating above support – which could be a sign of bullish pressure building.
If we get a clean break above this descending trendline, momentum could accelerate, opening the way for a push toward the 0.75 resistance.
This is exactly the scenario I’m working with.
I'm looking to buy dips, with an ideal entry around 0.30, while keeping in mind that a move below 0.25 would invalidate the setup.
✅ Risk-reward? With a stop below 0.25, this setup offers a 1:4 R:R, and even a realistic chance at a 2x trade, which would be quite reasonable under current market conditions.

XAUUSD – The Structure Is Still Bullish... But Barely Holding 📌 In yesterday’s analysis, I mentioned that although Gold corrected deeper than expected, dropping below 3400, the bullish structure remained intact — and I stayed true to that view by buying dips.
🎯 The trade didn’t go as planned. Fortunately, the New York rebound from 3350 helped me exit at breakeven.
🧭 So now the big question is:
Is Gold reversing to the downside?
The answer: Not confirmed yet.
The structure is technically still bullish, but the chart is far from pretty.
🧨 What’s going wrong?
❌ Bearish engulfing candle on Wednesday – I chose to ignore it yesterday, but it’s still there.
❌ The breakout above 3375 (ascending triangle resistance) is failing – and could now turn into a false breakout trap.
❌ The ascending trendline from January 2025 is under pressure.
❌ And if today we close near 3350, the weekly chart will show a bearish Pin Bar – not exactly a sign of strength.
📉 My current plan:
- If price rallies back above 3380 → I’m looking to sell into strength, not buy.
- If we break below 3350 → I’ll also look to sell the breakdown.
Right now, for Gold to regain bullish momentum, it needs to reclaim 3400. No compromise.
⚠️ Summary:
Yes, the bigger structure is still bullish.
But momentum is fading, and price action is starting to turn against the bulls.
We need confirmation, not hope.
If 3350 breaks cleanly – things could accelerate to the downside.
Disclosure: I am part of TradeNation's Influencer program and receive a monthly fee for using their TradingView charts in my analyses and educational articles.

Lingrid | GOLD Corrective Move: Potential Long Trade OpportunityThe price perfectly fulfilled my last idea . OANDA:XAUUSD is pulling back sharply after facing rejection from the key resistance level at 3431, following a two-leg impulse wave. The structure shows a correction within an active uptrend, nearing confluence support from the upward trendline and horizontal level. As long as price holds above 3342, a bounce and continuation toward 3400 remain the favored scenario. Broader bullish structure and momentum buildup point to a possible resumption after the current retracement.
📉 Key Levels
Buy trigger: Break above 3350
Buy zone: 3345 – 3340
Target: 3400
Invalidation: Break below 3320
💡 Risks
Failure to hold the upward trendline could shift momentum
Weak bounce may trap buyers before real breakout
Resistance at 3400 could remain firm without stronger volume support
If this idea resonates with you or you have your own opinion, traders, hit the comments. I’m excited to read your thoughts!
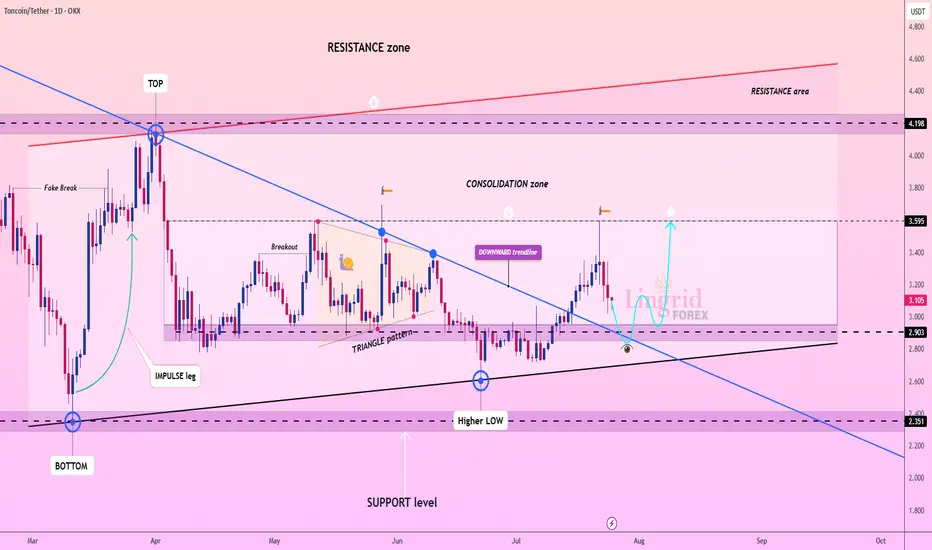
Lingrid | TONUSDT Potential Rebound from Support ZoneThe price perfectly fulfilled my last idea . OKX:TONUSDT is testing support after pulling back from the consolidation zone and forming a higher low above key structure. The chart shows a breakout from the downward trendline followed by a corrective retracement back toward confluence support. As long as price stays above 2.903, a bounce and renewed move toward 3.595 remains the base case. Structure favors bullish continuation after the retest of the breakout level.
📉 Key Levels
Buy trigger: Break and hold above 3.200
Buy zone: 2.903 – 3.050
Target: 3.595
Invalidation: Break below 2.903
💡 Risks
Failure to hold confluence of upward trendline and horizontal support
Weak follow-through above 3.2 could indicate distribution
Resistance at 3.595 may trigger renewed selling before breakout
If this idea resonates with you or you have your own opinion, traders, hit the comments. I’m excited to read your thoughts!
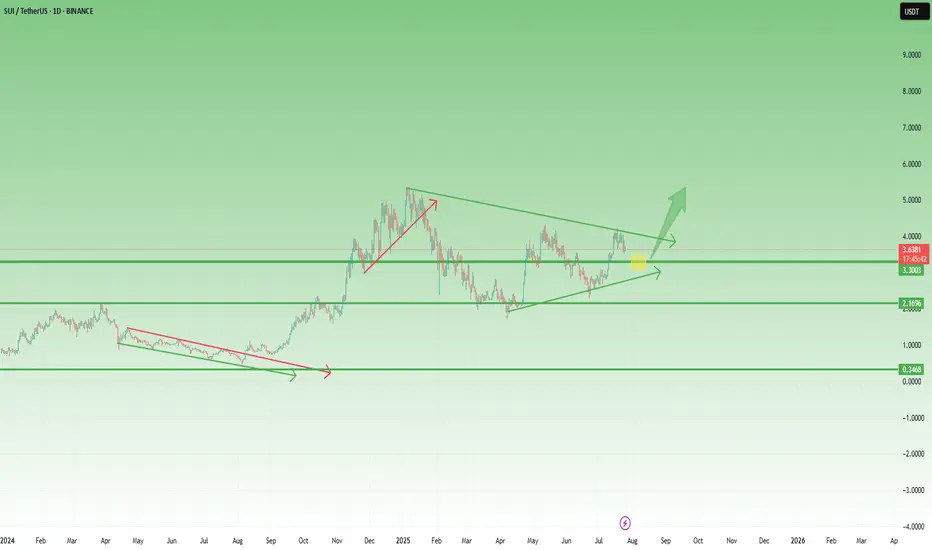
SUI – Preparing for a Breakout? Symmetrical Triangle in PlaySince the beginning of the year, SUI has been consolidating inside a classic symmetrical triangle — marked by higher lows and lower highs, a sign of tightening price action and growing pressure.
This kind of structure doesn’t last forever.
Usually, it ends with a strong breakout — especially if supported by volume.
🔍 What to watch:
- A break above the upper trendline could trigger a strong move, with potential targets in the $5 area and even a new ATH, if altcoins enter a real revival phase.
- On the flip side, $2.80 remains the key support level.
As long as it holds, bulls remain in control of the structure.
📍 My game plan:
I’m watching the $3.25 area as a potential buy zone —a great spot inside the pattern, offering tight risk and strong upside if the breakout comes.
Until then, it’s all about patience.
Pressure is building. The triangle is tightening.
And the market is waiting for a reason to move.
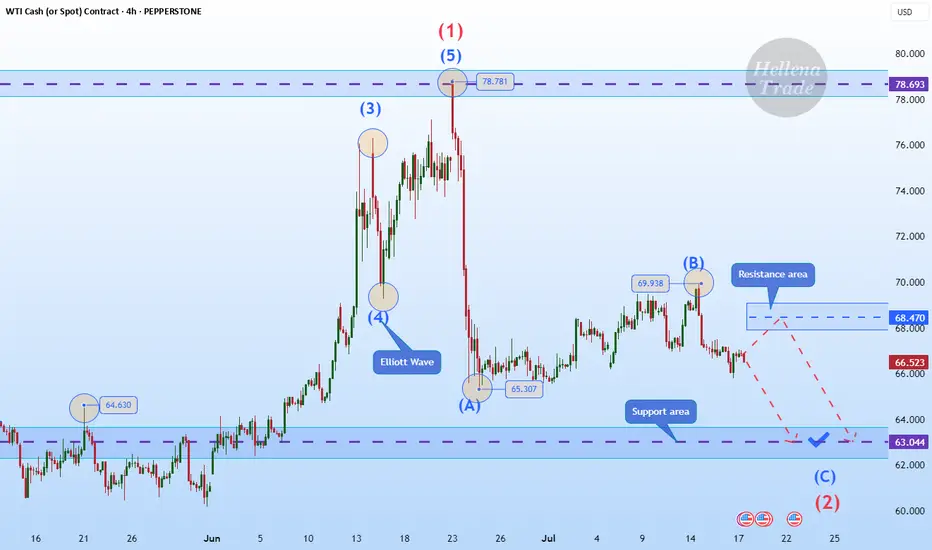
Hellena | Oil (4H): SHORT to support area of 63.000.Colleagues, I believe that wave “B” has formed at the level of 69.938, and now we expect the downward movement to continue with the aim of completing wave ‘C’ of the middle order and wave “2” of the higher order in the support area of 63,000.
It is quite possible that the price could reach the 60,000 level, but I think that for now it is worth focusing on the nearest targets.
Manage your capital correctly and competently! Only enter trades based on reliable patterns!
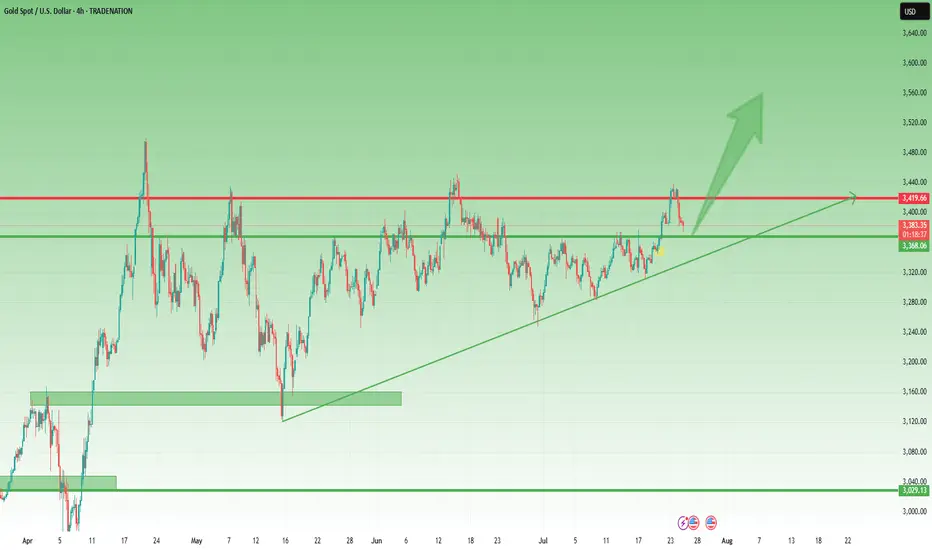
Gold Correction Went Deeper, but the Bullish Structure Intact📌 Quick recap from yesterday:
In my previous analysis, I mentioned that I was looking to buy dips around 3400, expecting a continuation move toward the ATH near 3500.
That was the plan.
But as the day unfolded, I removed my pending buy order — and explained exactly why in an educational post on how context can override entry levels.
If you read that, you already understand:
It’s not where price goes. It’s how it gets there.
________________________________________
📉 So… where are we now?
The big question is:
Was this just a deeper correction, or is Gold preparing to shift direction entirely?
In my opinion, we’re still in a healthy correction, not a reversal.
Why?
• Price remains above the horizontal support — the same level that acted as resistance last week
• The market is still above the trendline from mid-May
• No breakdown, no major structure violation — just deeper retracement after a sharp impulsive move
________________________________________
📈 What’s the plan going forward?
As long as these two supports hold, I believe the buy-the-dip narrative remains valid — even at better prices.
In fact, I already entered a new long position about an hour ago, which is currently up around 90 pips at the time of writing.
My bias stays bullish unless proven otherwise.
________________________________________
📌 Conclusion:
Yes, the correction went deeper than expected.
Yes, I removed a pending order — because the reaction was not what I wanted to see.
But structure still supports continuation, and I remain in the buy-the-dip camp as long as key support holds. 🚀
Disclosure: I am part of TradeNation's Influencer program and receive a monthly fee for using their TradingView charts in my analyses and educational articles.
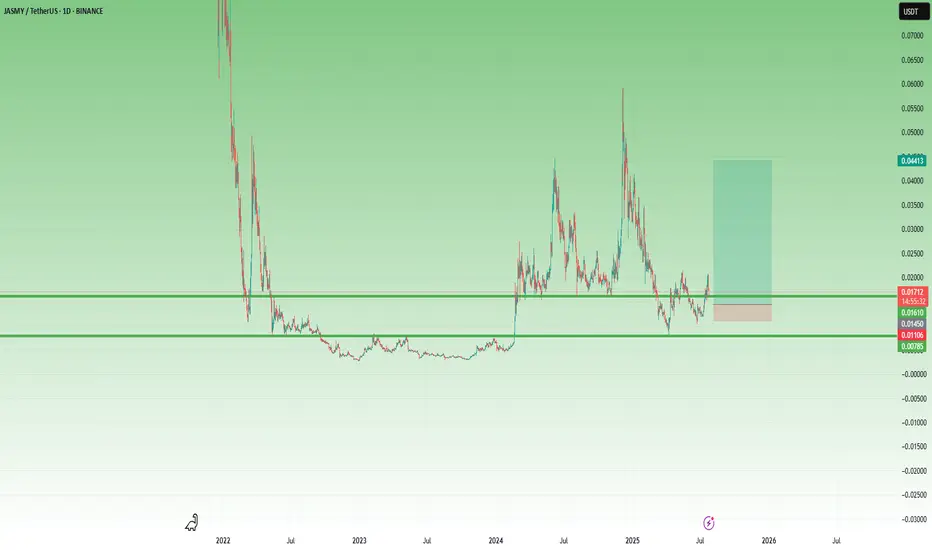
JASMY – A Volatile Setup with x3 Potential 🔸 After bottoming out at 0.003 and spending over a year in accumulation, JASMY finally broke above the key 0.008 resistance zone in February 2024. That breakout triggered a series of explosive moves – but just as violent were the drops that followed.
🔸 What stands out:
• The first post-breakout spike found a new support at 0.015.
• Then came a second vertical move toward 0.06, followed (of course) by a brutal drop.
• But… 0.008 held, and by late June, the chart printed a higher low, showing that buyers became interested.
📍 Right now, the price has reclaimed the 0.015 zone and is trying to stabilize above it. If this level holds, it could become the new base for the next wave.
💡 My plan?
This is very speculative, but I like the setup.
I’m looking to buy around 0.015–0.016, with clear negation below 0.010.
Target? Around 0.045, for a potential x3 move and a tasty 1:8 risk/reward.
⚠️ I’m not the guy who repeats the cliché “ only trade what you can afford to lose, ”
but seriously – this one is for clubbing money, not summer vacation money.
Let the volatility work in our favor. 🚀
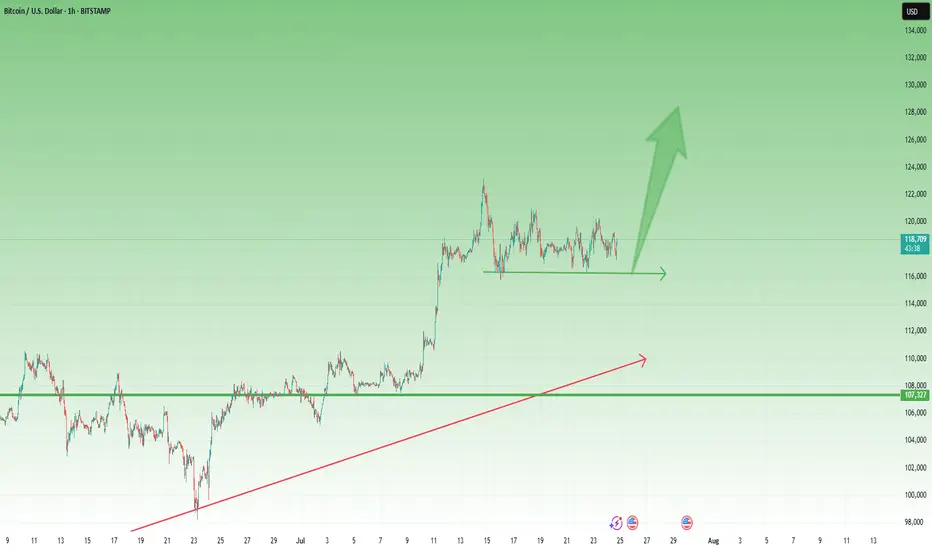
BTCUSD – Bulls Still in Control After New ATH 🔸 After the new All-Time High printed 10 days ago, Bitcoin entered a consolidation phase. So far, the market looks healthy and seems to be waiting for a trigger to continue the uptrend.
🔸 A clear support zone has formed around 116k, and as long as this level holds, bulls remain in full control of the market.
📉 For short-term traders and speculators:
Buying dips near 117.5k could offer solid risk/reward setups, with a target around 125k in case of a breakout.
Let’s see if the market gives us the trigger we’re waiting for. 🚀
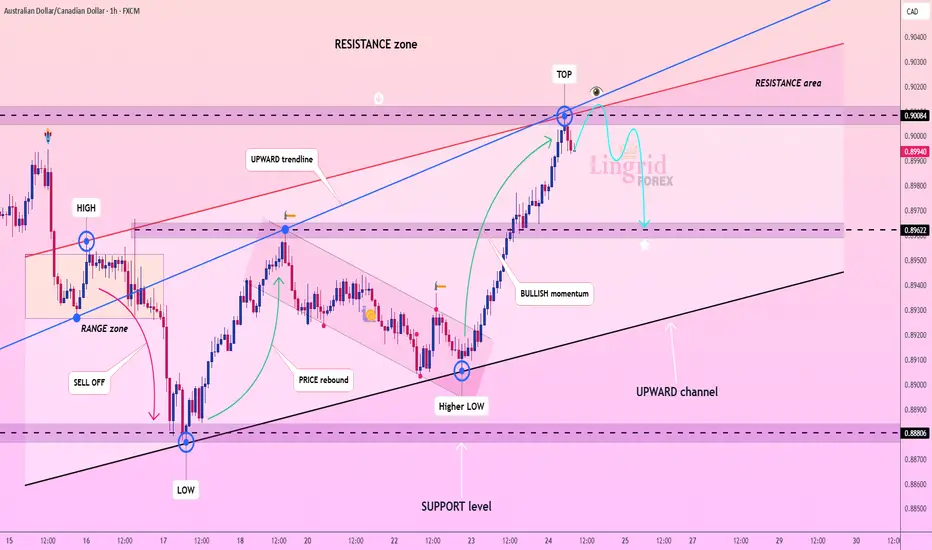
Lingrid | AUDCAD Short Following Resistance Fake Breakout The price perfectly fulfilled my last idea . FX:AUDCAD is rejecting from the top of the resistance zone after a strong bullish impulse and has started forming a rounded top pattern. Price remains inside an upward channel but is showing signs of exhaustion with the blue arrow projecting a pullback. As long as the price stays below 0.9008, we expect a descent toward the 0.8962 region. Momentum is cooling, and a bearish correction is likely before any bullish attempt resumes.
📉 Key Levels
Sell trigger: Break below 0.8990
Sell zone: 0.8995 – 0.9012
Target: 0.8962
Invalidation: Break and close above 0.9025
💡 Risks
Strong bullish momentum may resume if support holds
Failure to break 0.8990 could trap early sellers
Macro data from AUD/CAD region may disrupt the structure
If this idea resonates with you or you have your own opinion, traders, hit the comments. I’m excited to read your thoughts!
Lingrid | SUIUSDT Buying Opportunity from Support ZoneBYBIT:SUIUSDT is pulling back from the recent range top after testing the resistance zone and is approaching the key breakout area. The structure shows an upward channel with a prior consolidation breakout and an ongoing corrective retracement. As long as the price holds above the confluence zone near 3.35, the bullish structure remains intact. Broader momentum supports trend continuation toward the upper resistance boundary and the target area.
📉 Key Levels
Buy trigger: Break above 3.75 with volume
Buy zone: 3.25 – 3.35
Target: 4.24
Invalidation: Break below 3.22
💡 Risks
Breakdown below channel support would flip structure bearish
Fading volume on bounce may signal exhaustion
Broader market weakness could suppress upside momentum
If this idea resonates with you or you have your own opinion, traders, hit the comments. I’m excited to read your thoughts!

EURUSD – Bulls Still in Control, Trend ResumesIn my previous EURUSD analysis, I pointed out that the pair was nearing an important confluence support around 1.1620, and that – given the overall bullish trend – this zone could offer solid long opportunities.
What followed?
The market briefly dipped below that zone, even challenging the psychological 1.1600 round number. But instead of breaking down, bulls regrouped, stepped in with force, and pushed the pair aggressively higher.
📍 At the time of writing, EURUSD is trading at 1.1770, and my long trade is running with a comfortable 150 pips profit.
🔍 W hat’s Next?
The current structure suggests a continuation of the uptrend, and the logical technical target is the recent high at 1.1830.
Until proven otherwise, this is still a buy-the-dip market.
✅ Buying around 1.1700 could be a valid setup, especially if we see buying power on the intraday chart
⚠️ The Warning Sign
Despite the bullish bias, keep in mind:
If EURUSD drops and closes below 1.1670, the structure begins to shift — and this could signal a deeper correction or even trend reversal.
📌 Until then, the bias remains bullish, dips are to be watched for entries, and 1.1830 is the next checkpoint.
D isclosure: I am part of TradeNation's Influencer program and receive a monthly fee for using their TradingView charts in my analyses and educational articles.
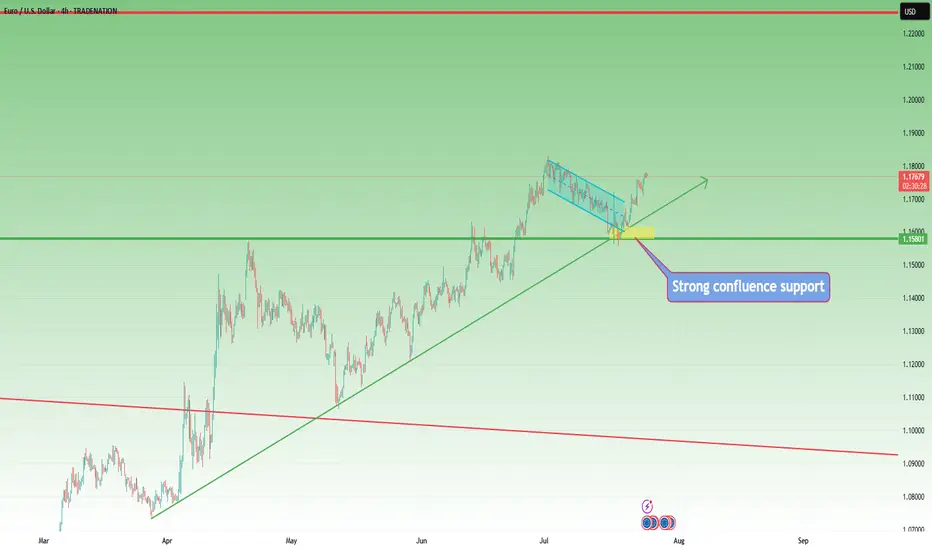
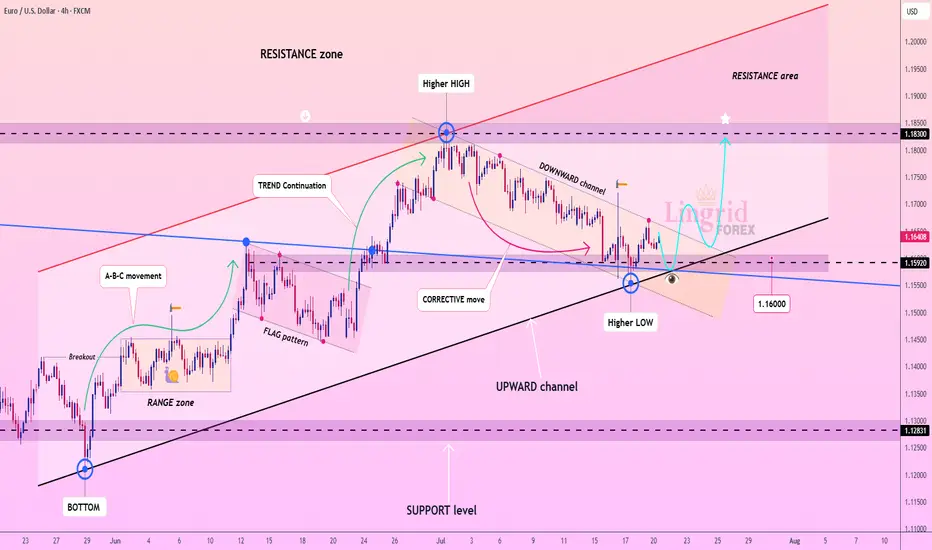
Lingrid | EURUSD Potential Surge Following Channel BreakoutFX:EURUSD is consolidating after bouncing from a key confluence of support around 1.16000 and forming a higher low within the upward channel. The recent corrective pullback through a downward channel now appears complete, with bullish structure resuming. Price is likely to advance toward the 1.18300 resistance as long as the 1.15900 zone holds. Momentum favors a continuation of the A-B-C and trend continuation sequences already established.
📉 Key Levels
Buy trigger: Break above 1.16500
Buy zone: 1.16000–1.16250
Target: 1.18300
Invalidation: Close below 1.14500
💡 Risks
Failure to break the corrective channel resistance
Bearish divergence on lower timeframes
Broader USD strength reversal
If this idea resonates with you or you have your own opinion, traders, hit the comments. I’m excited to read your thoughts!